Download as PDF, PPTX


![Table Browser
Local Column
Table Tabs
List Data
(Values in [ ])
Shared Column](https://image.slidesharecdn.com/bioinformaticssummittutorial1-140411191733-phpapp01/75/Cytoscape-Tutorial-Session-1-at-UT-KBRIN-Bioinformatics-Summit-2014-4-11-2014-24-2048.jpg)


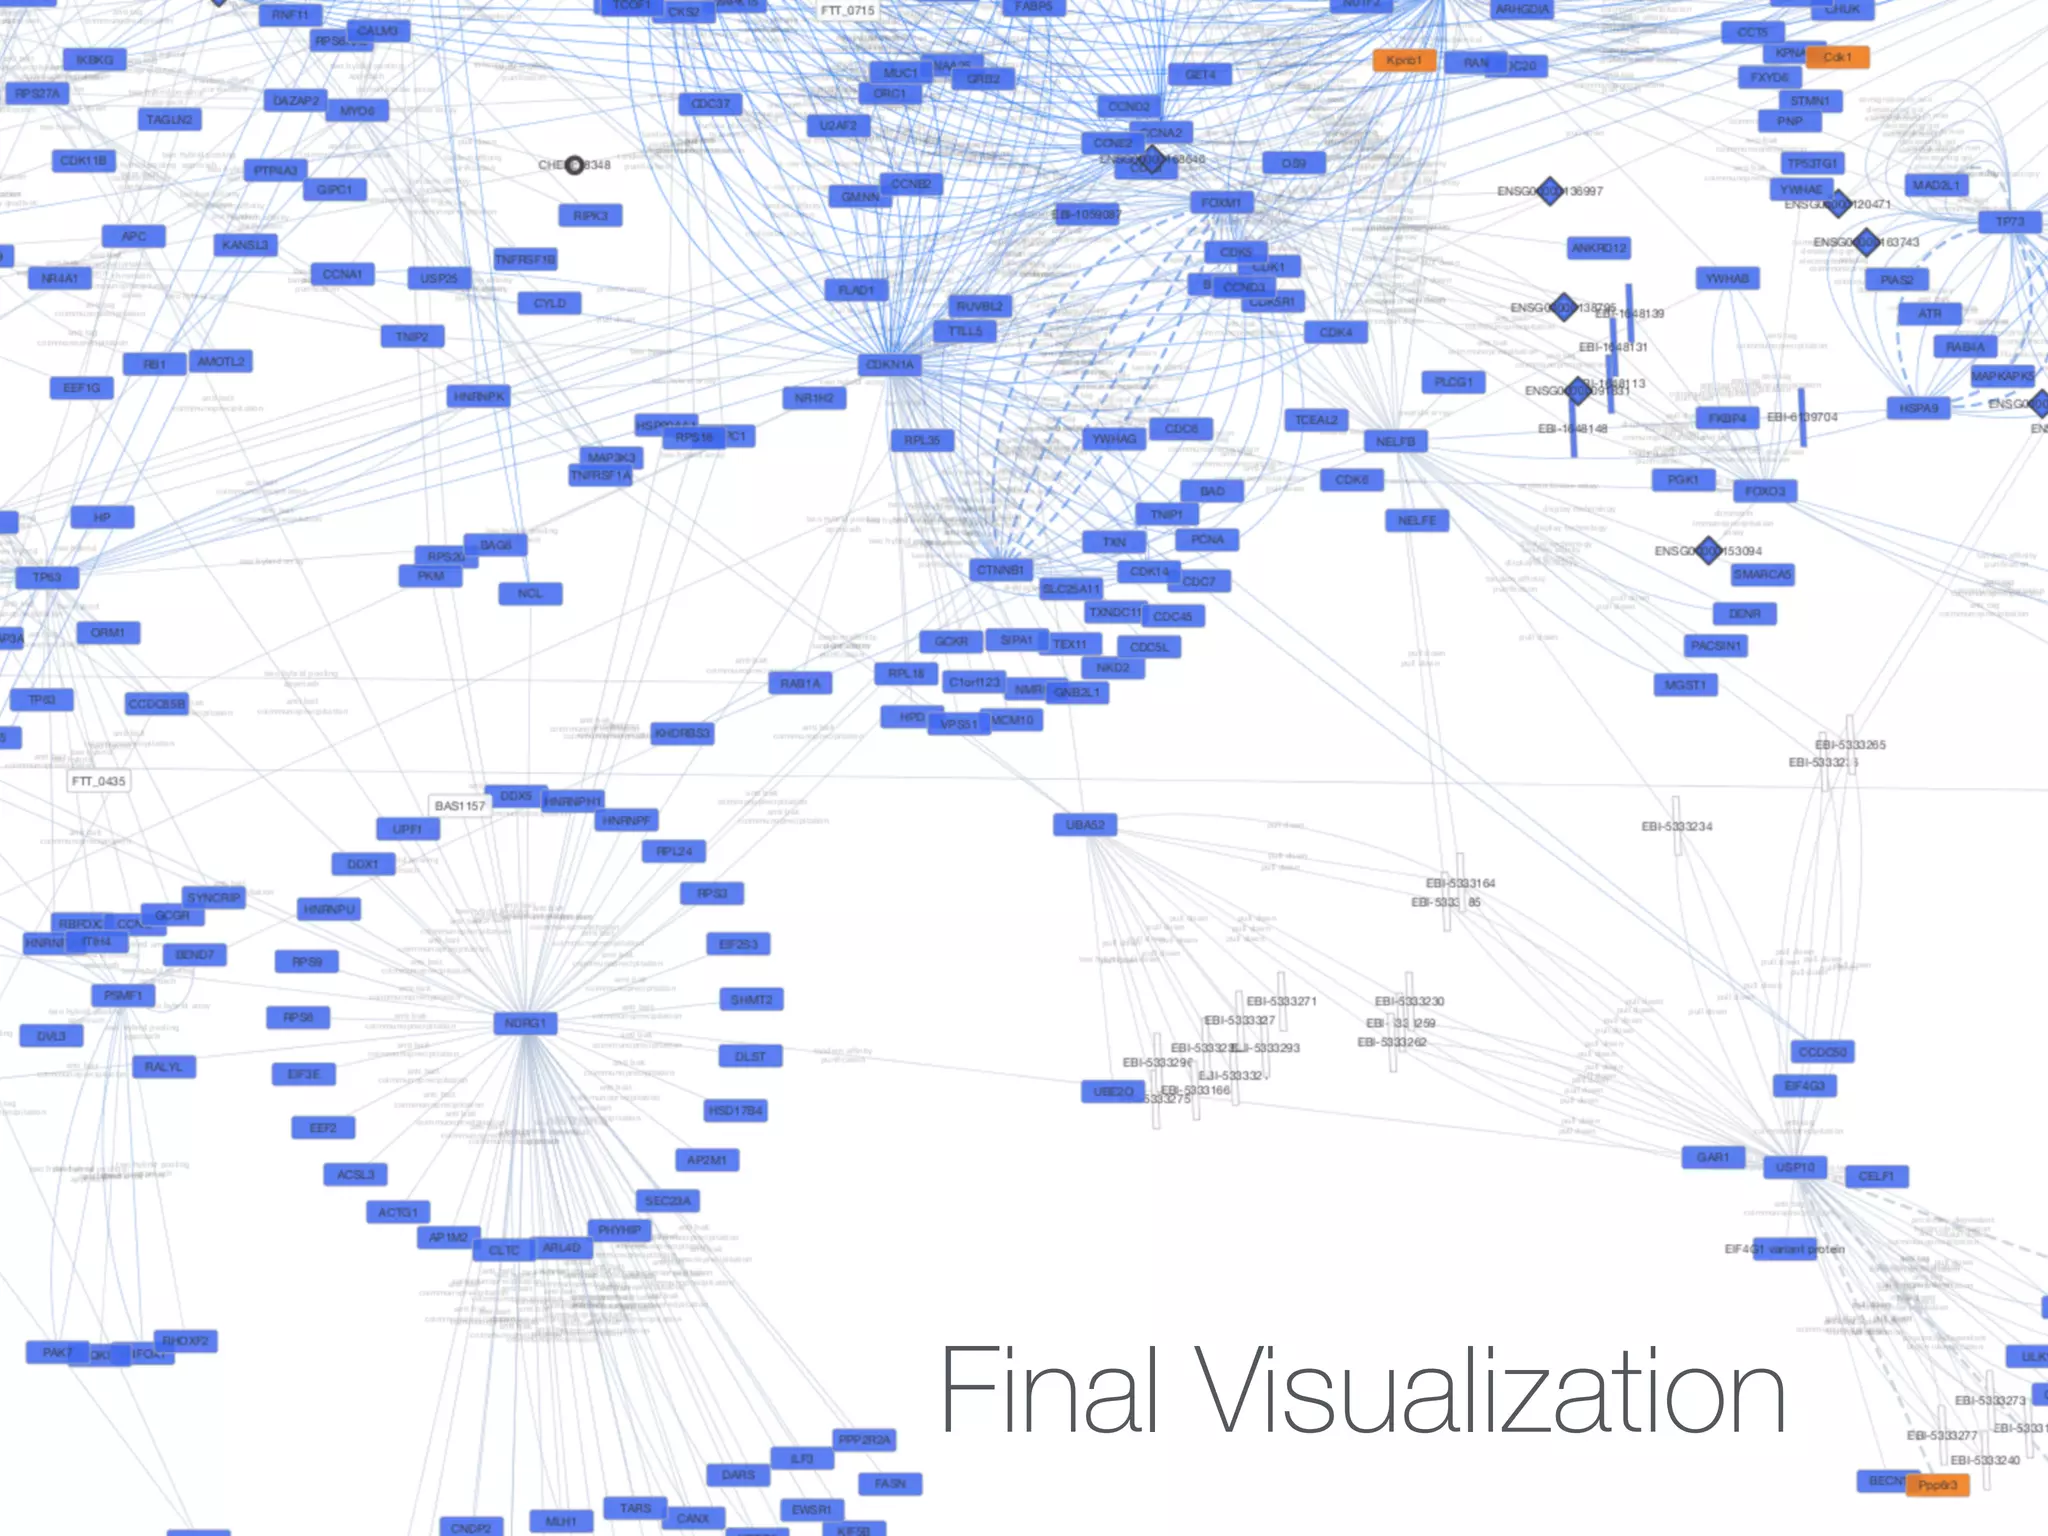


This document outlines a tutorial on biological data analysis and visualization using Cytoscape. The tutorial covers basic concepts like networks and tables in Cytoscape, data import, network analysis features, and visualization techniques. It discusses loading sample network data, calculating network statistics, filtering networks, basic search functionality, and applying visual styles. The tutorial is intended to provide a practical introduction to Cytoscape's core features through examples and demos.
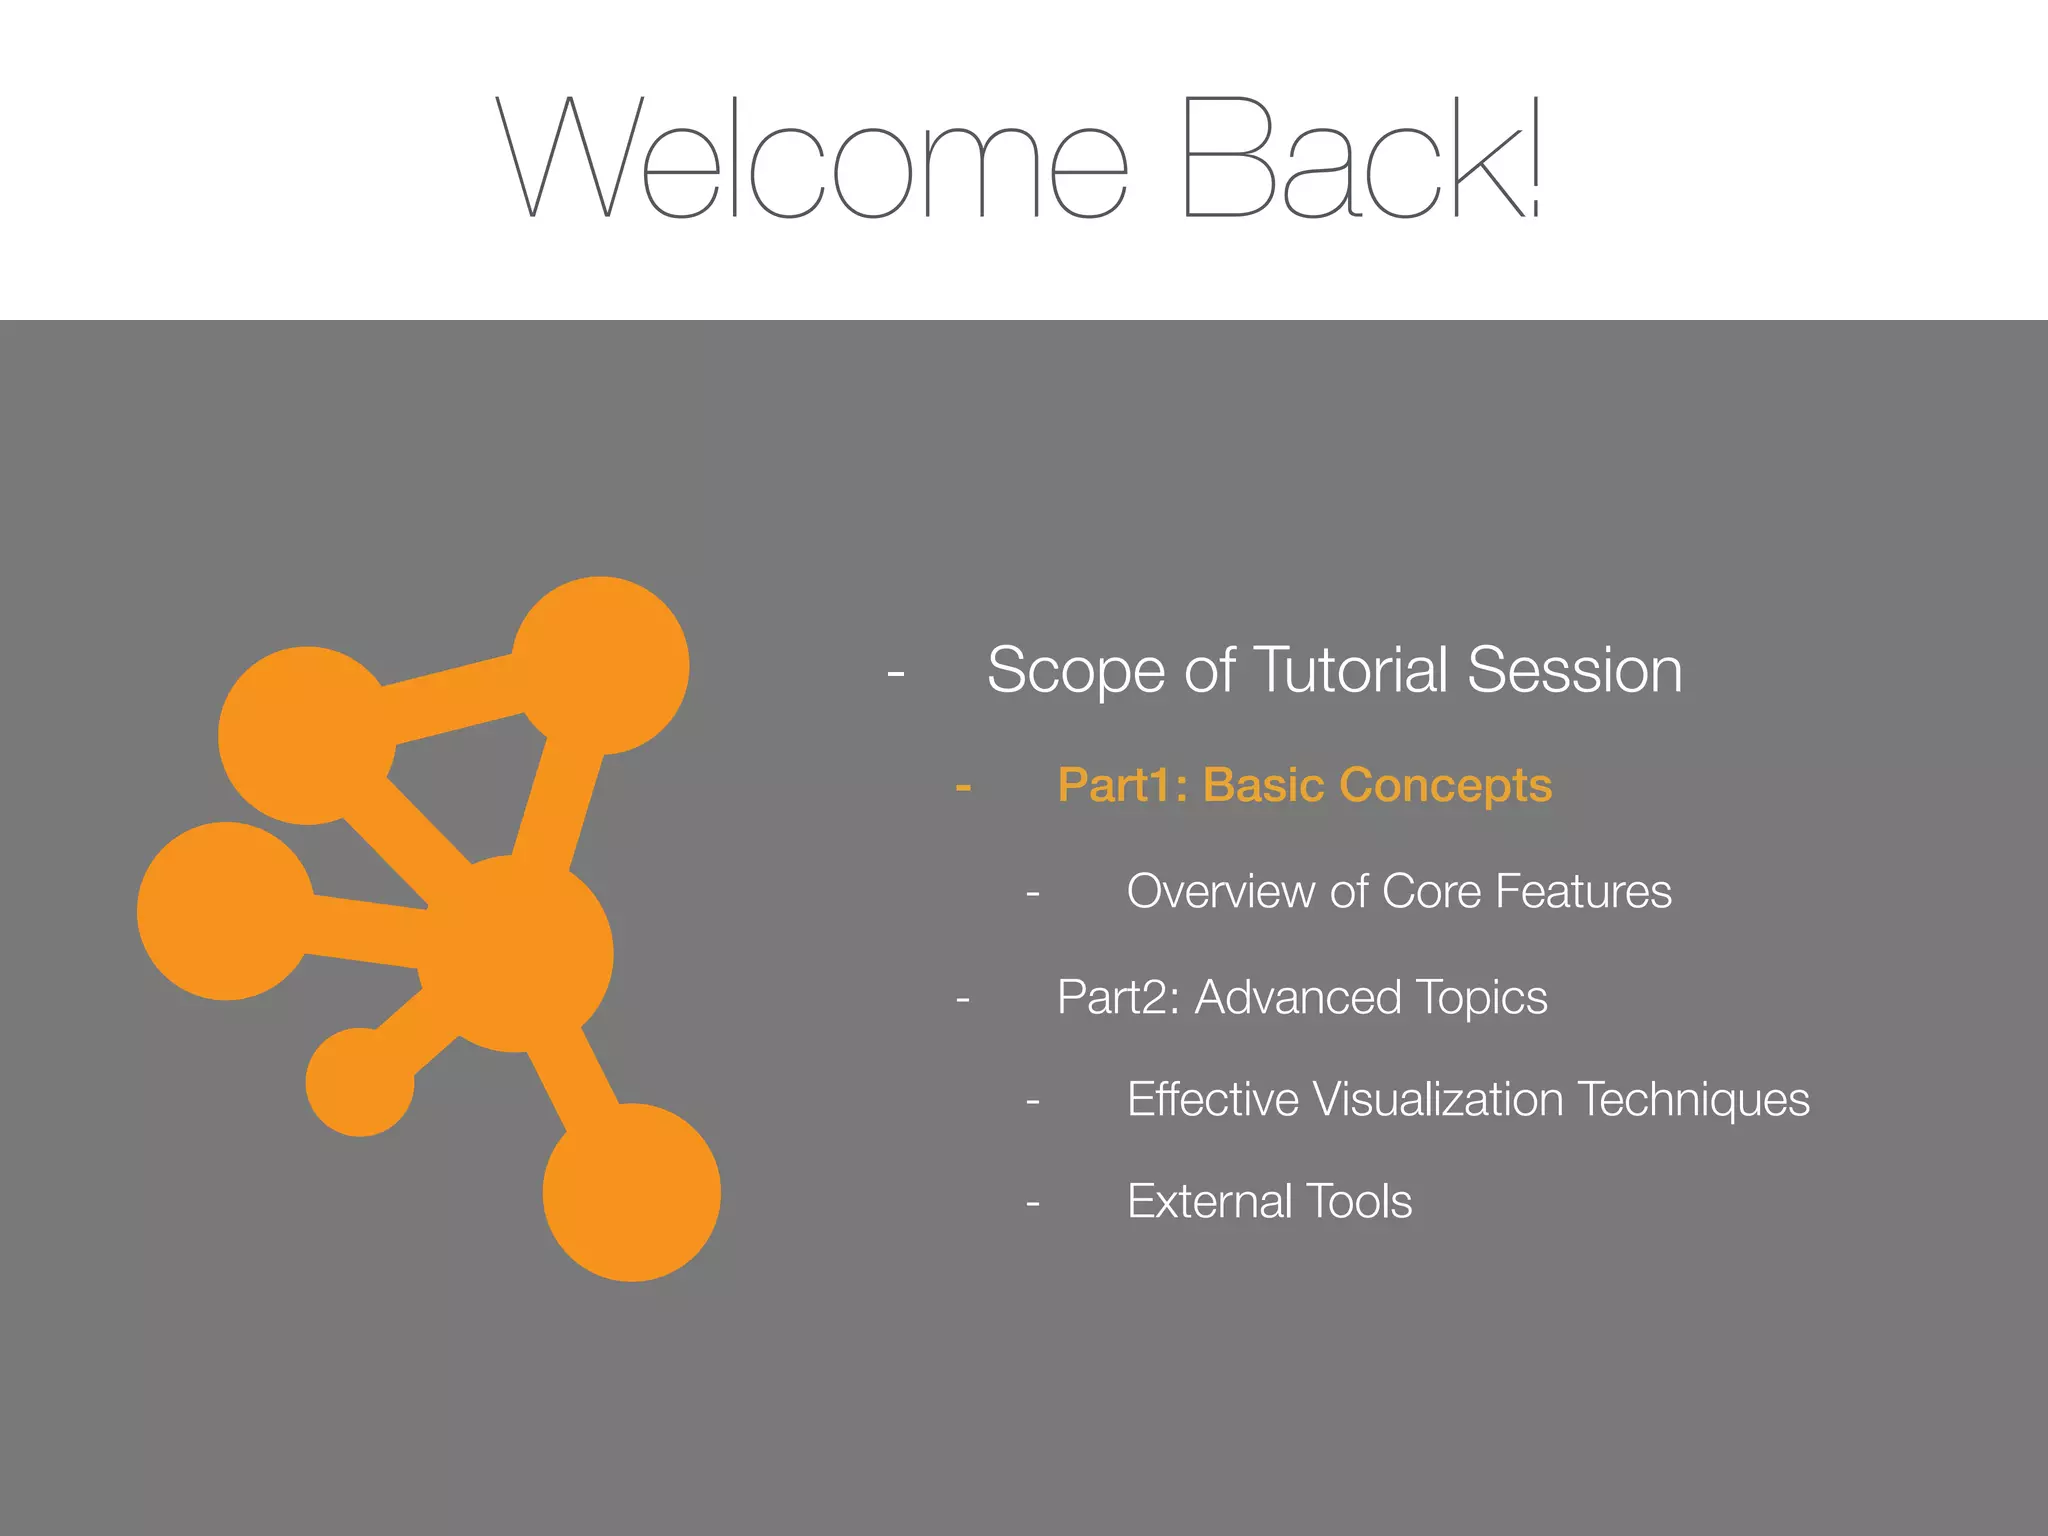
Introduction to the tutorial on Biological Data Analysis using Cytoscape, covering basic concepts, core features, and advanced topics.
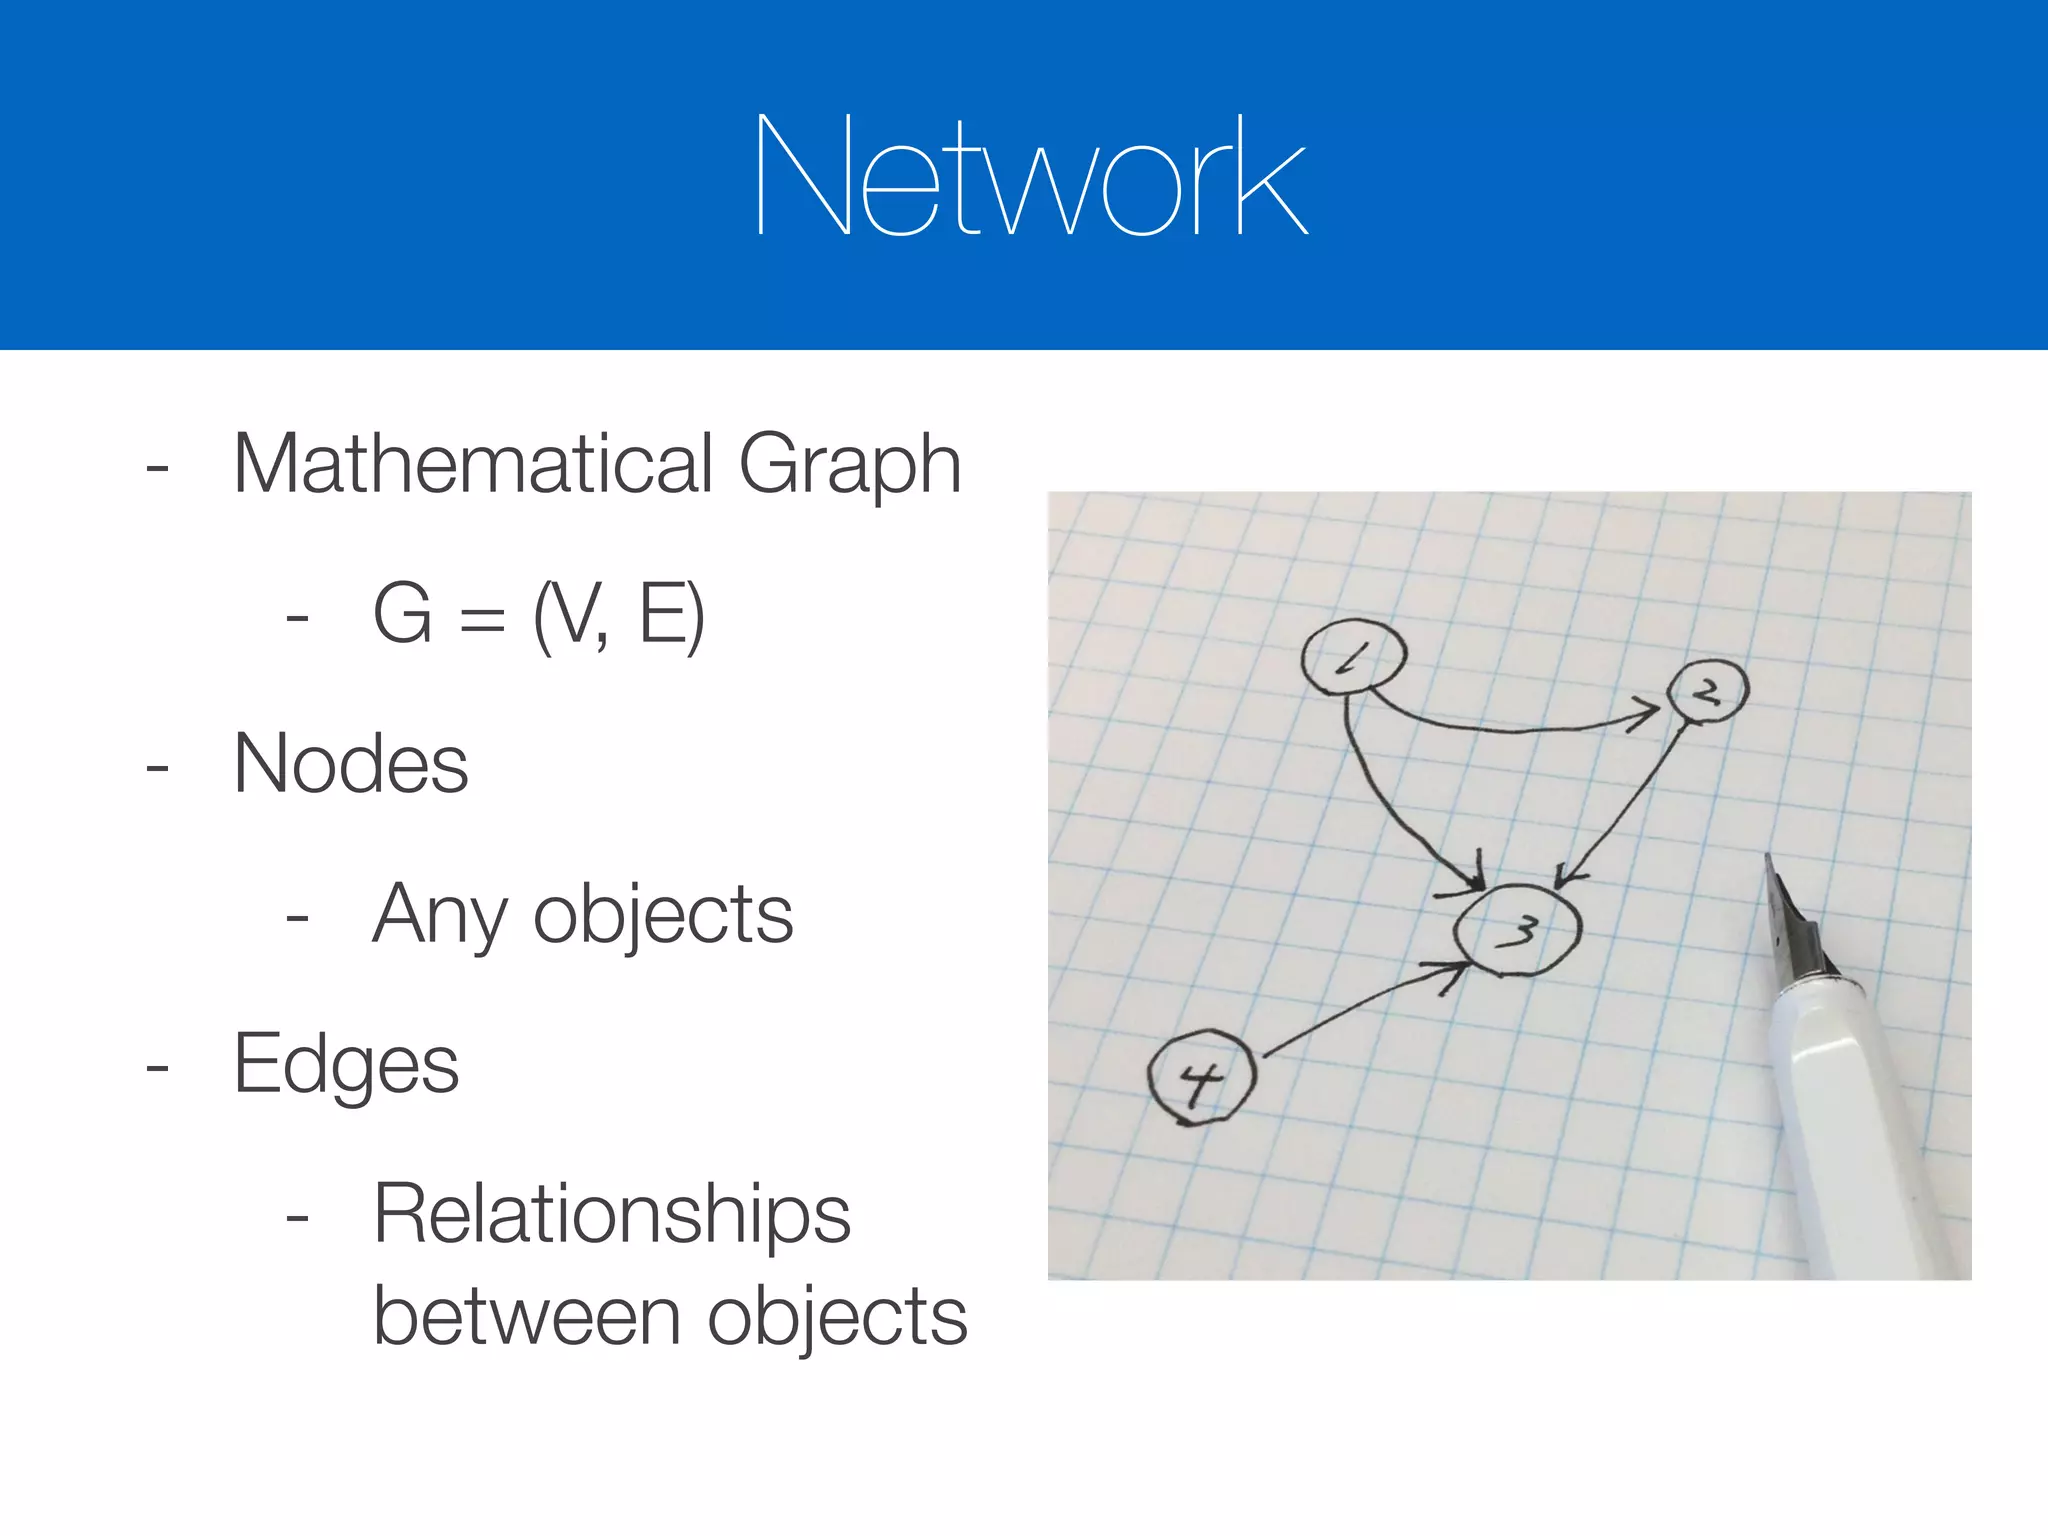
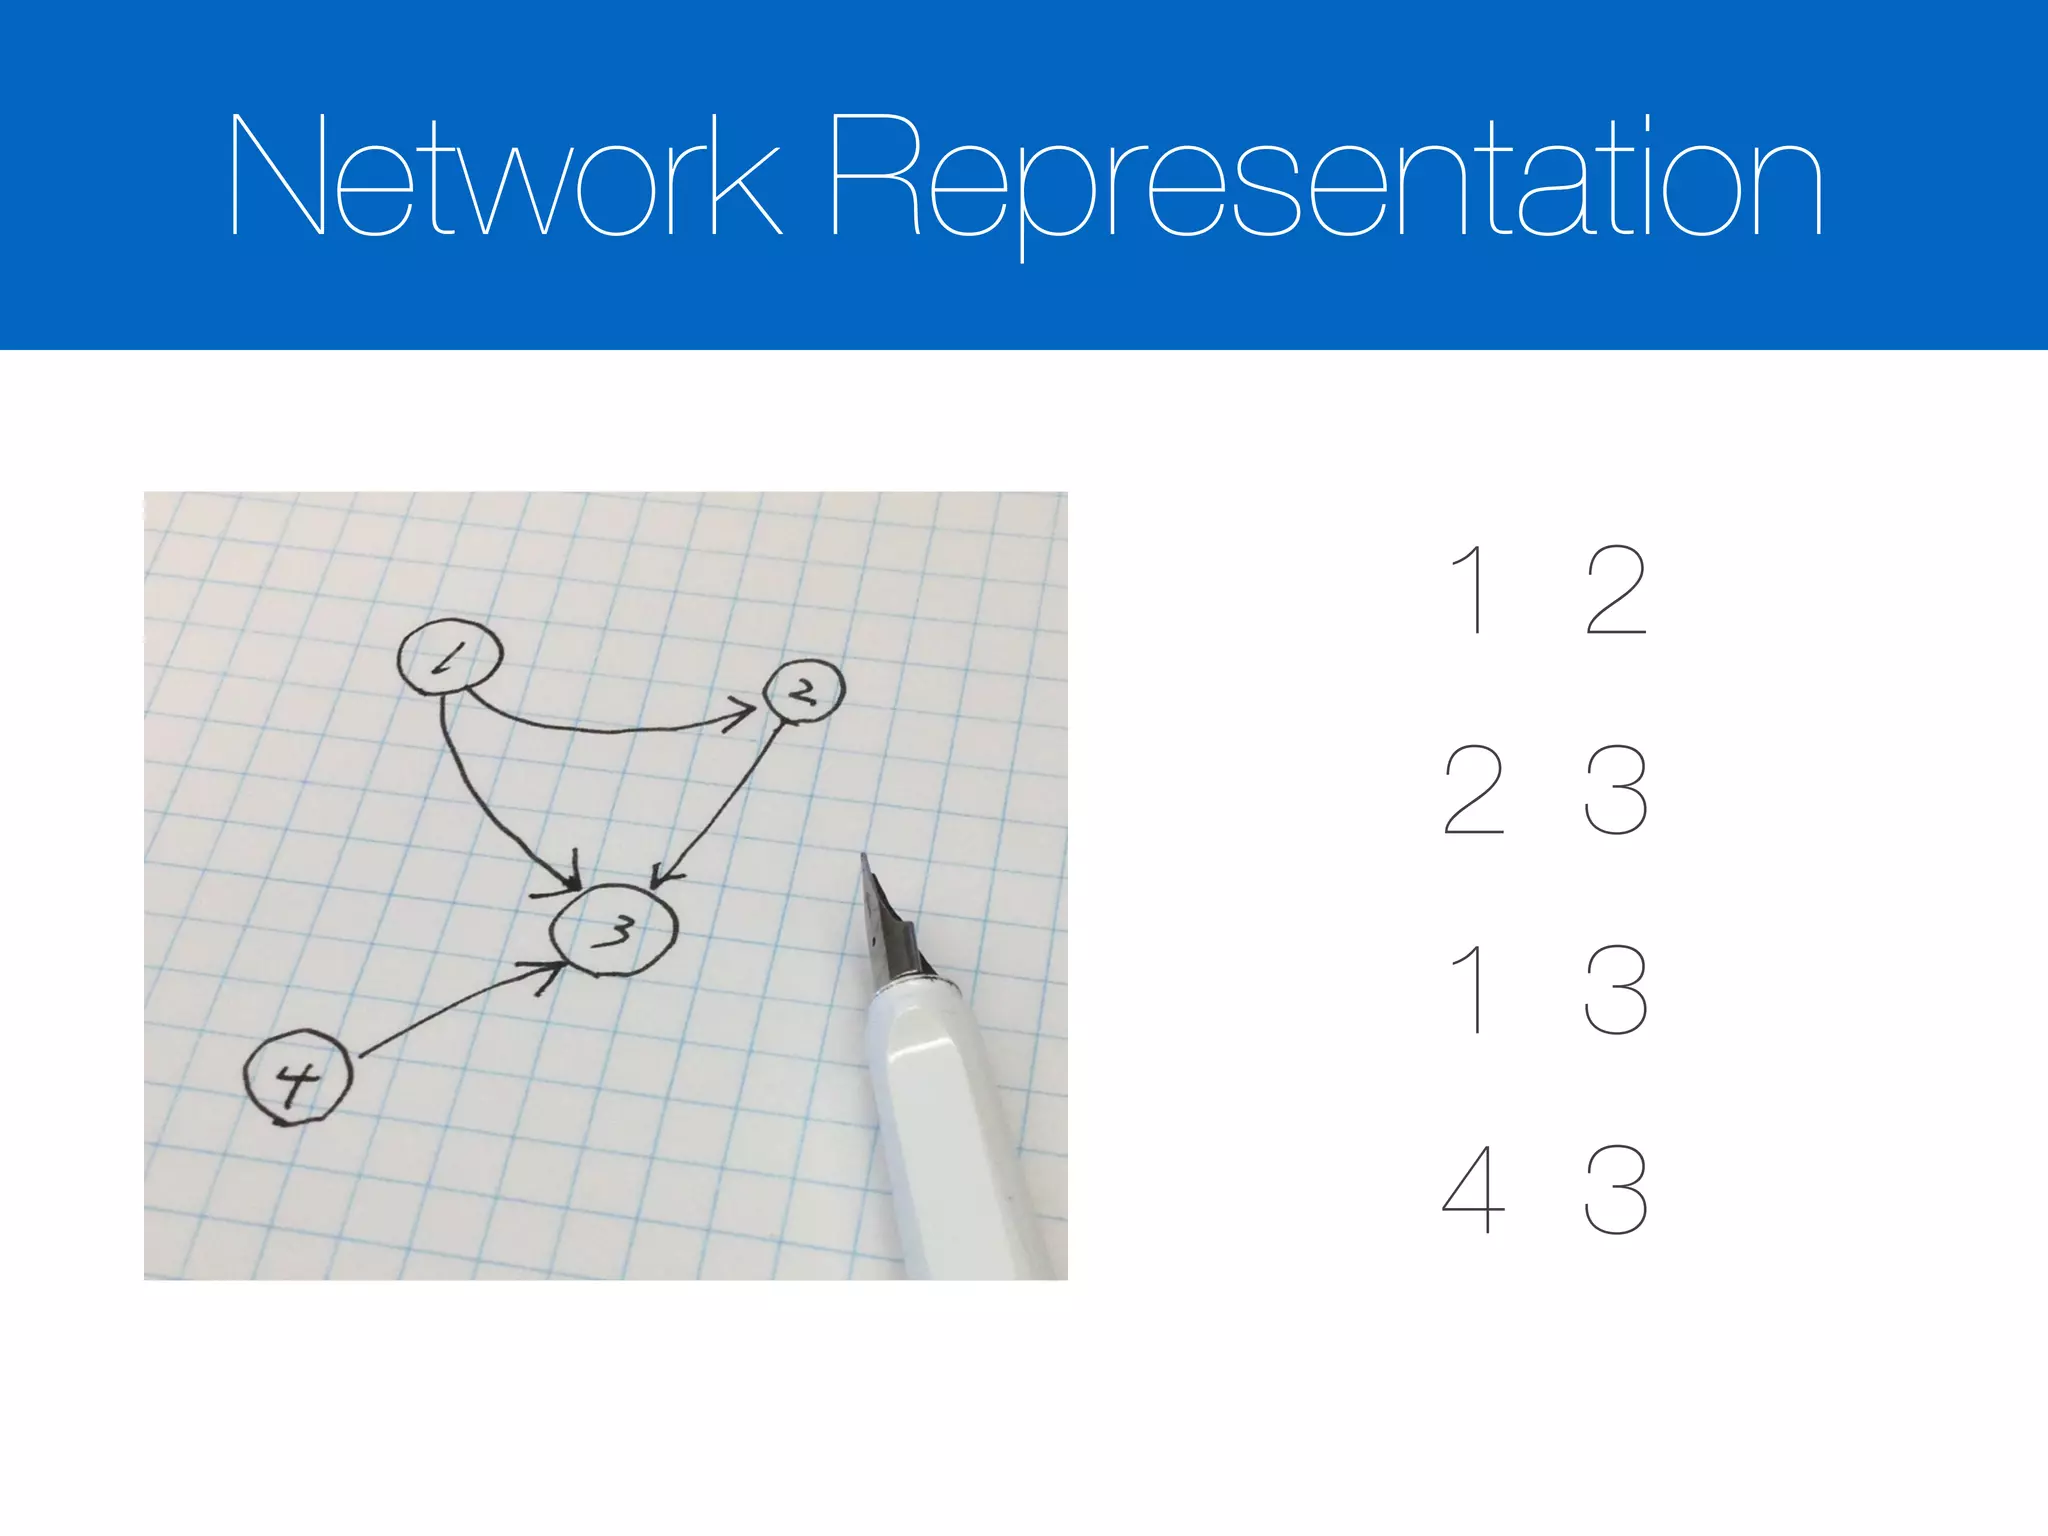
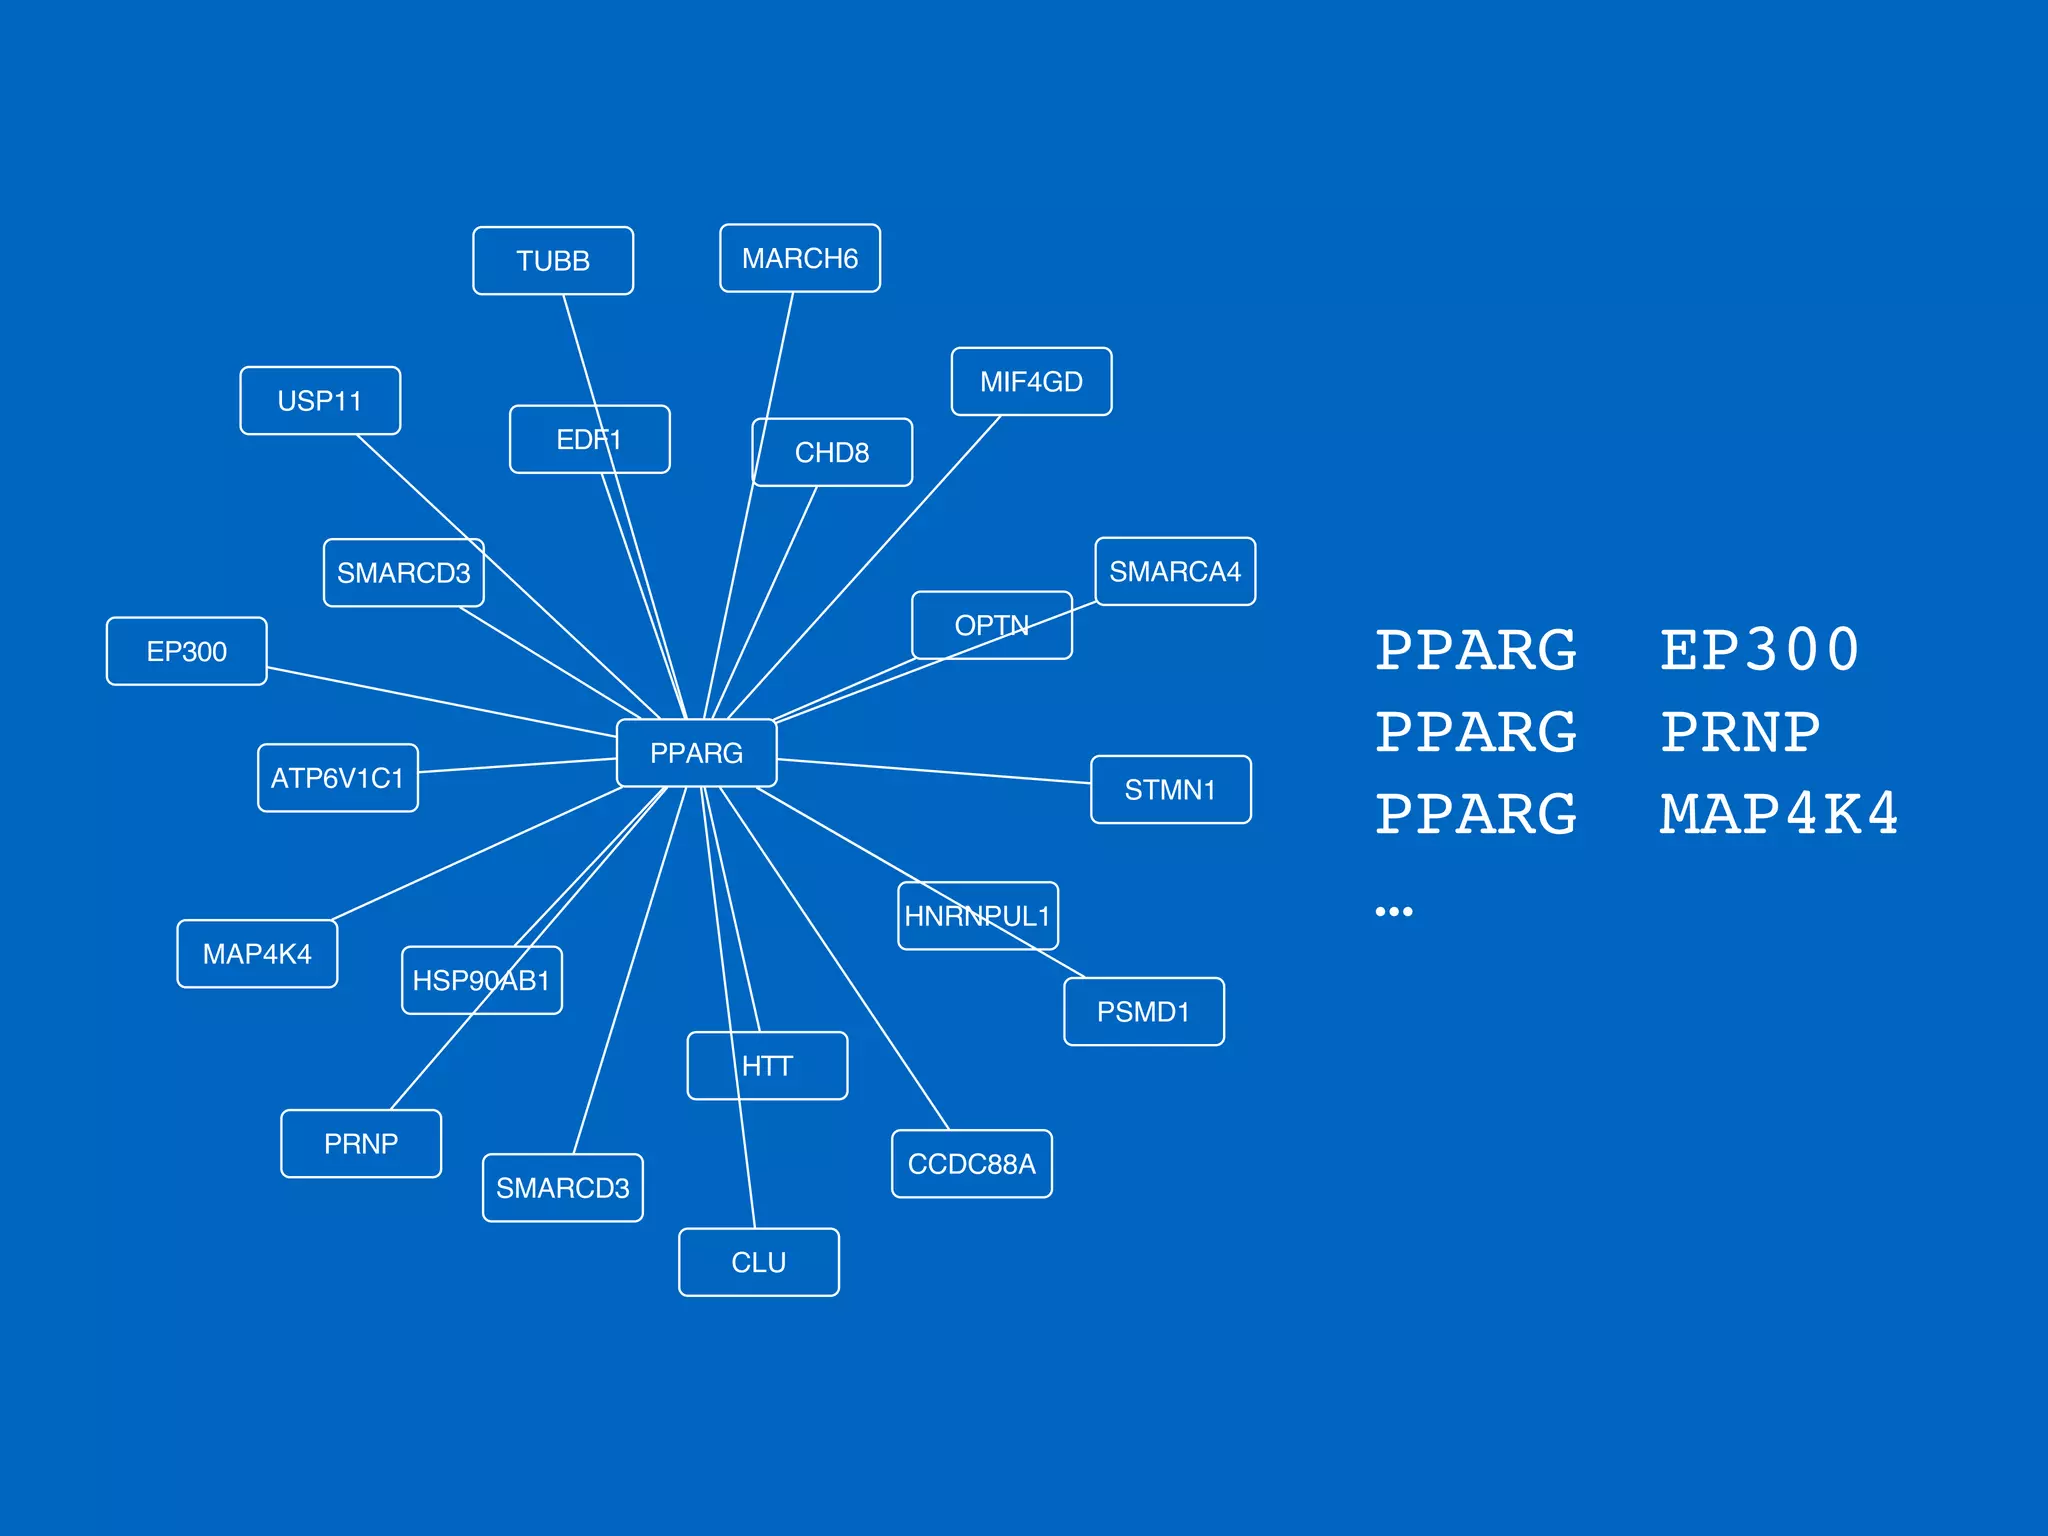
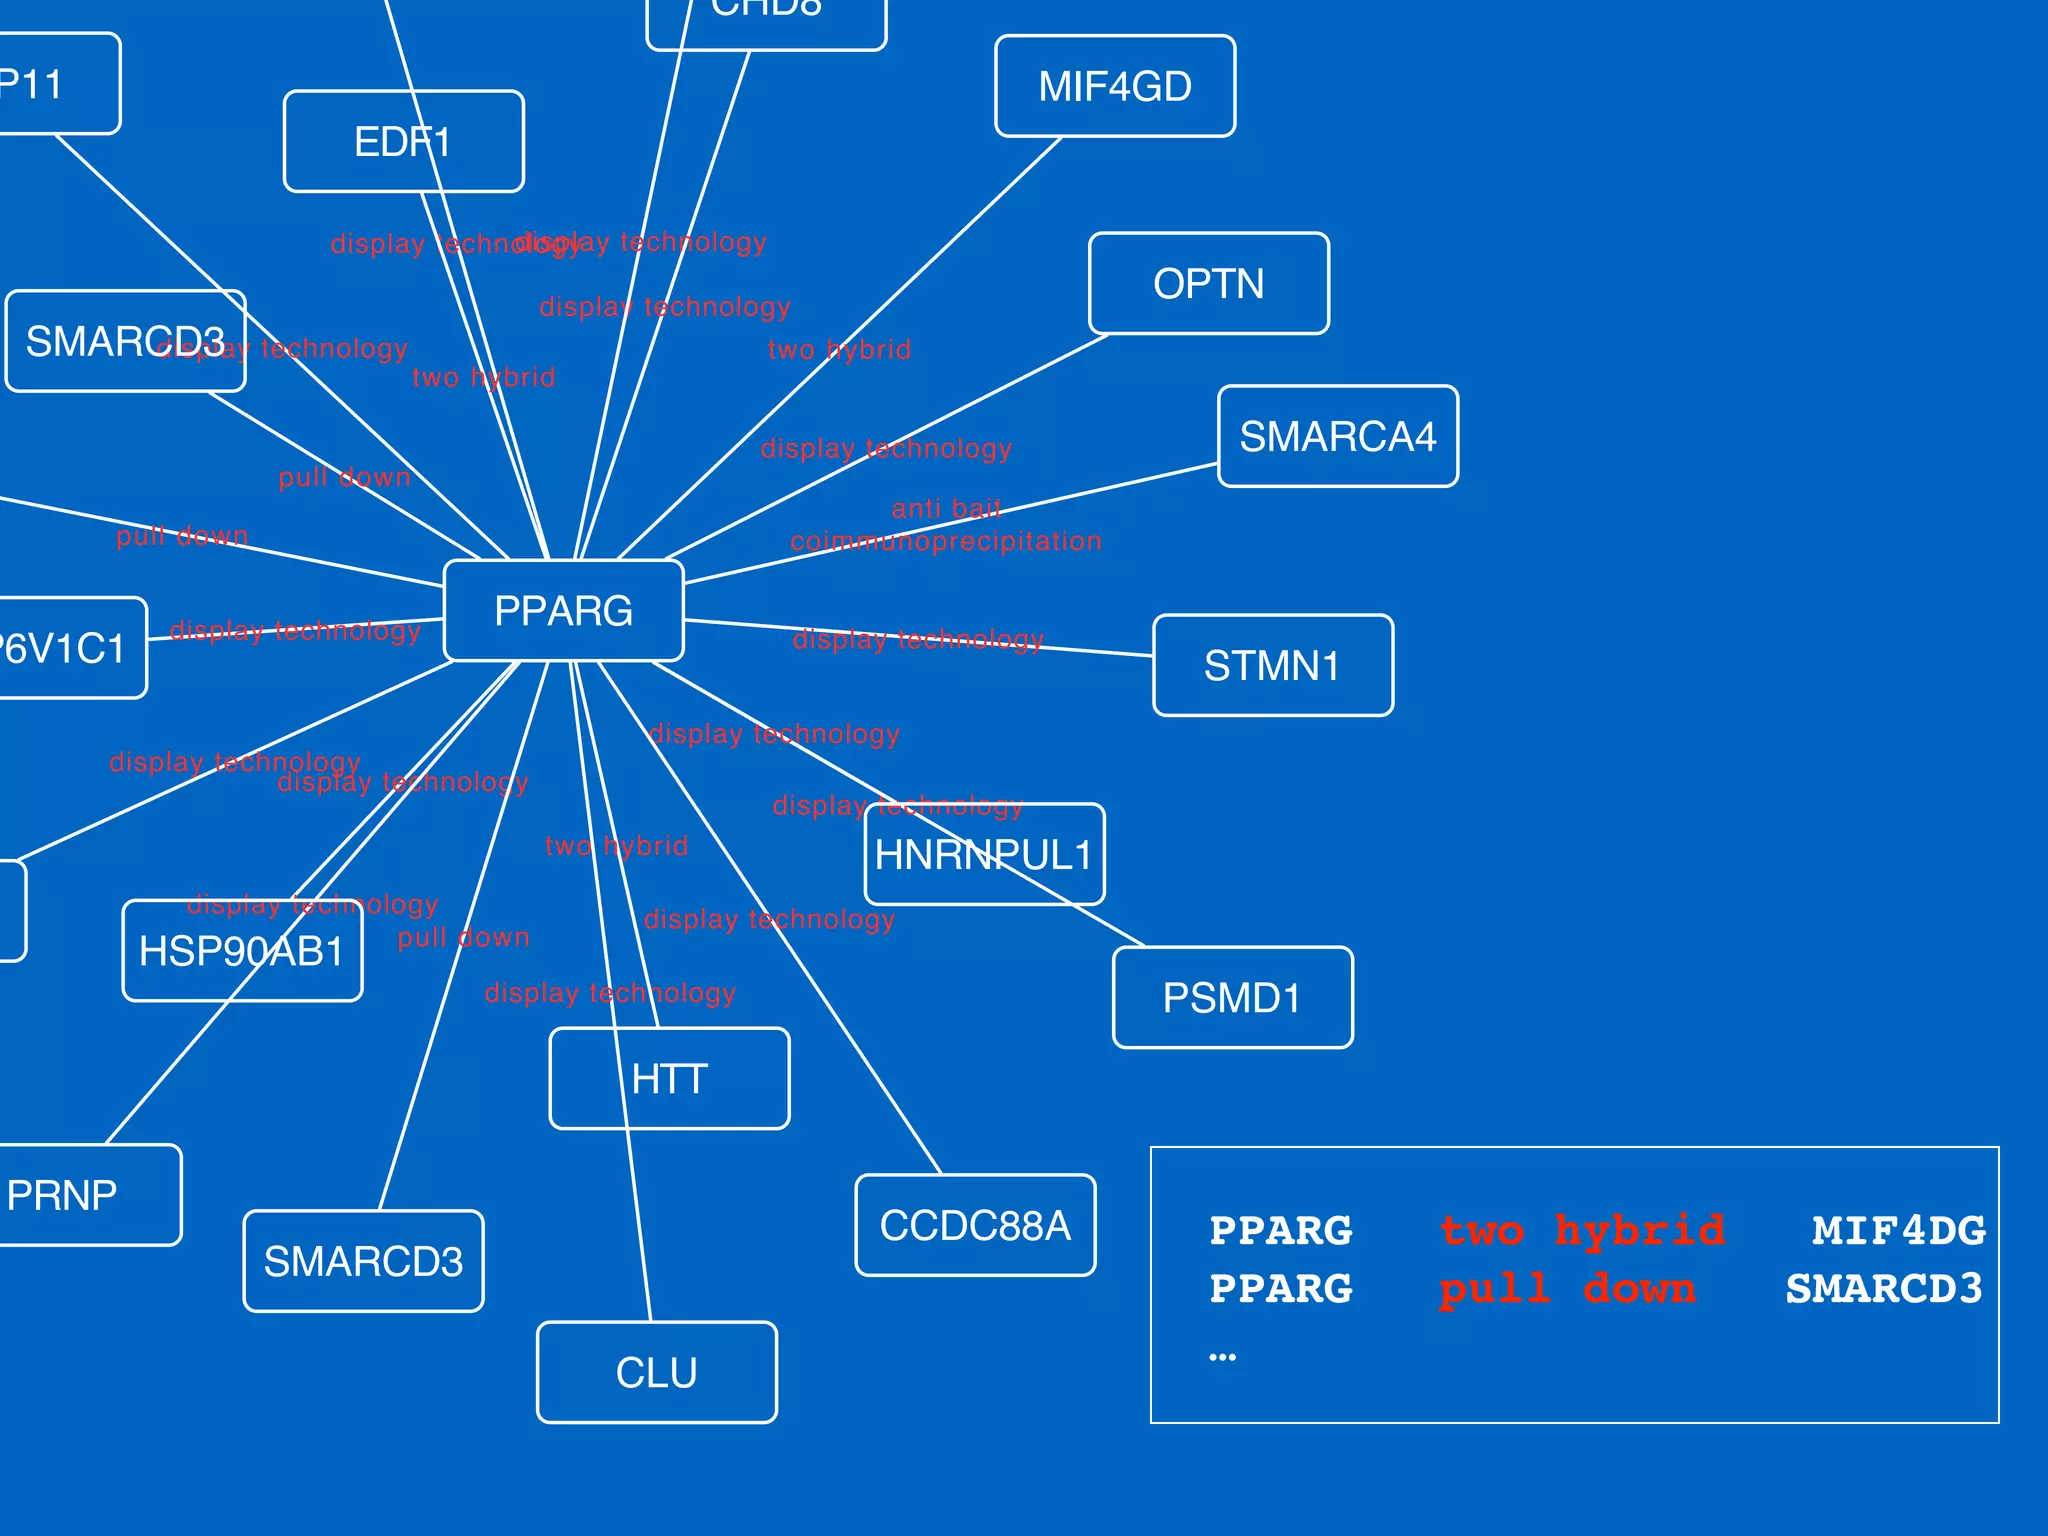
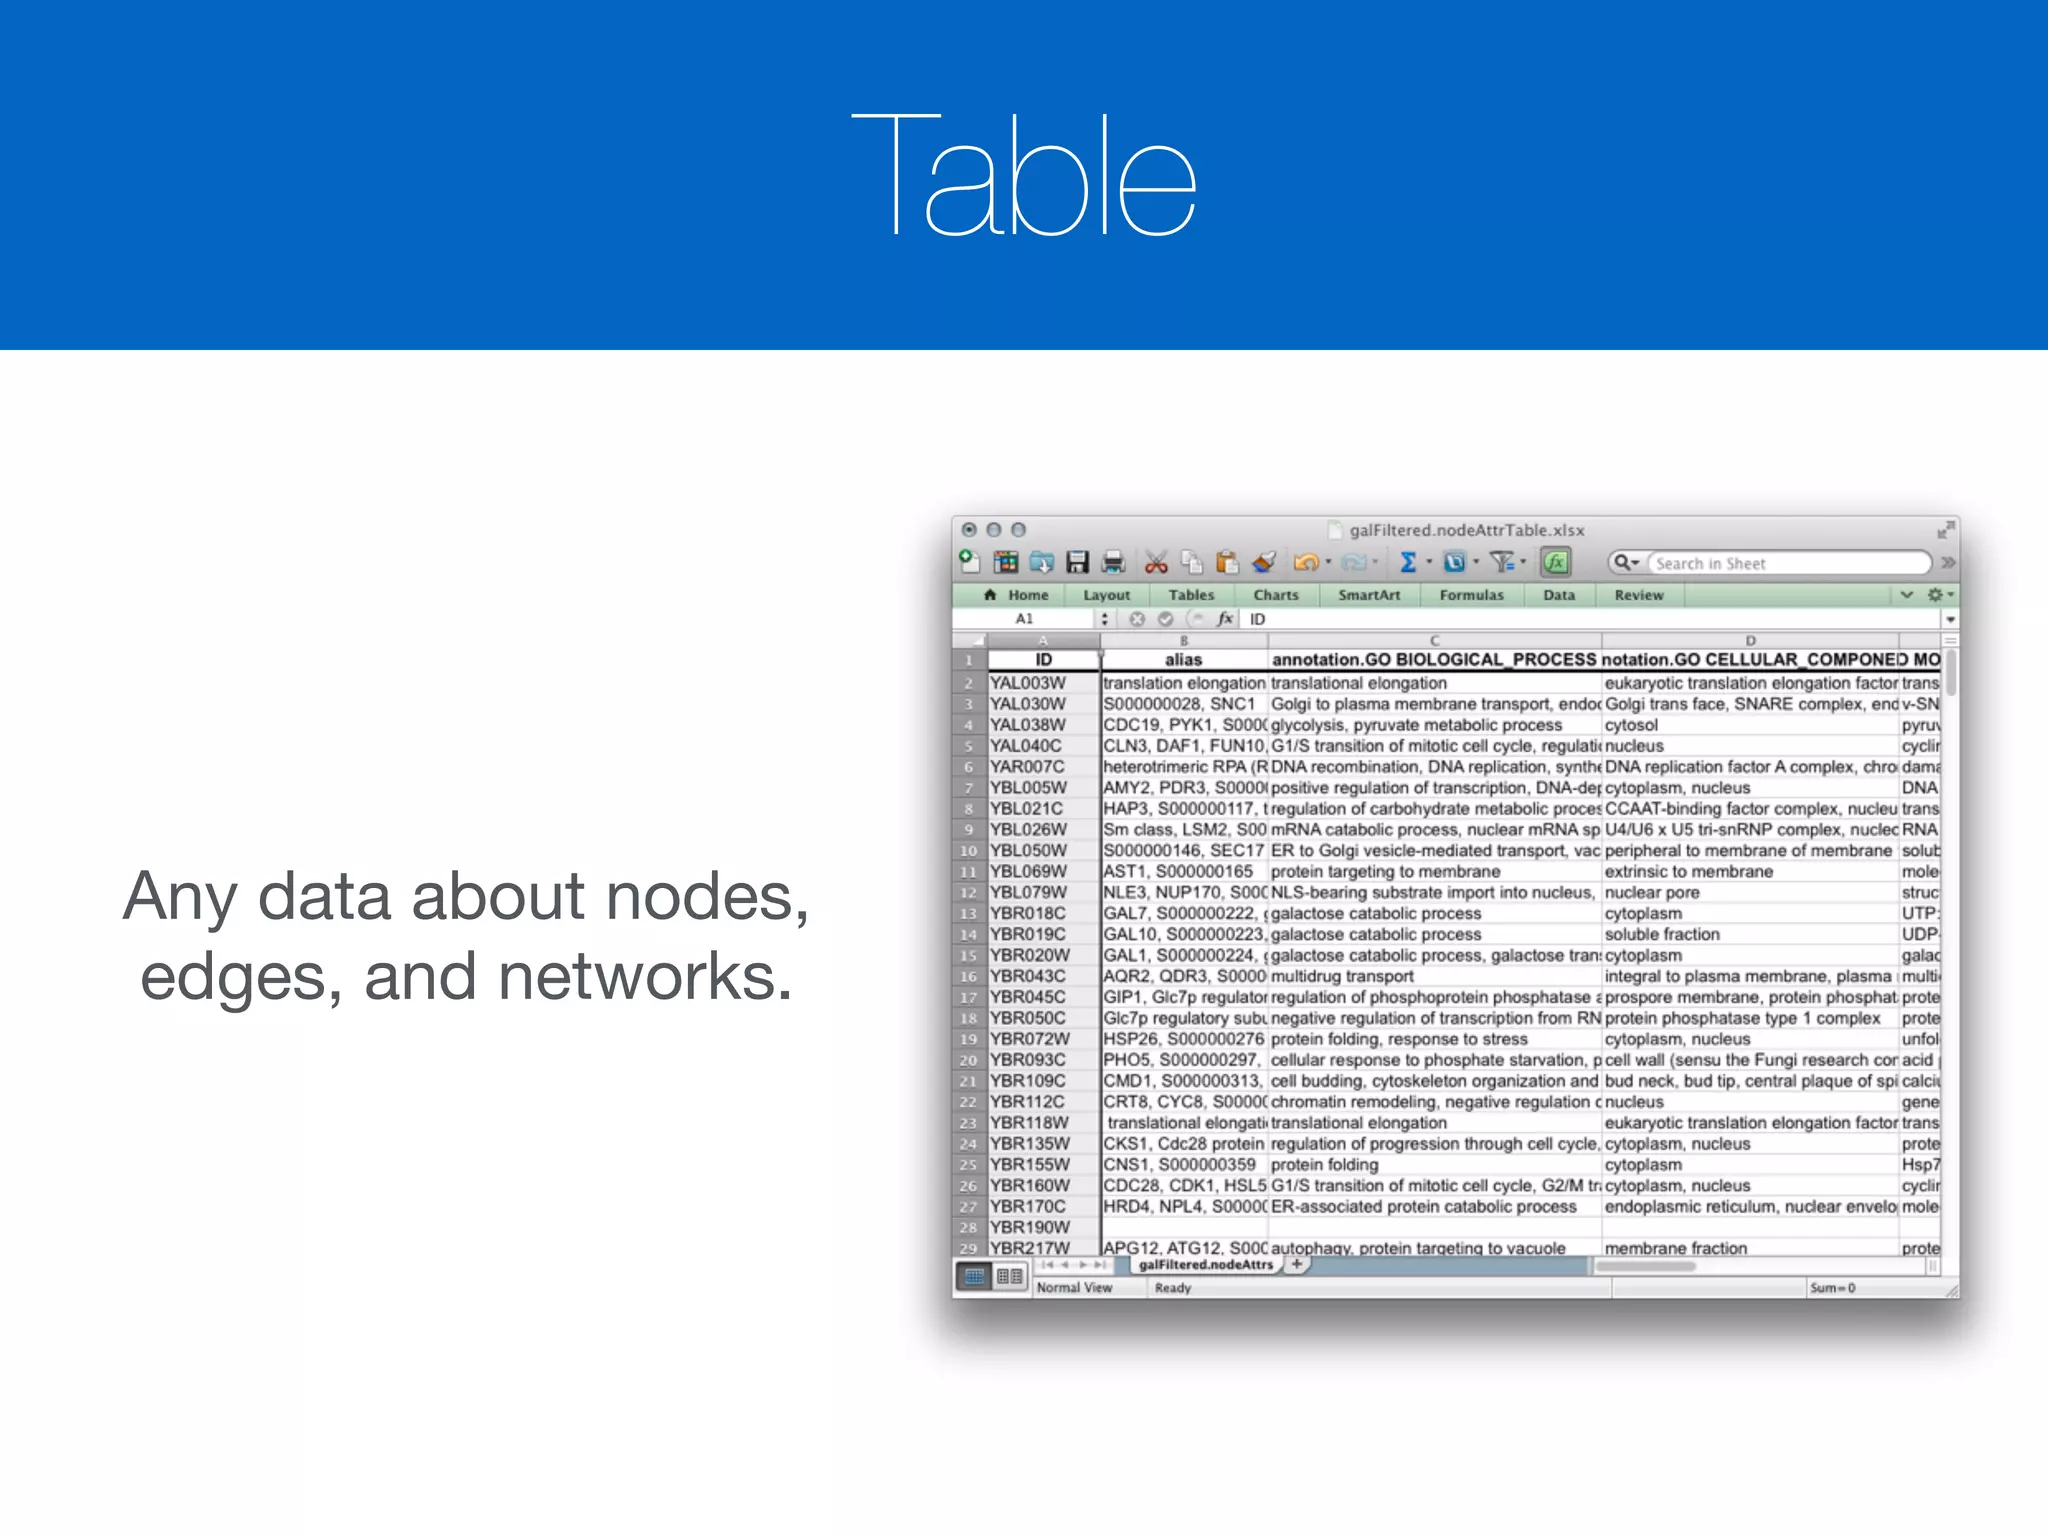
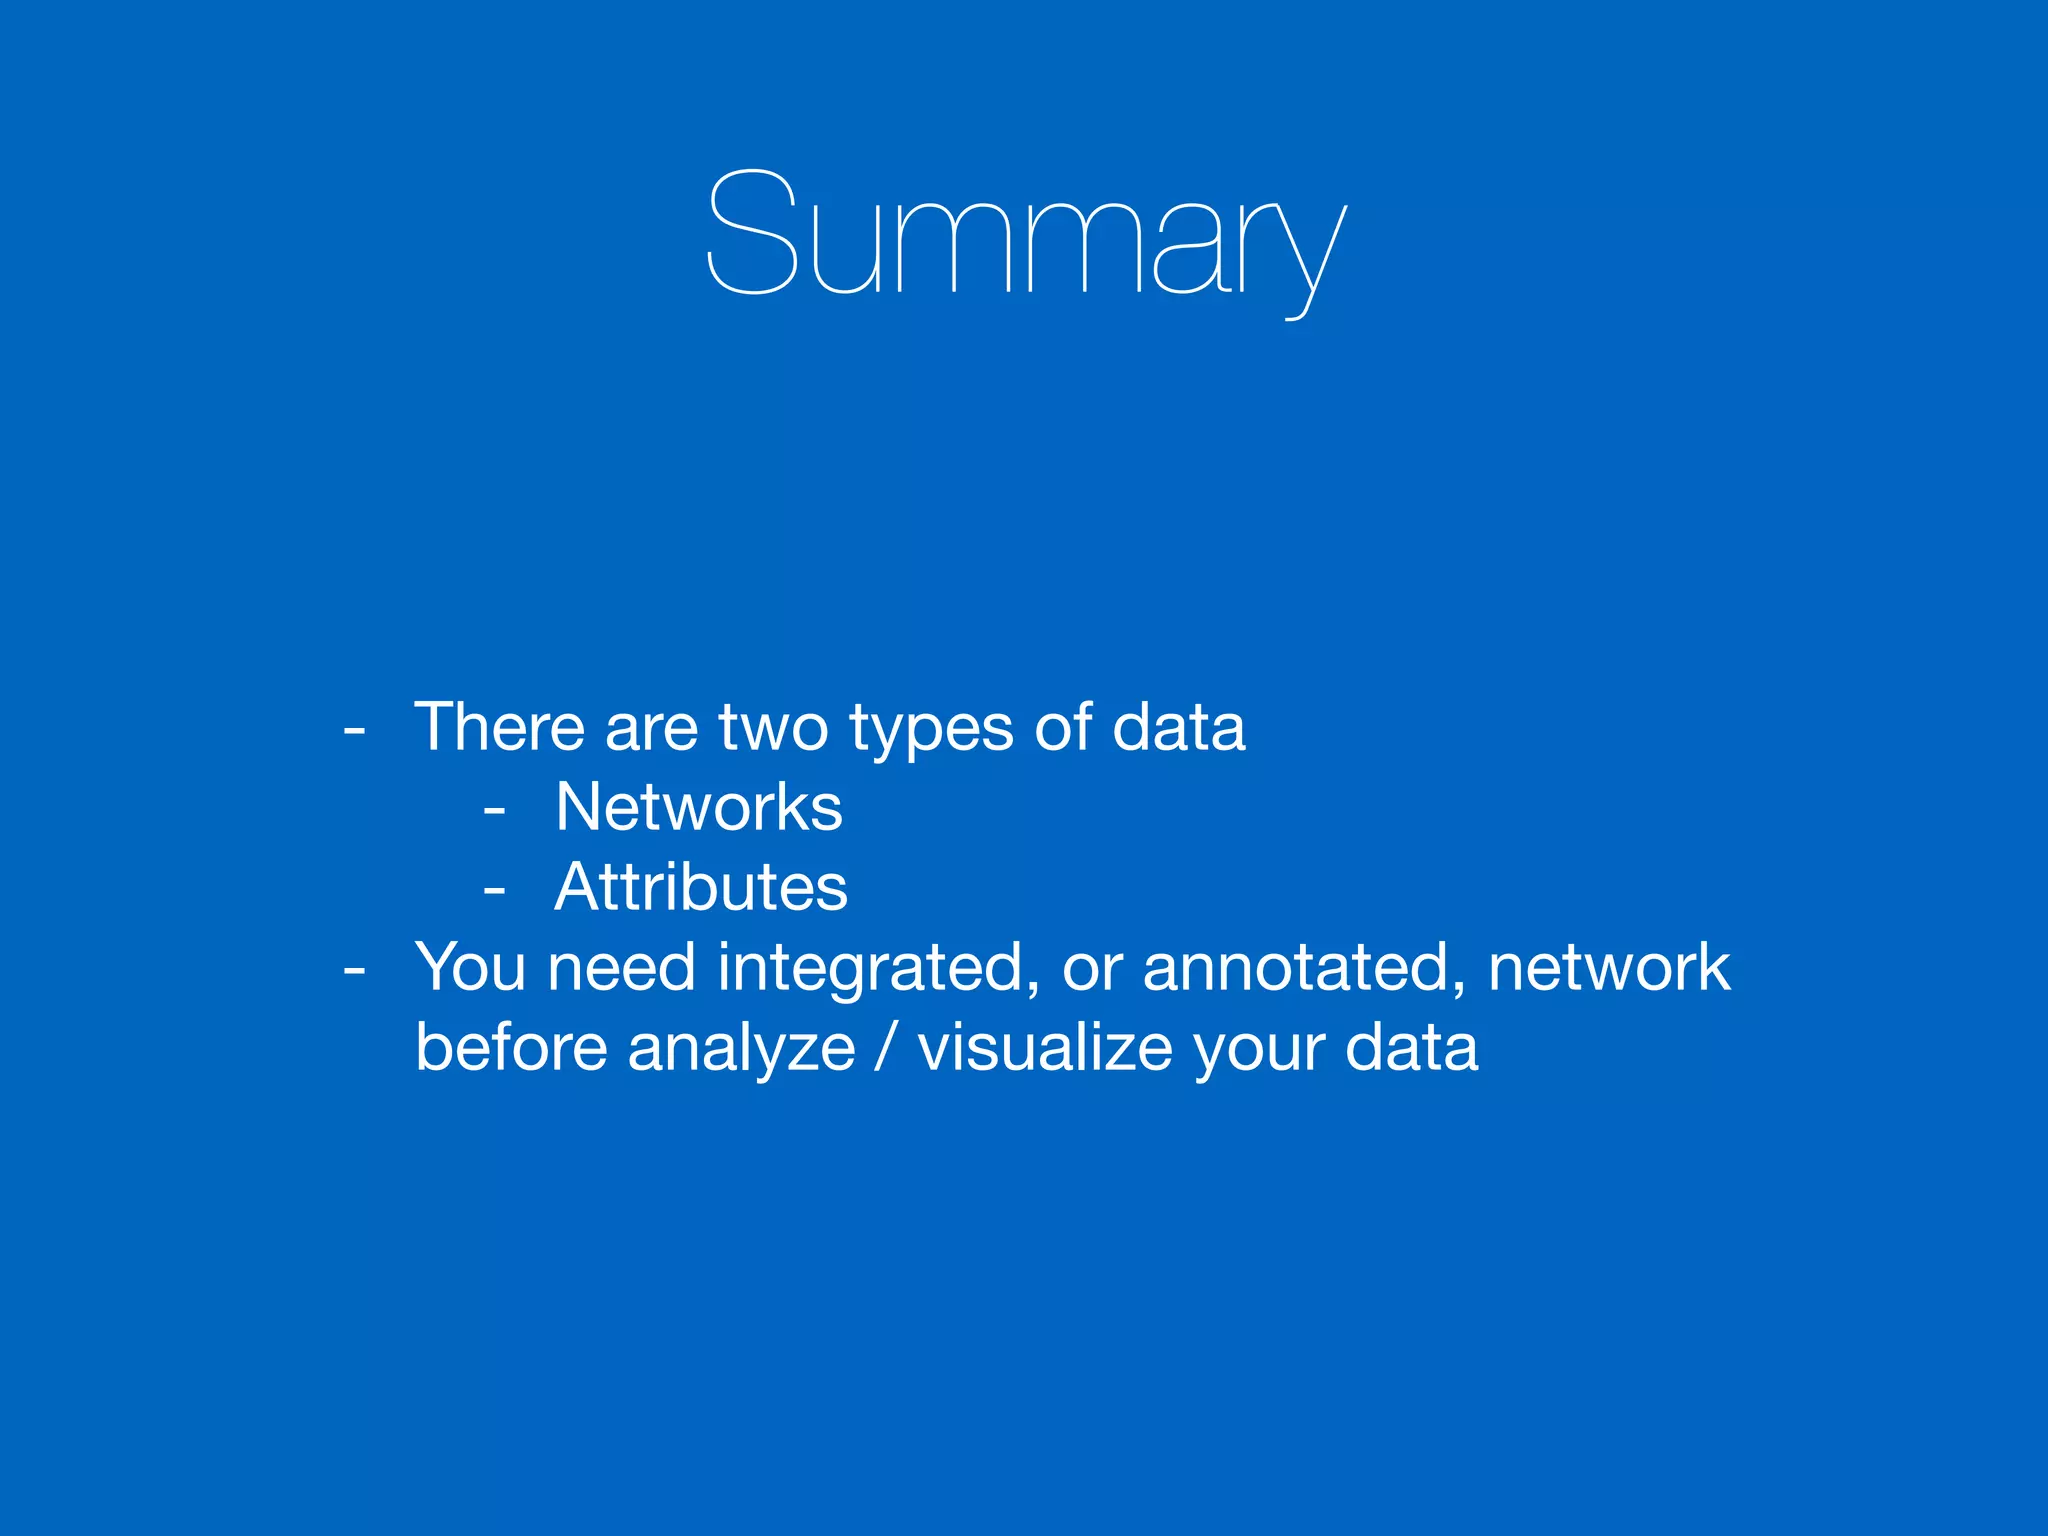
Discusses basic concepts and core features of Cytoscape, including network data browsing, visualization, and data integration.
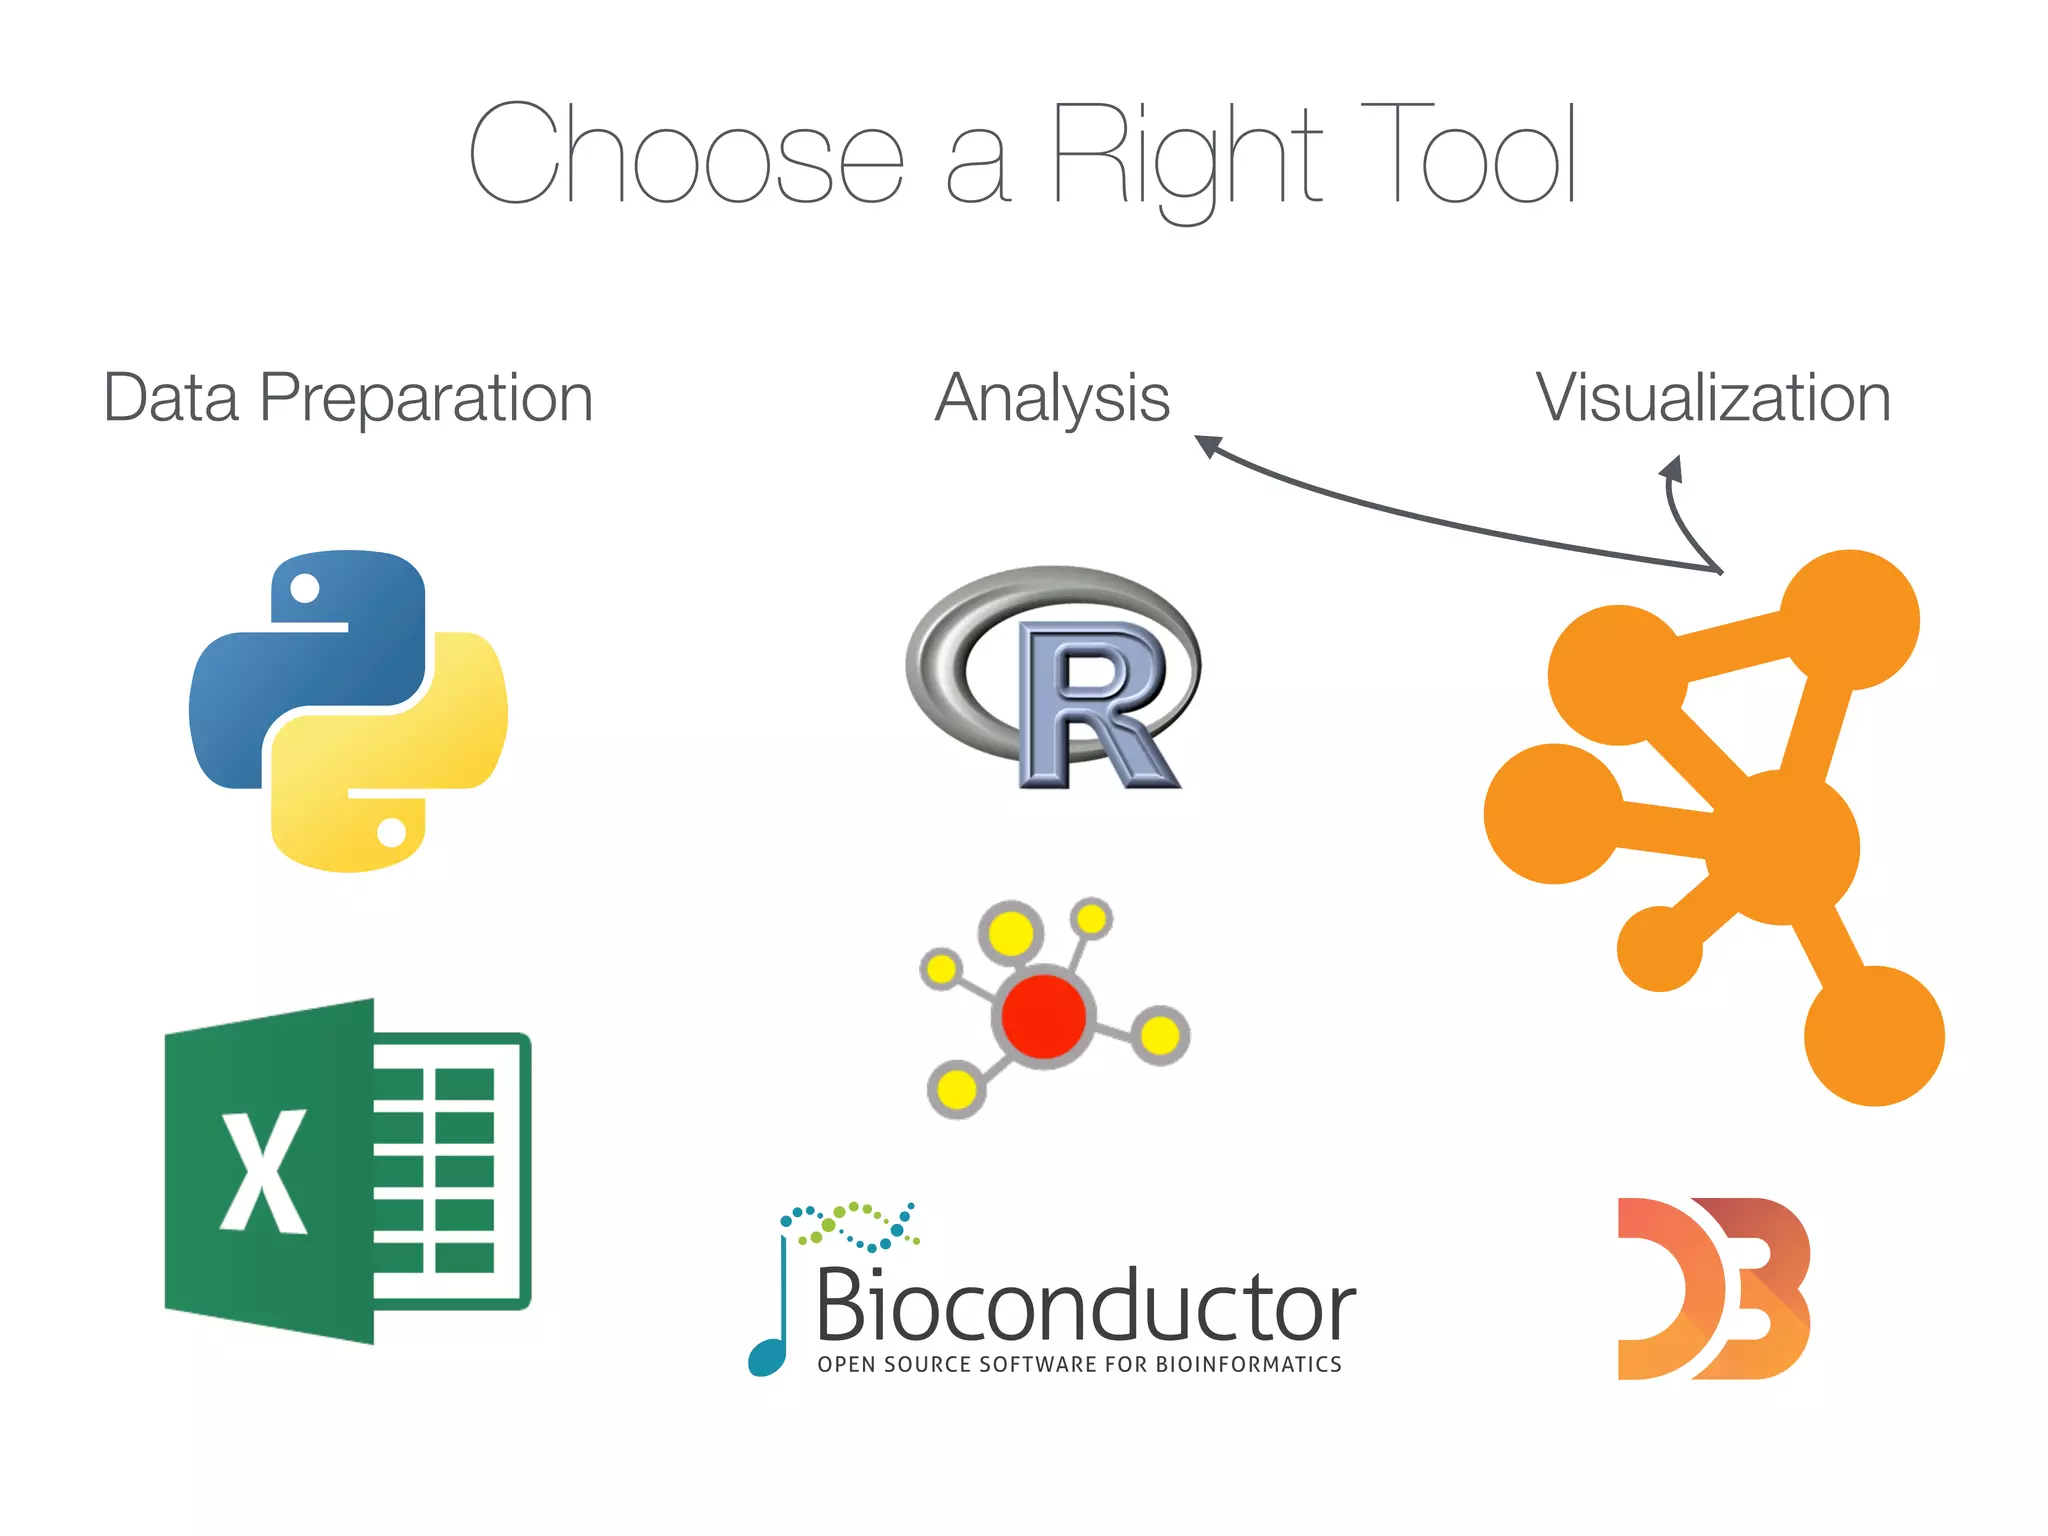
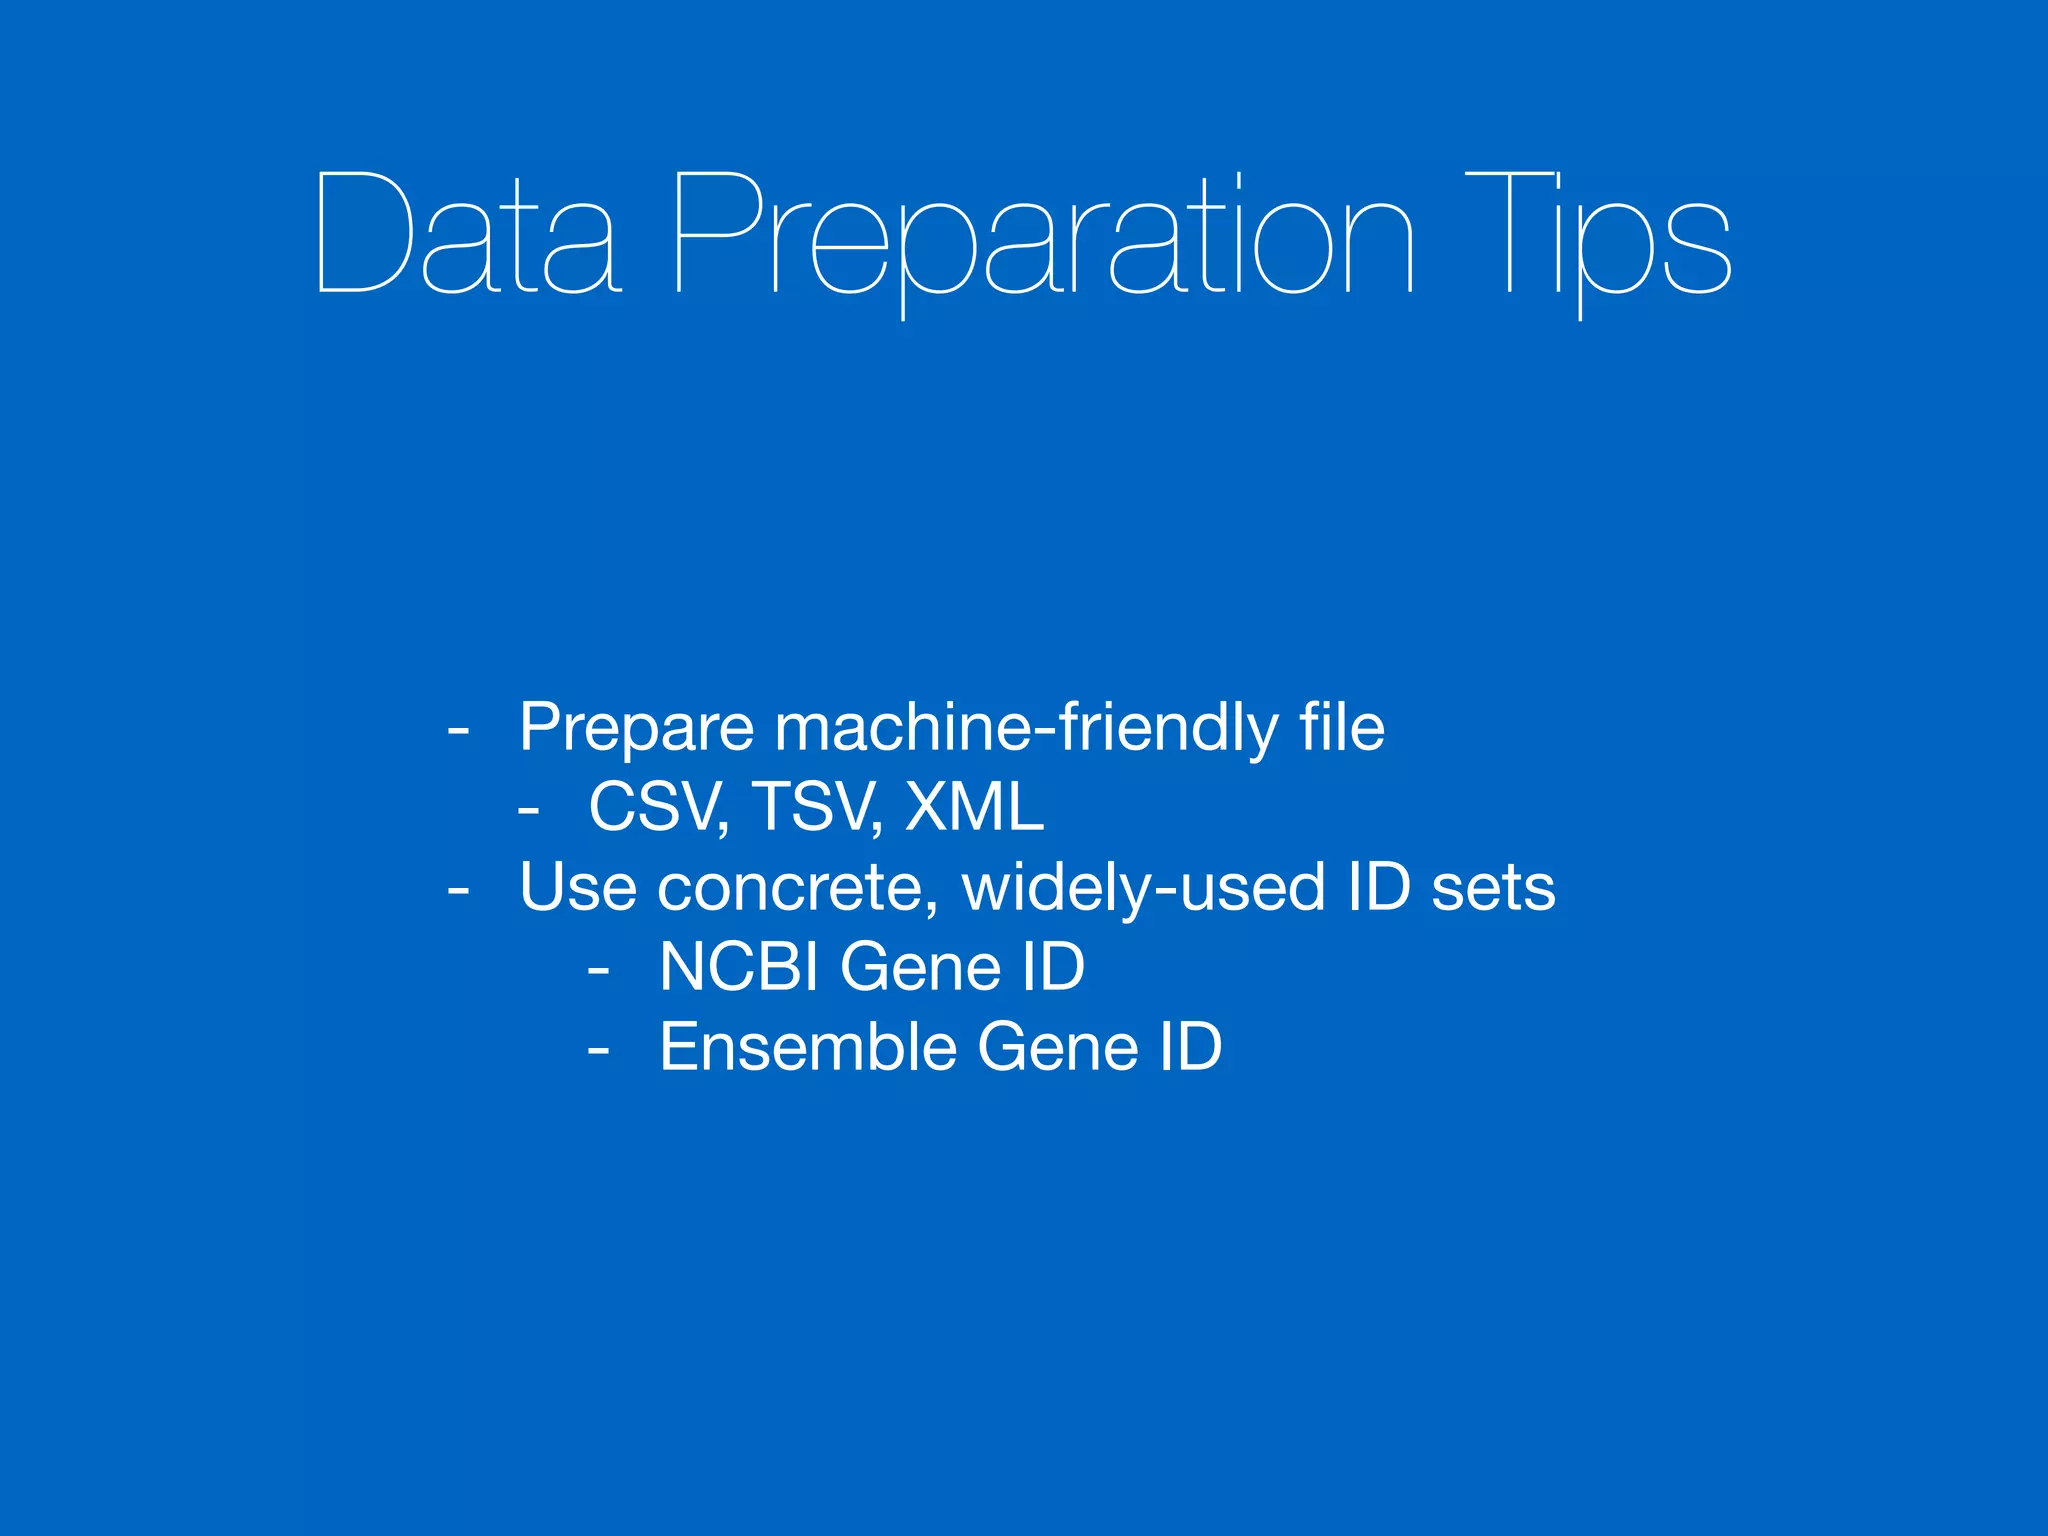
Tips on preparing data for analysis in Cytoscape, focusing on file types and using concrete ID sets.
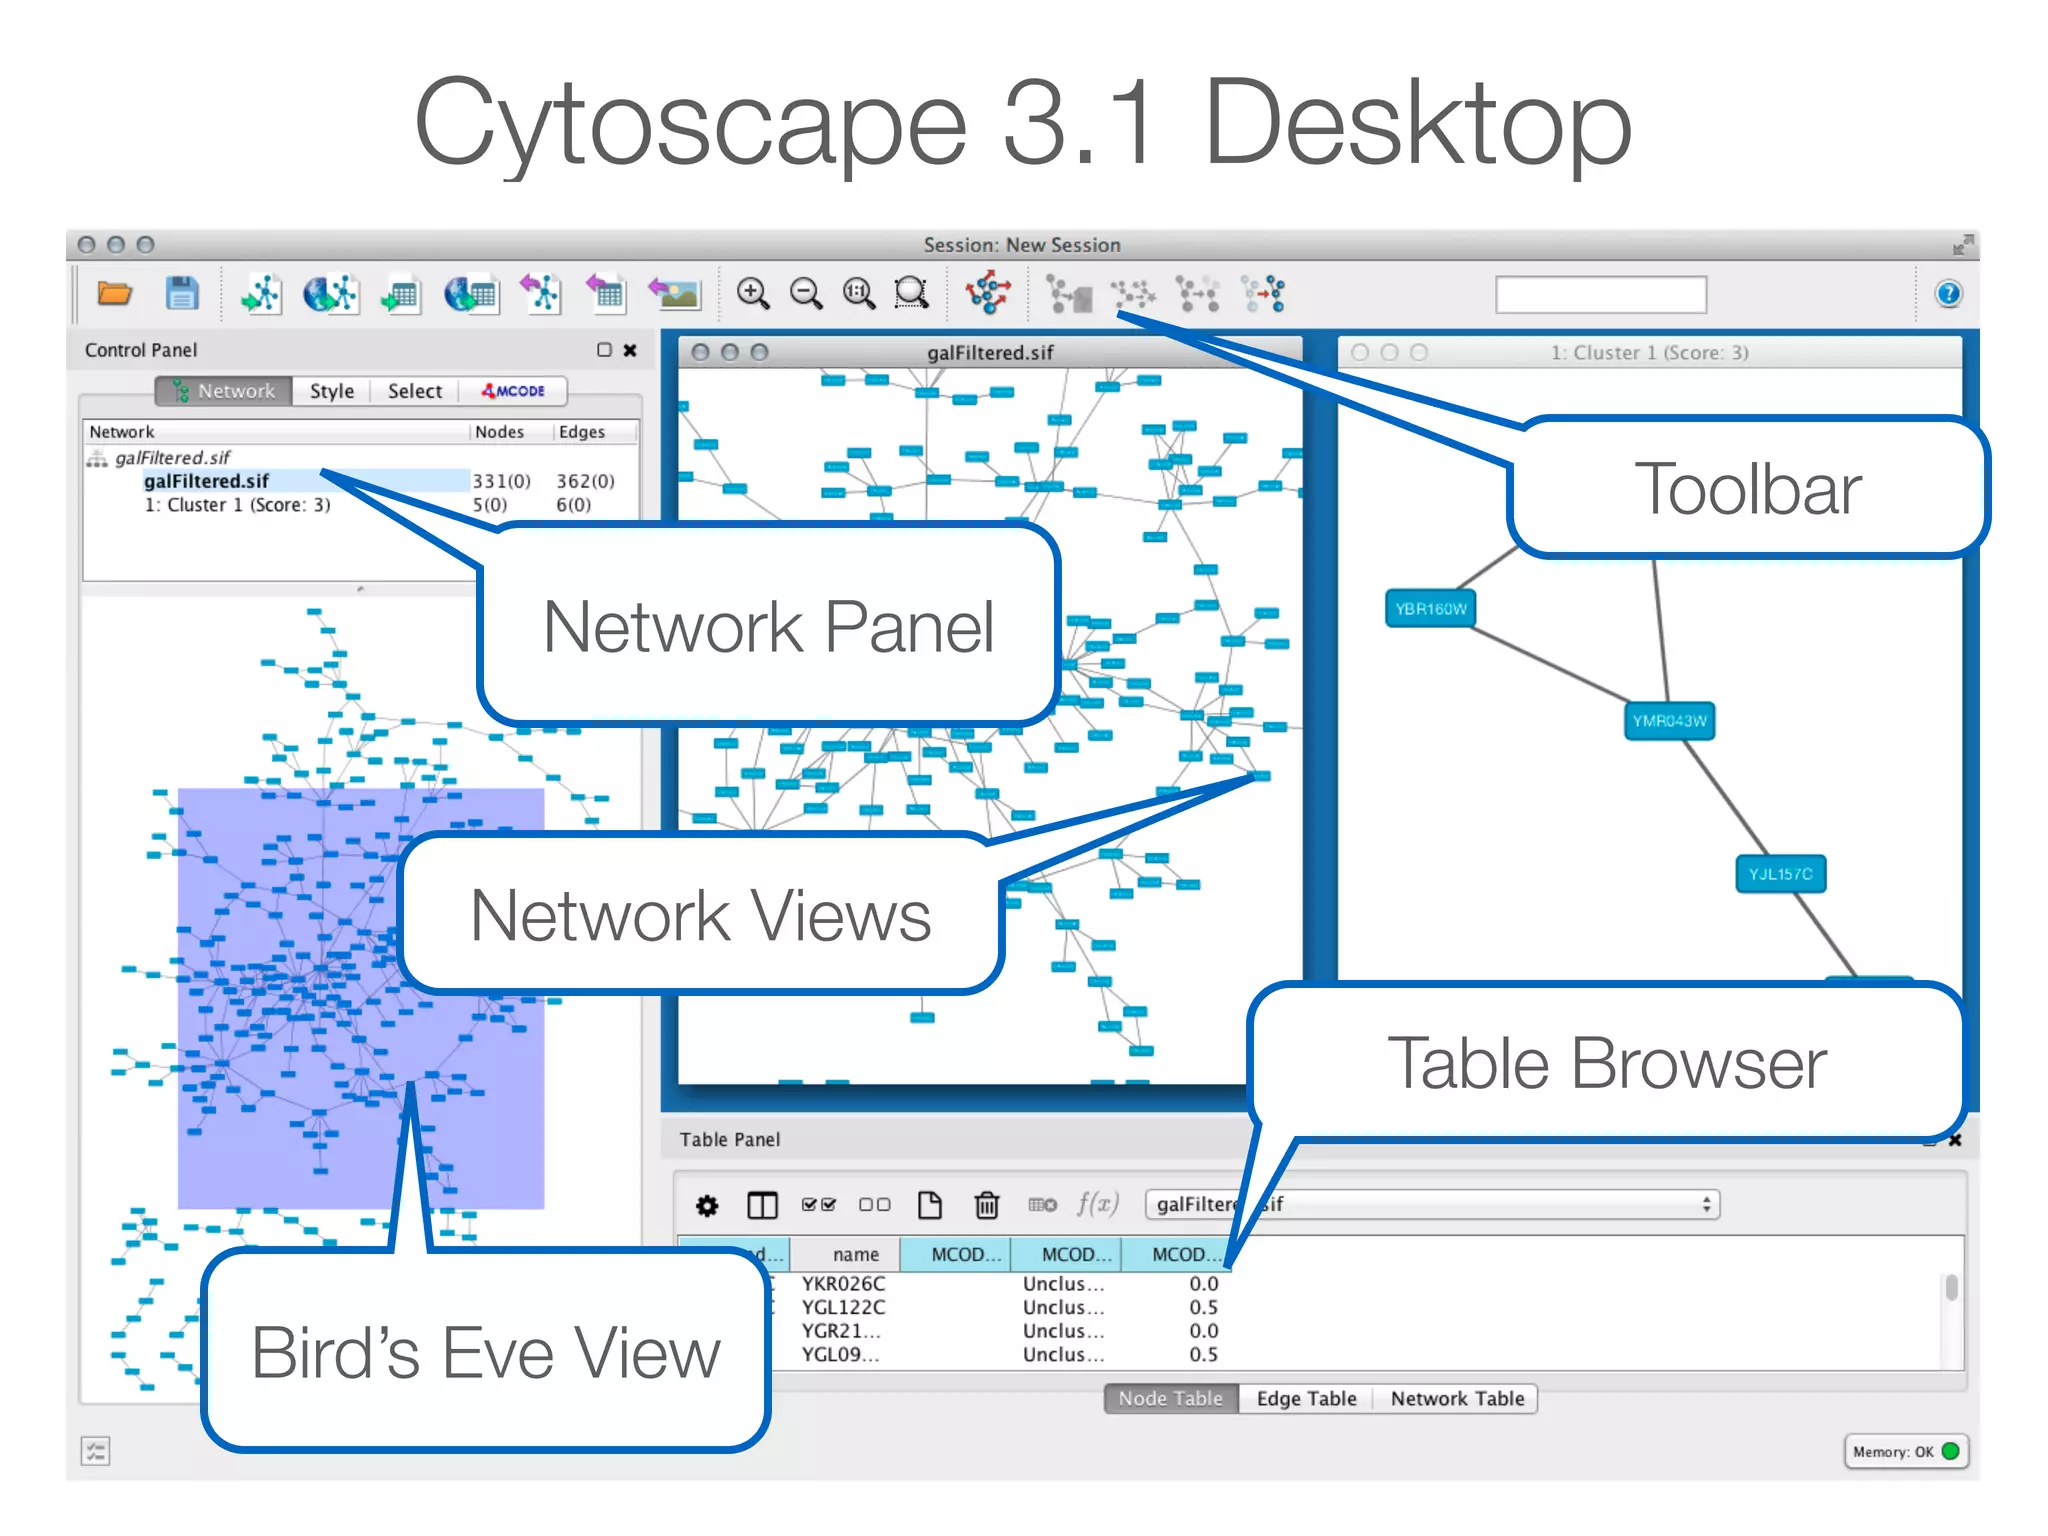
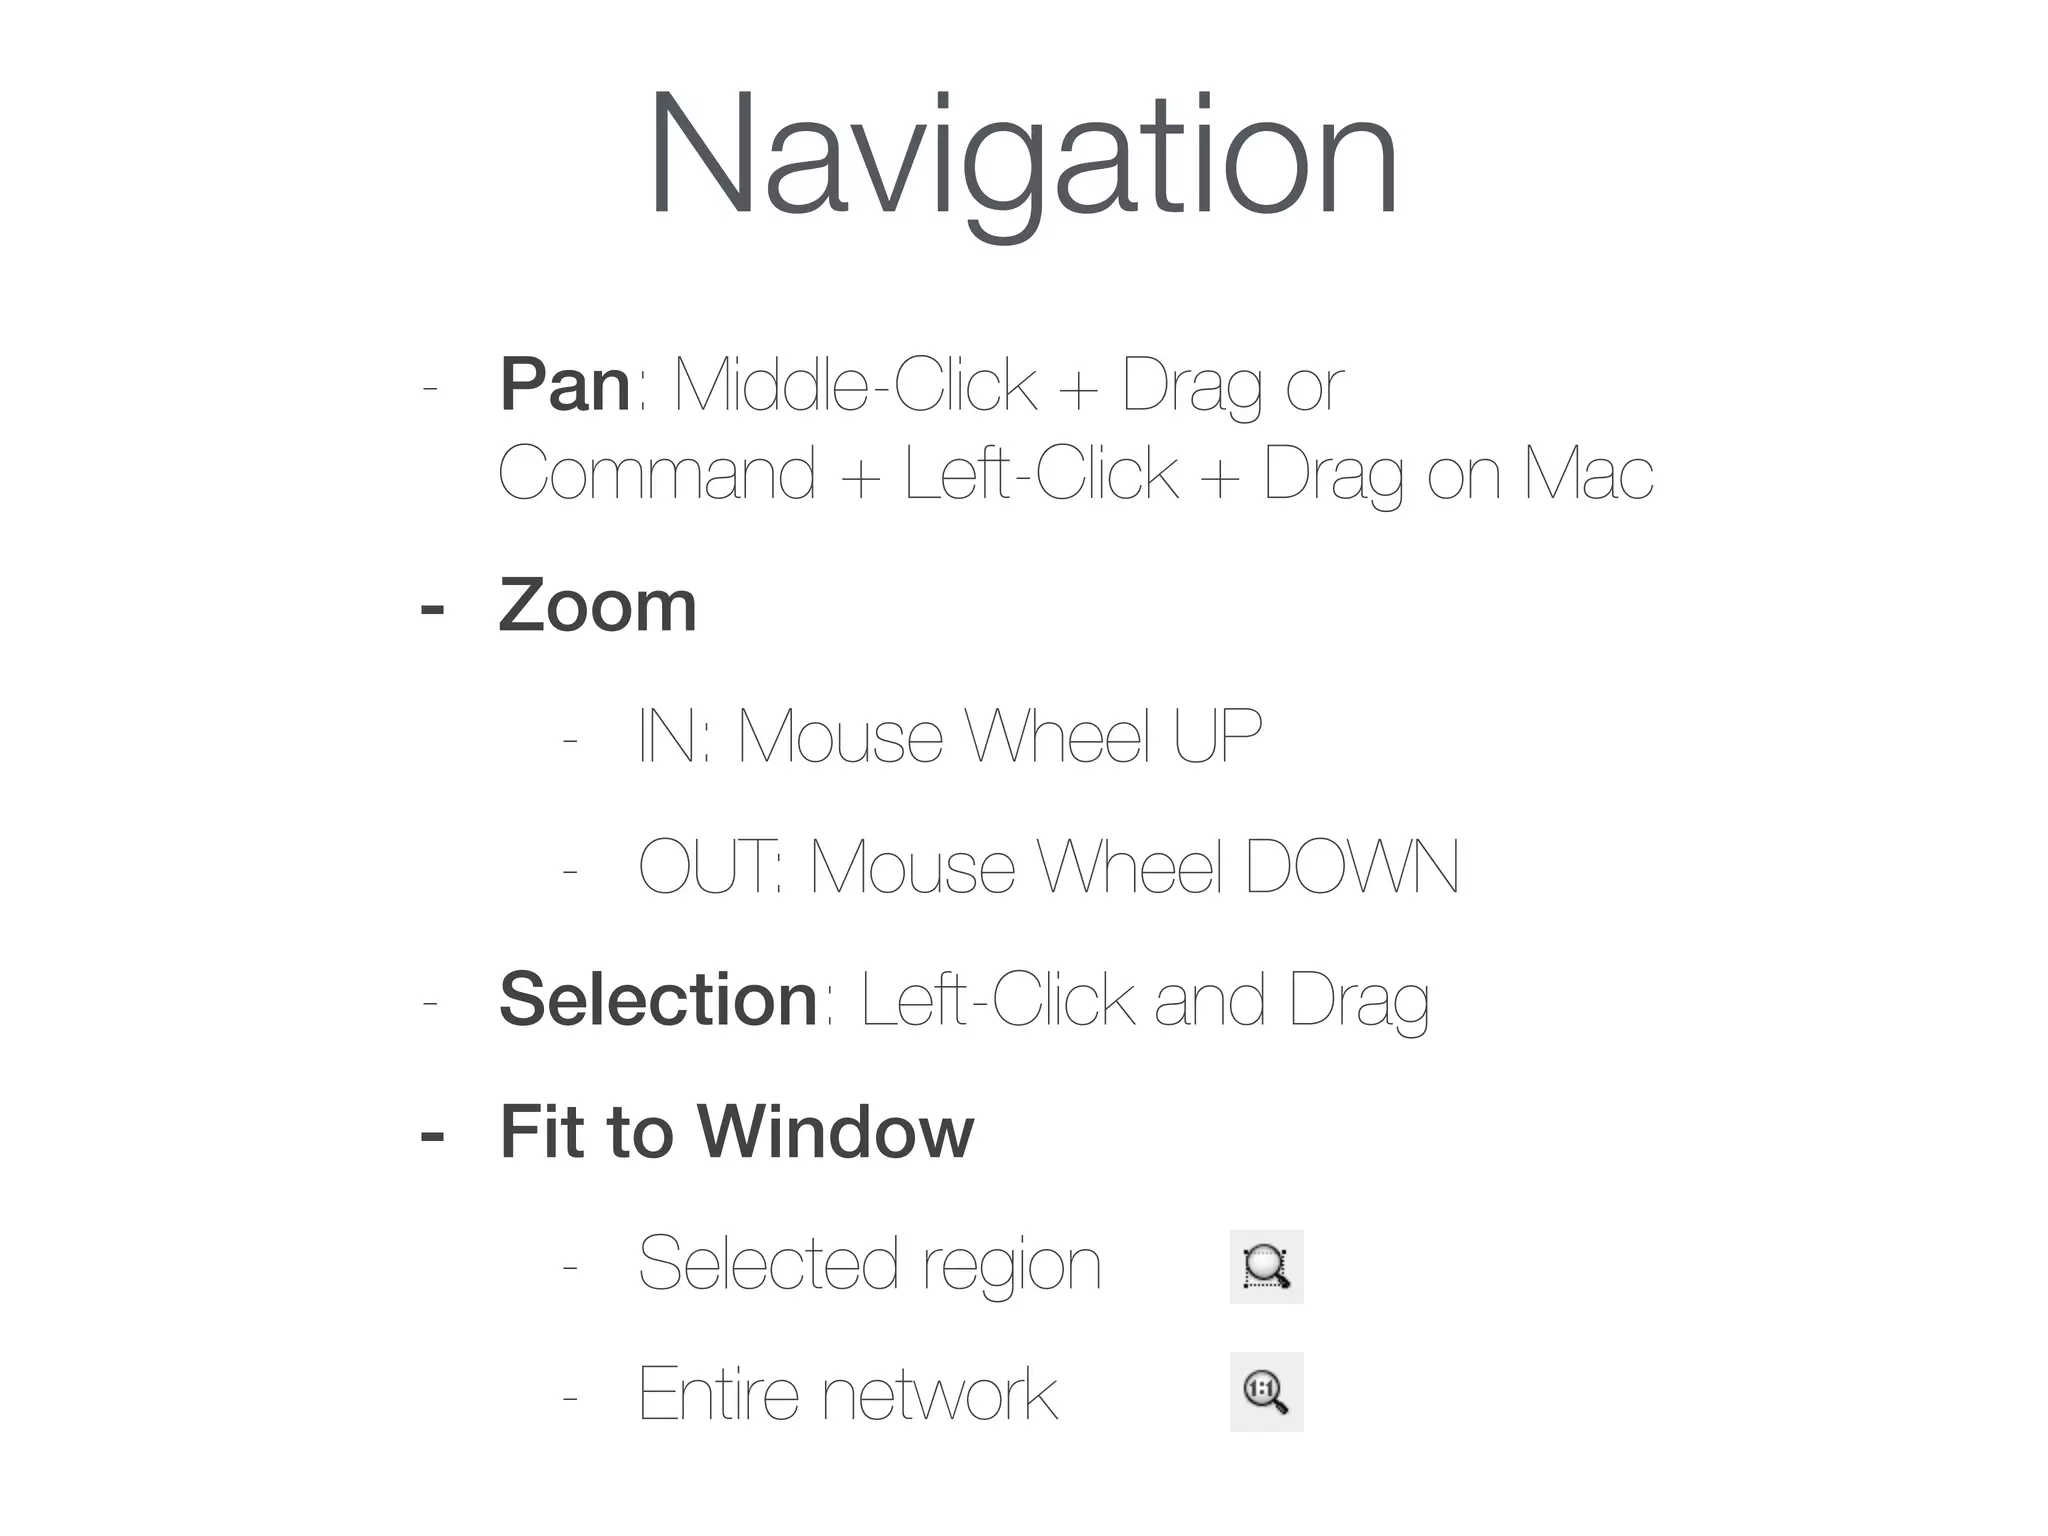
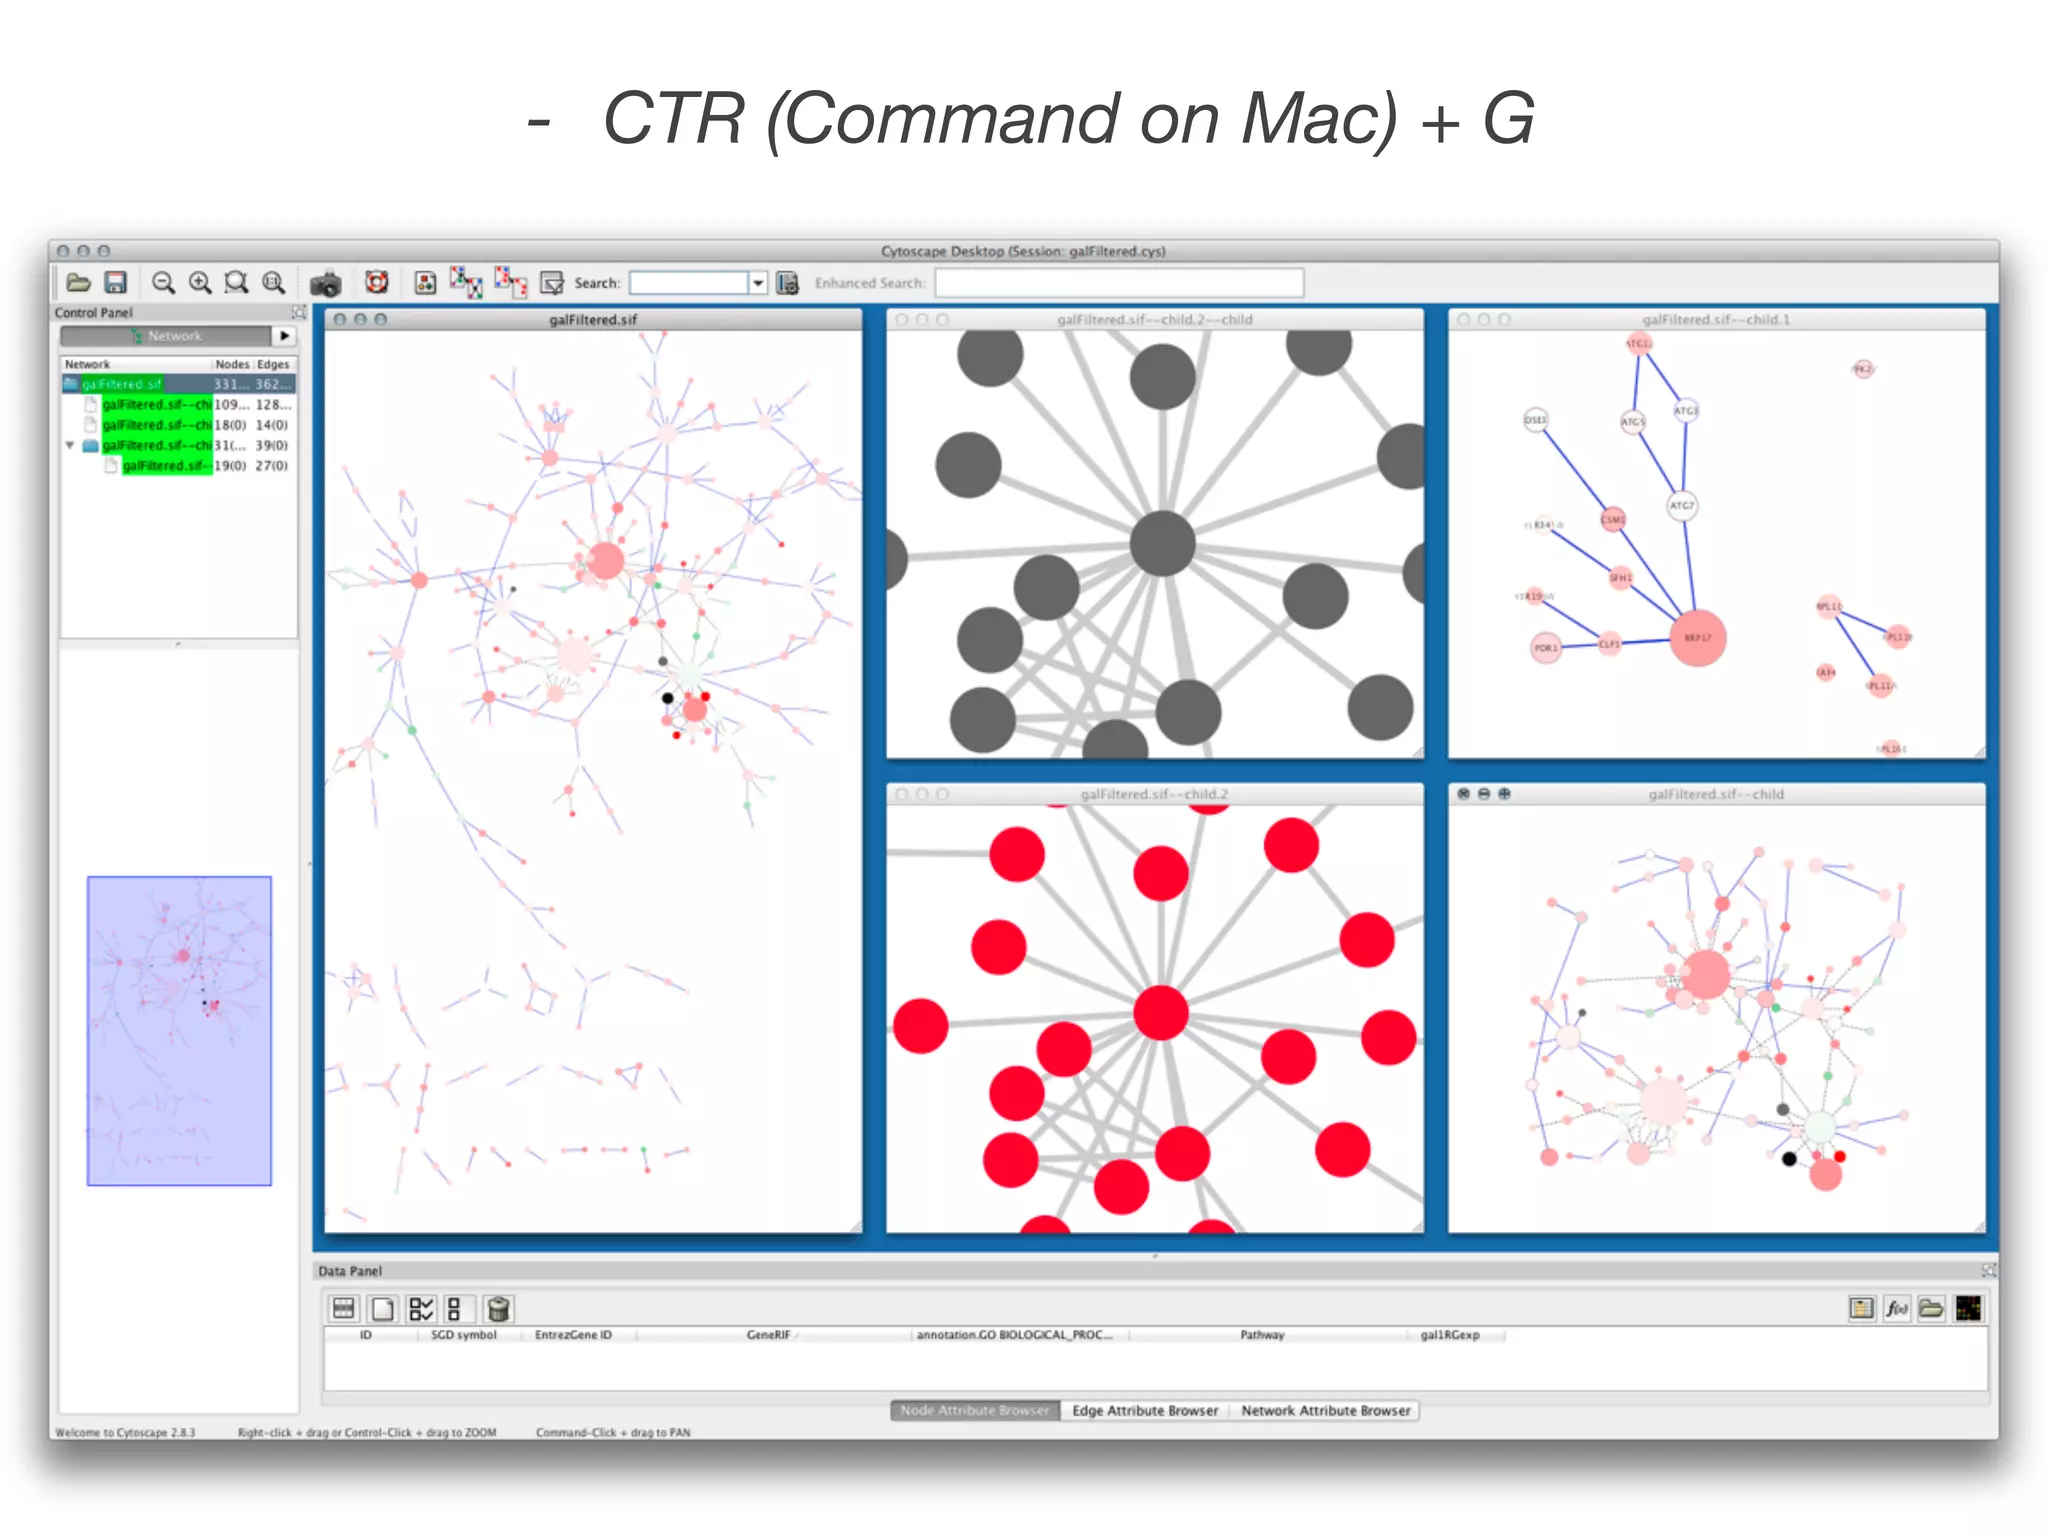
Guides on navigating the Cytoscape interface, including the toolbar, network panel, and table browser.
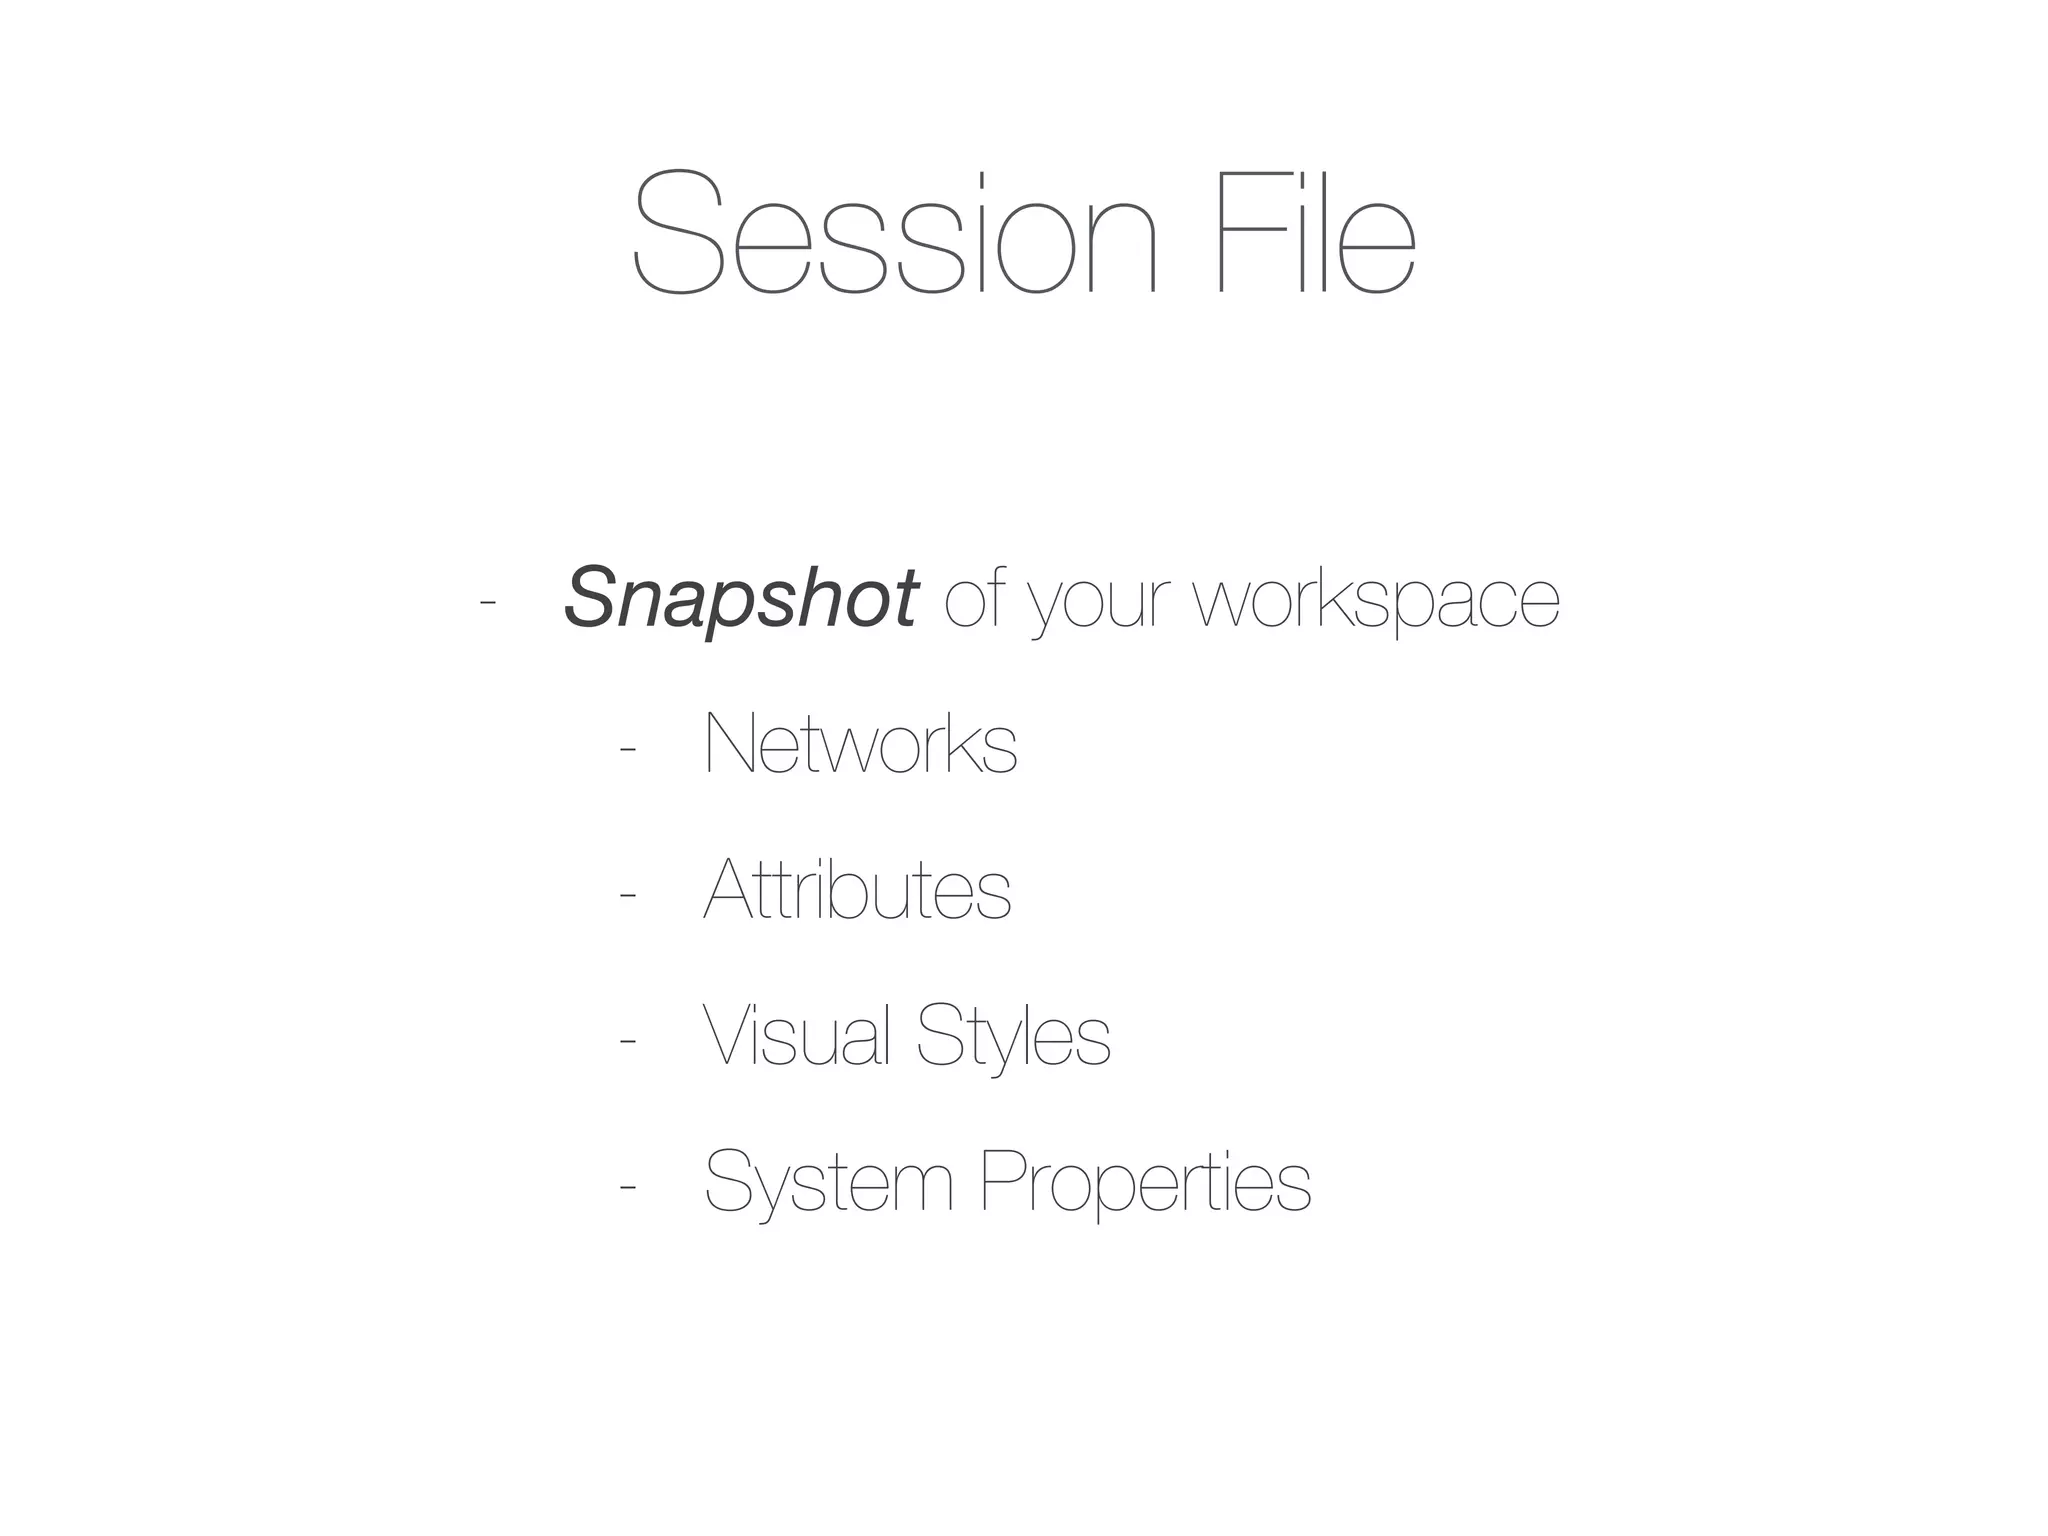
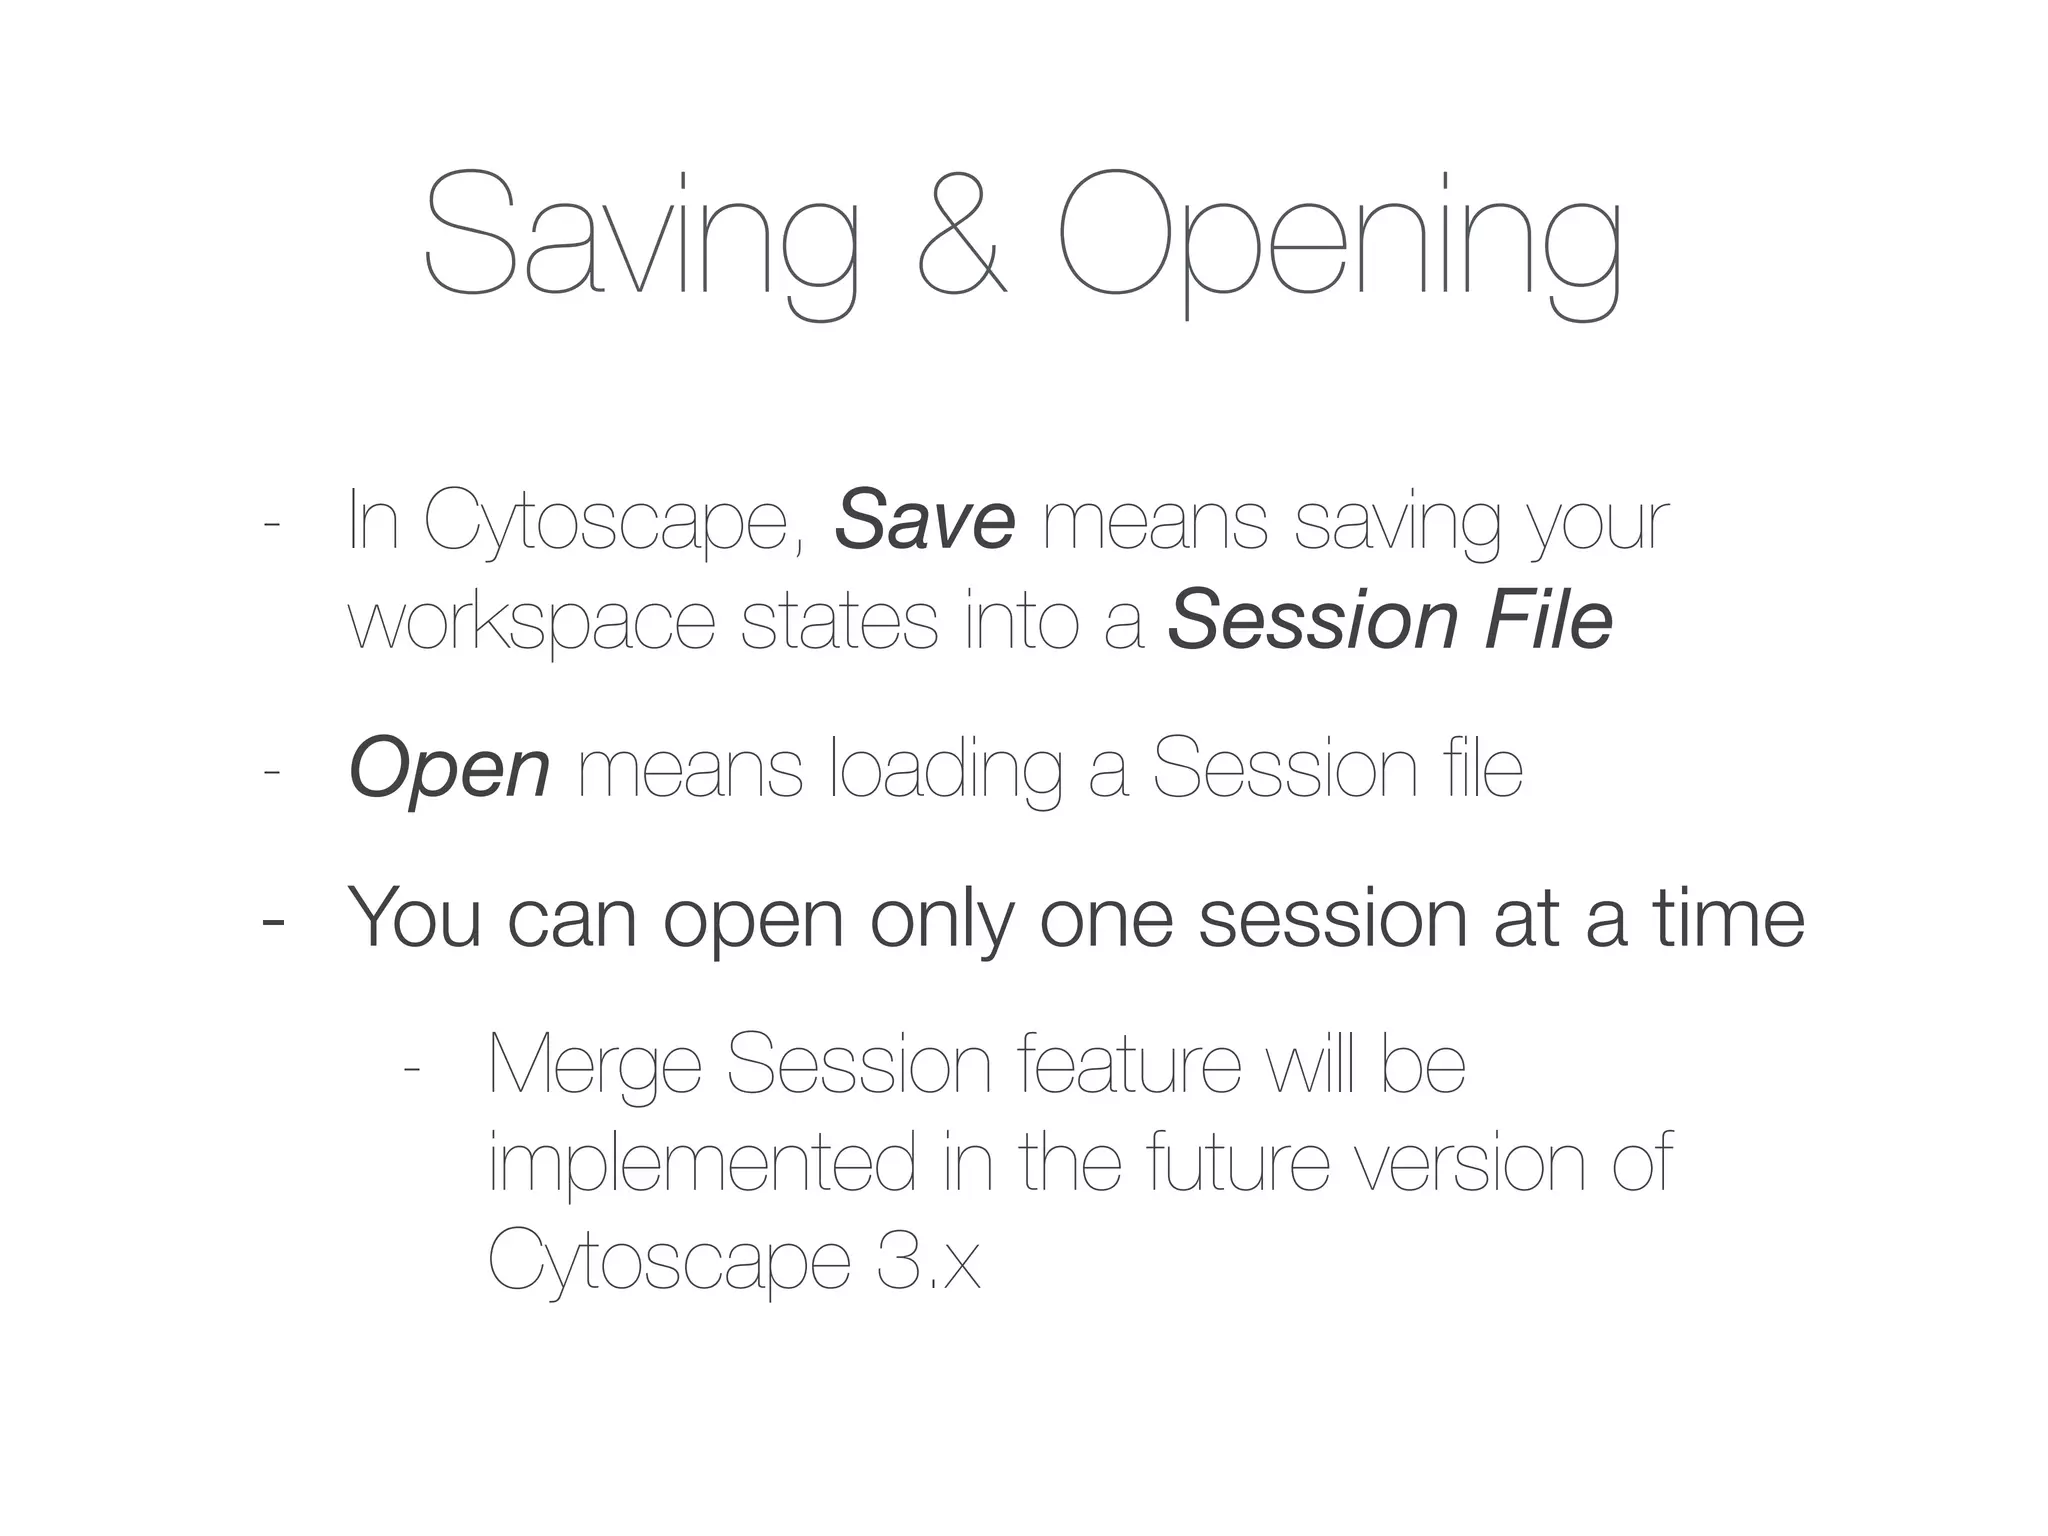
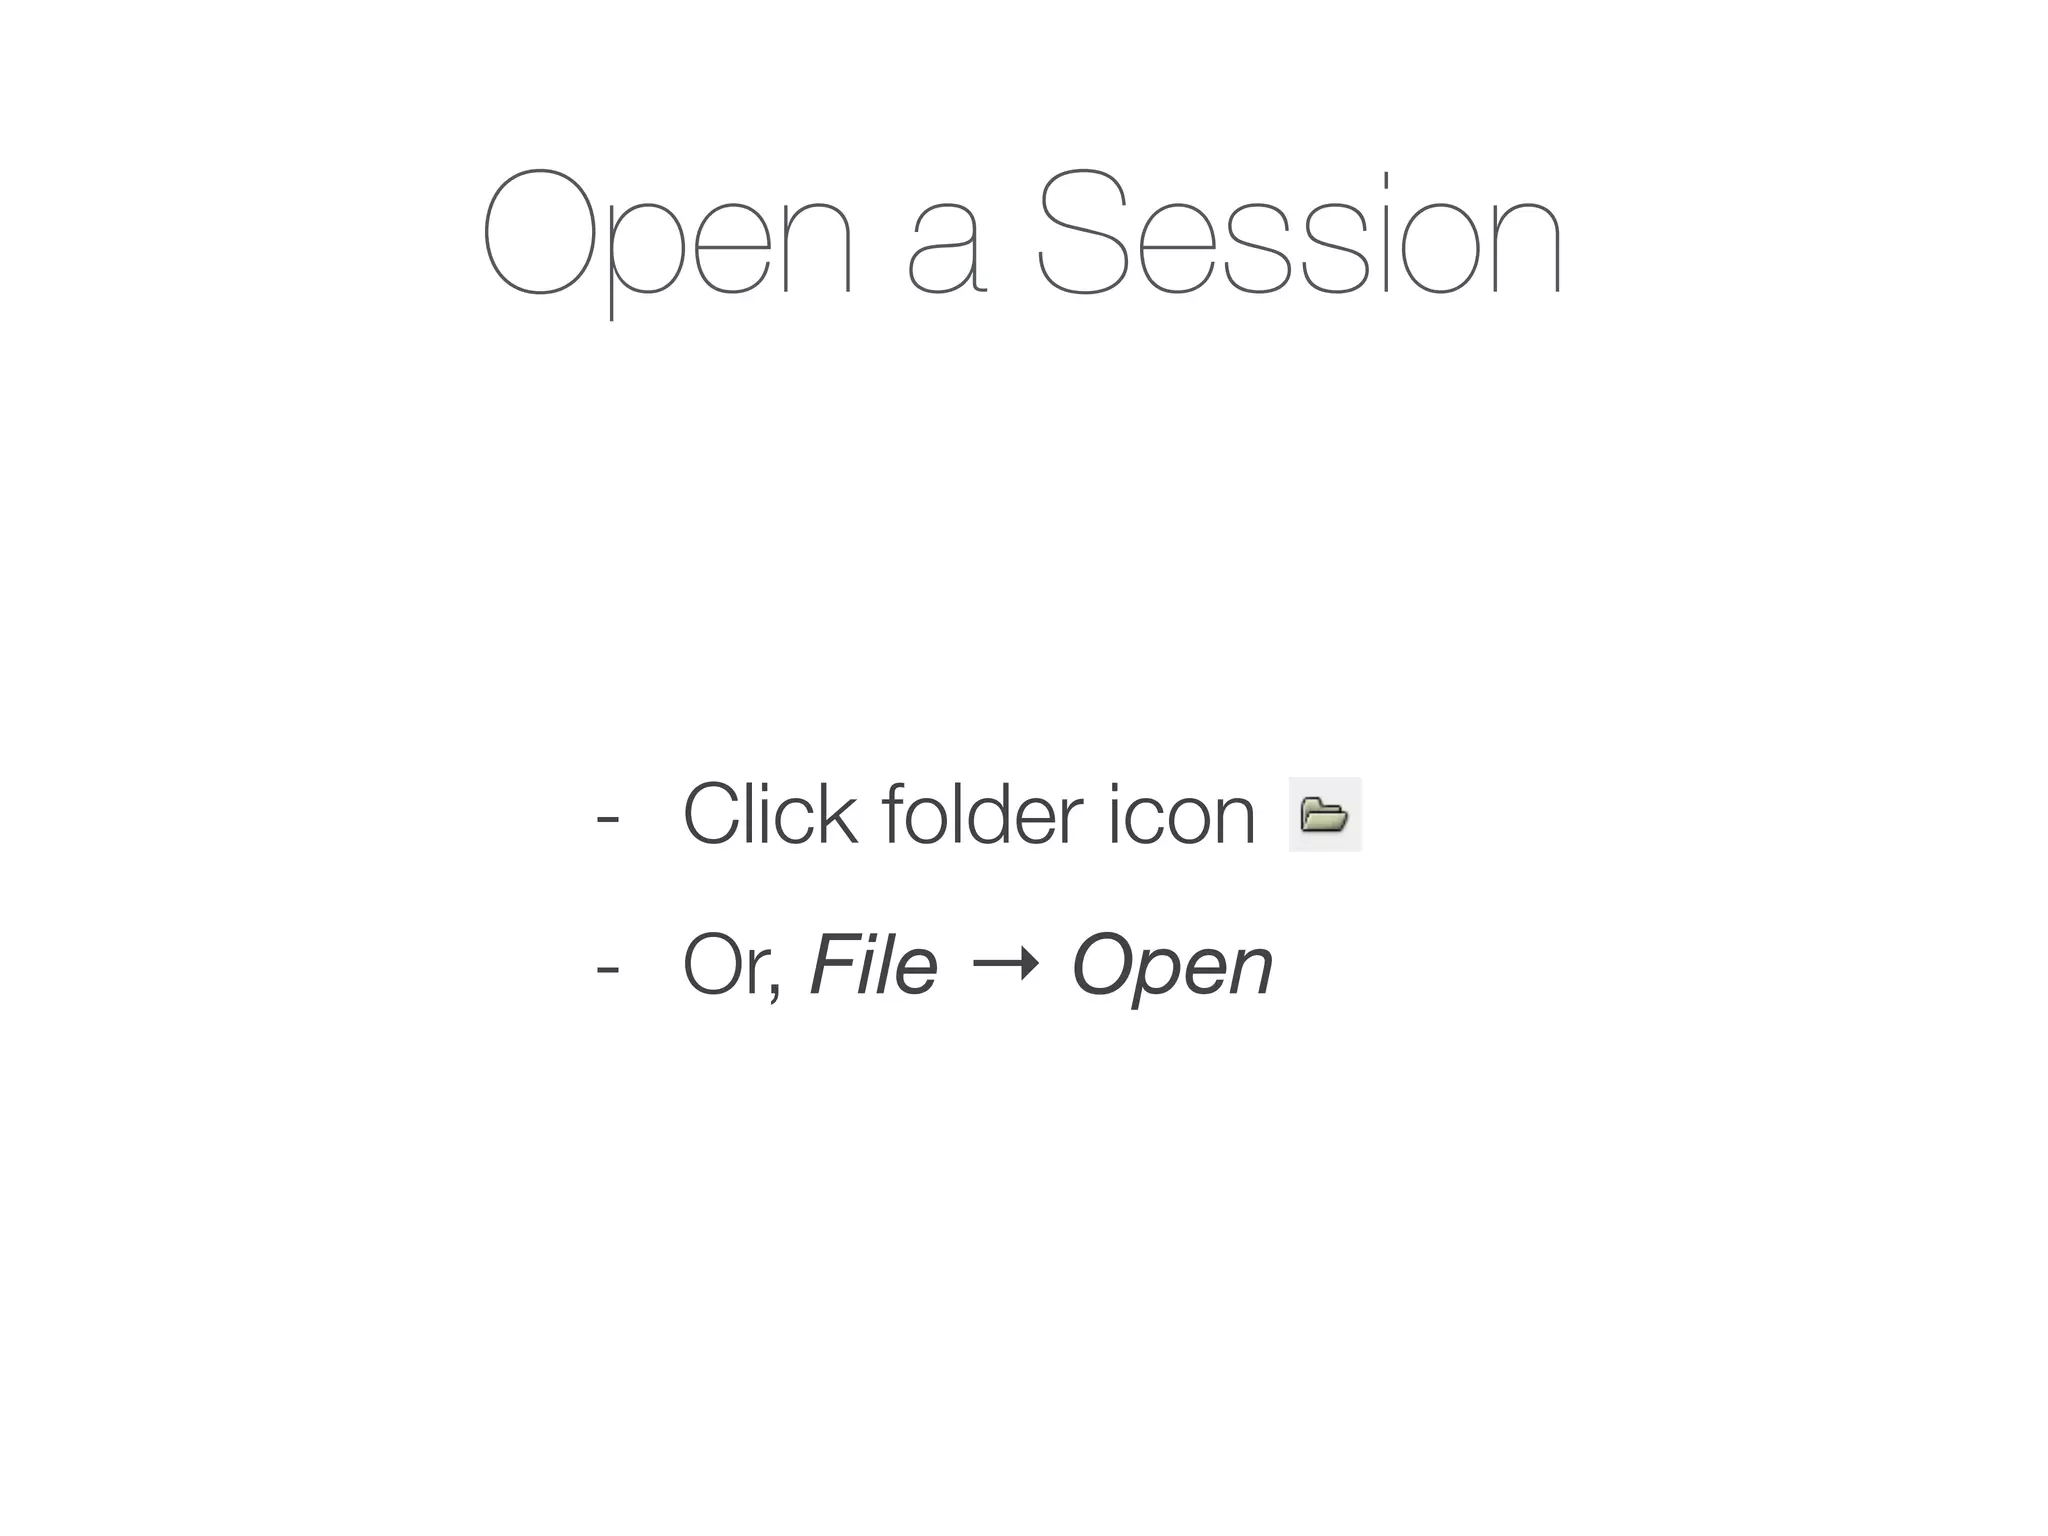
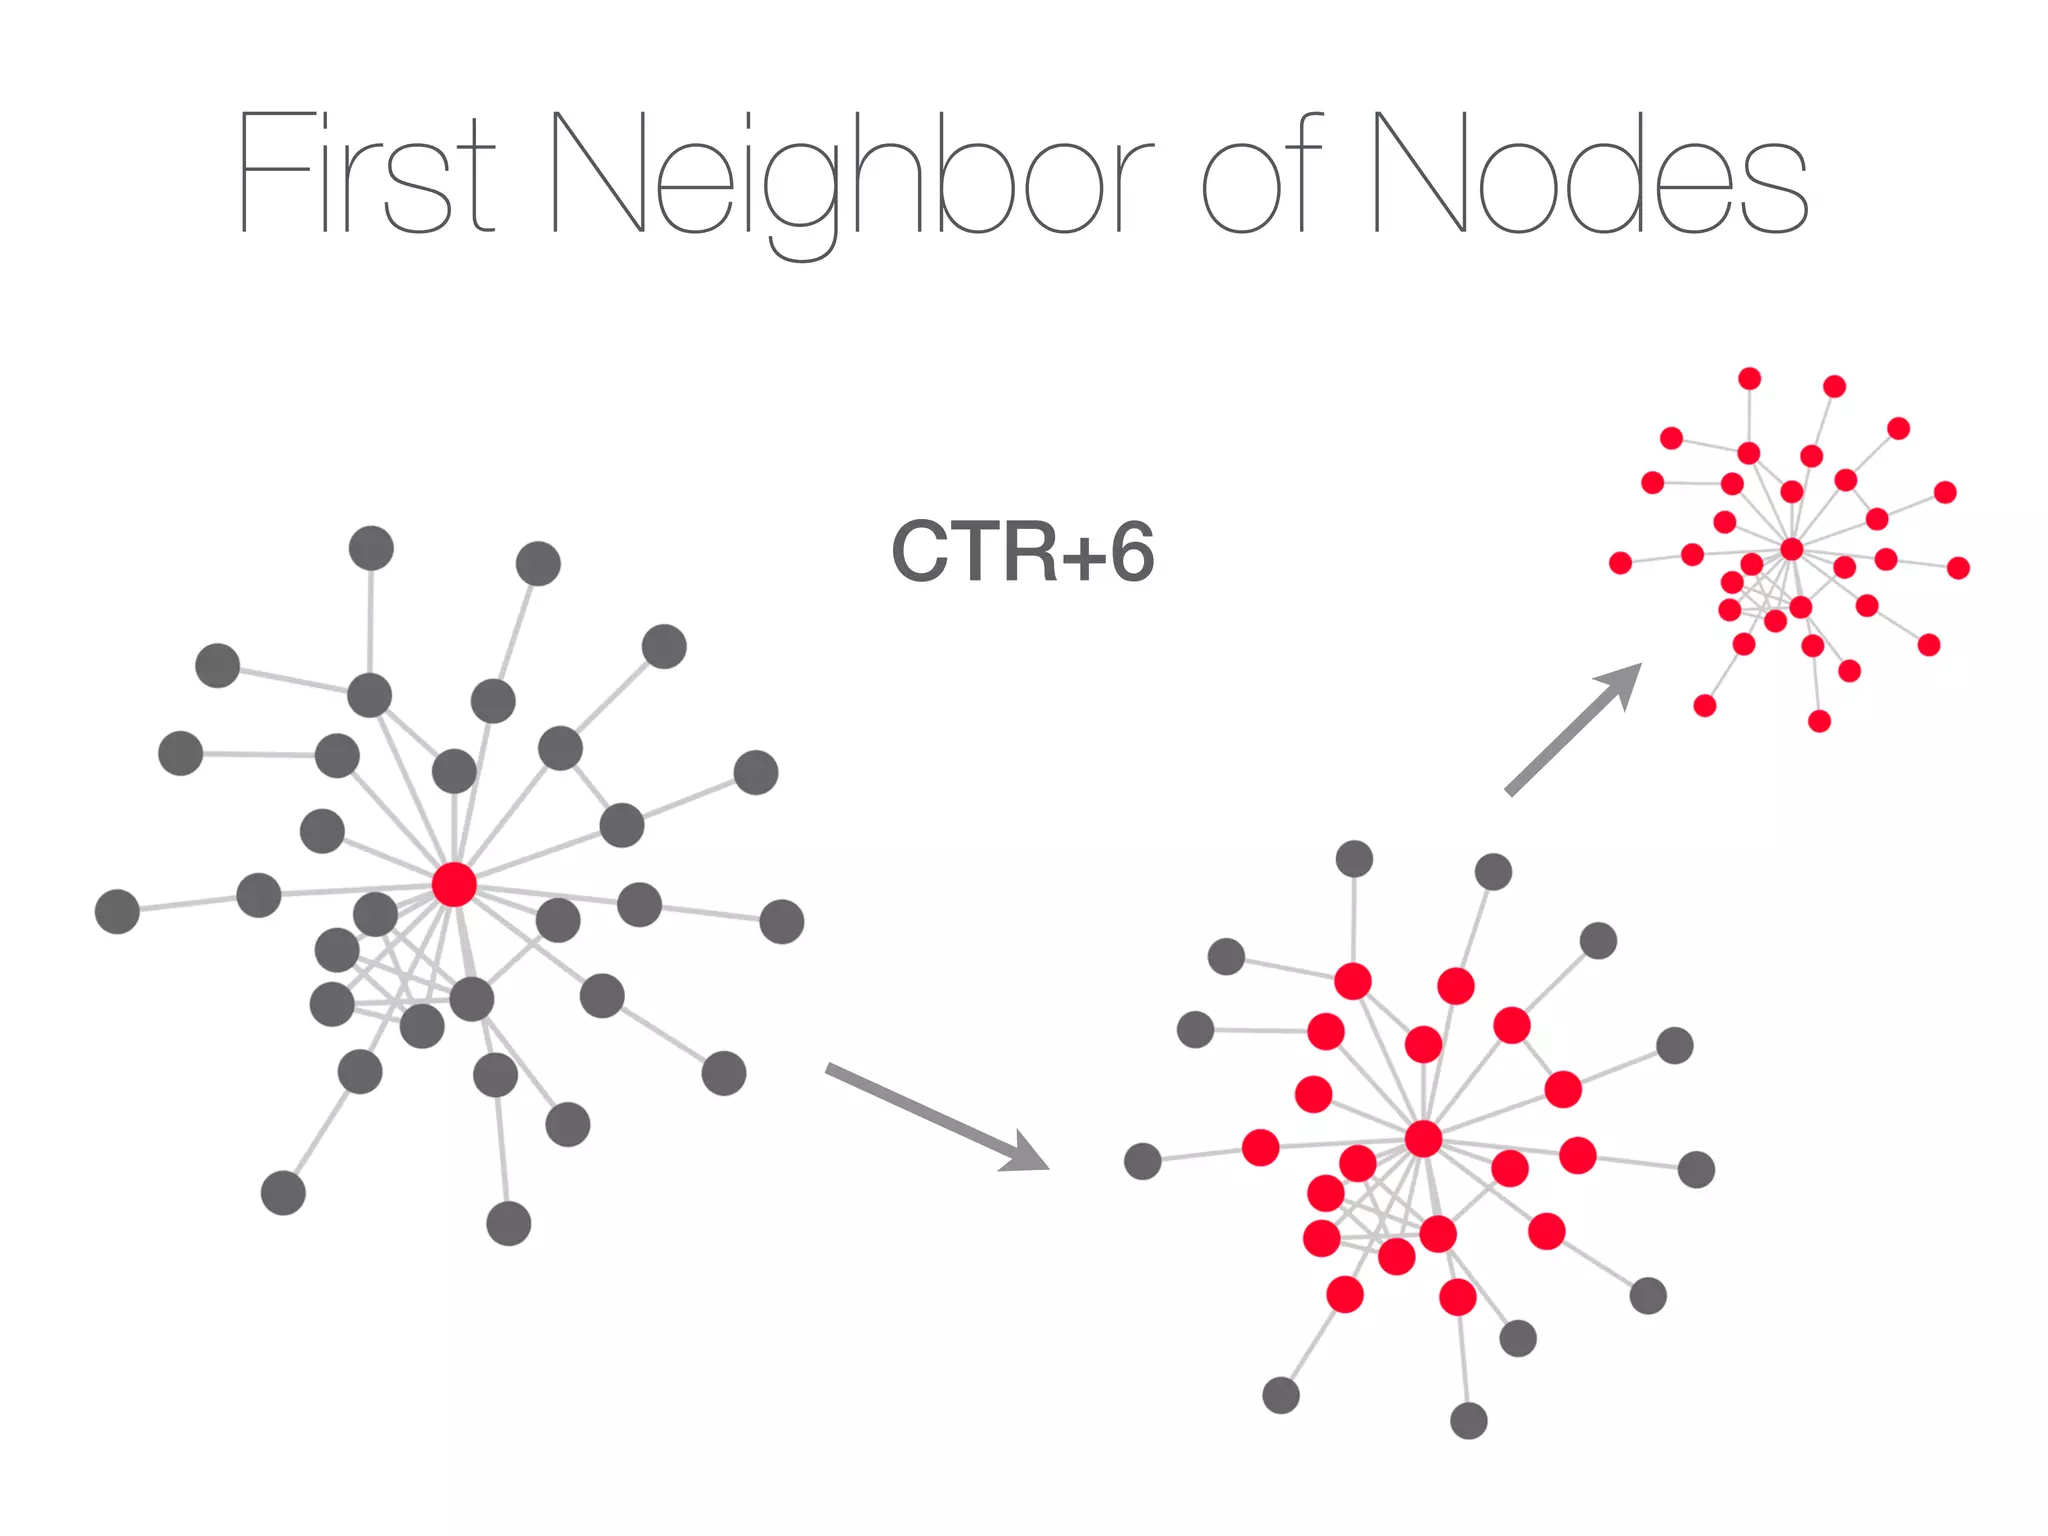
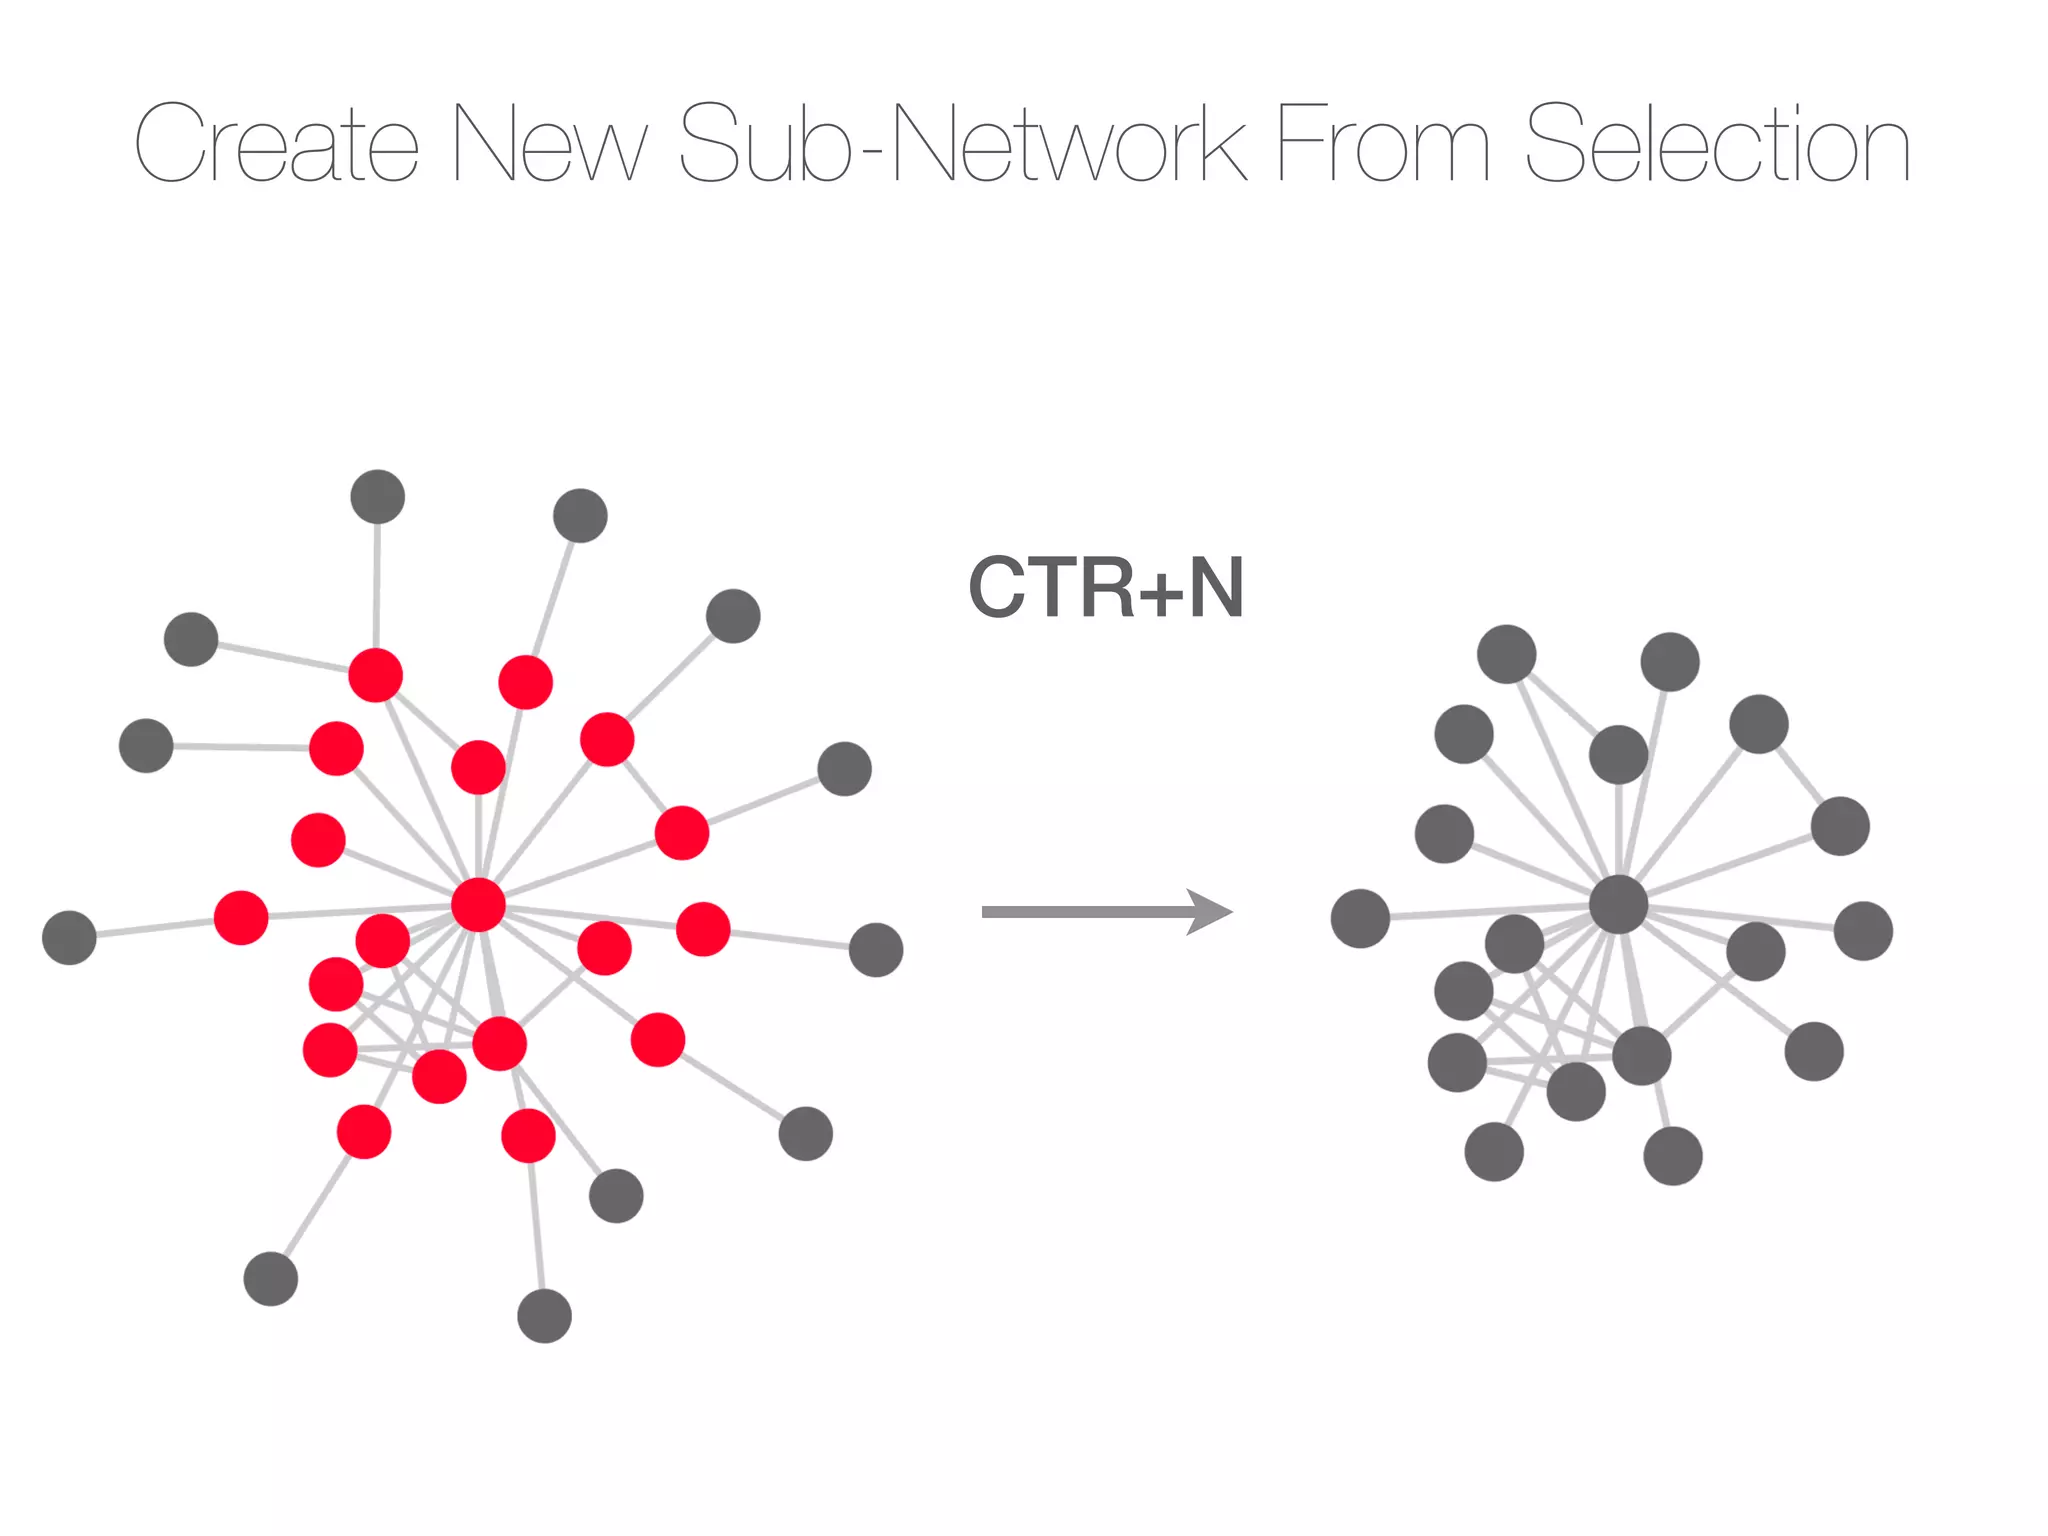
Details on session file management, workspace snapshots, navigation techniques, and creating subnetworks.
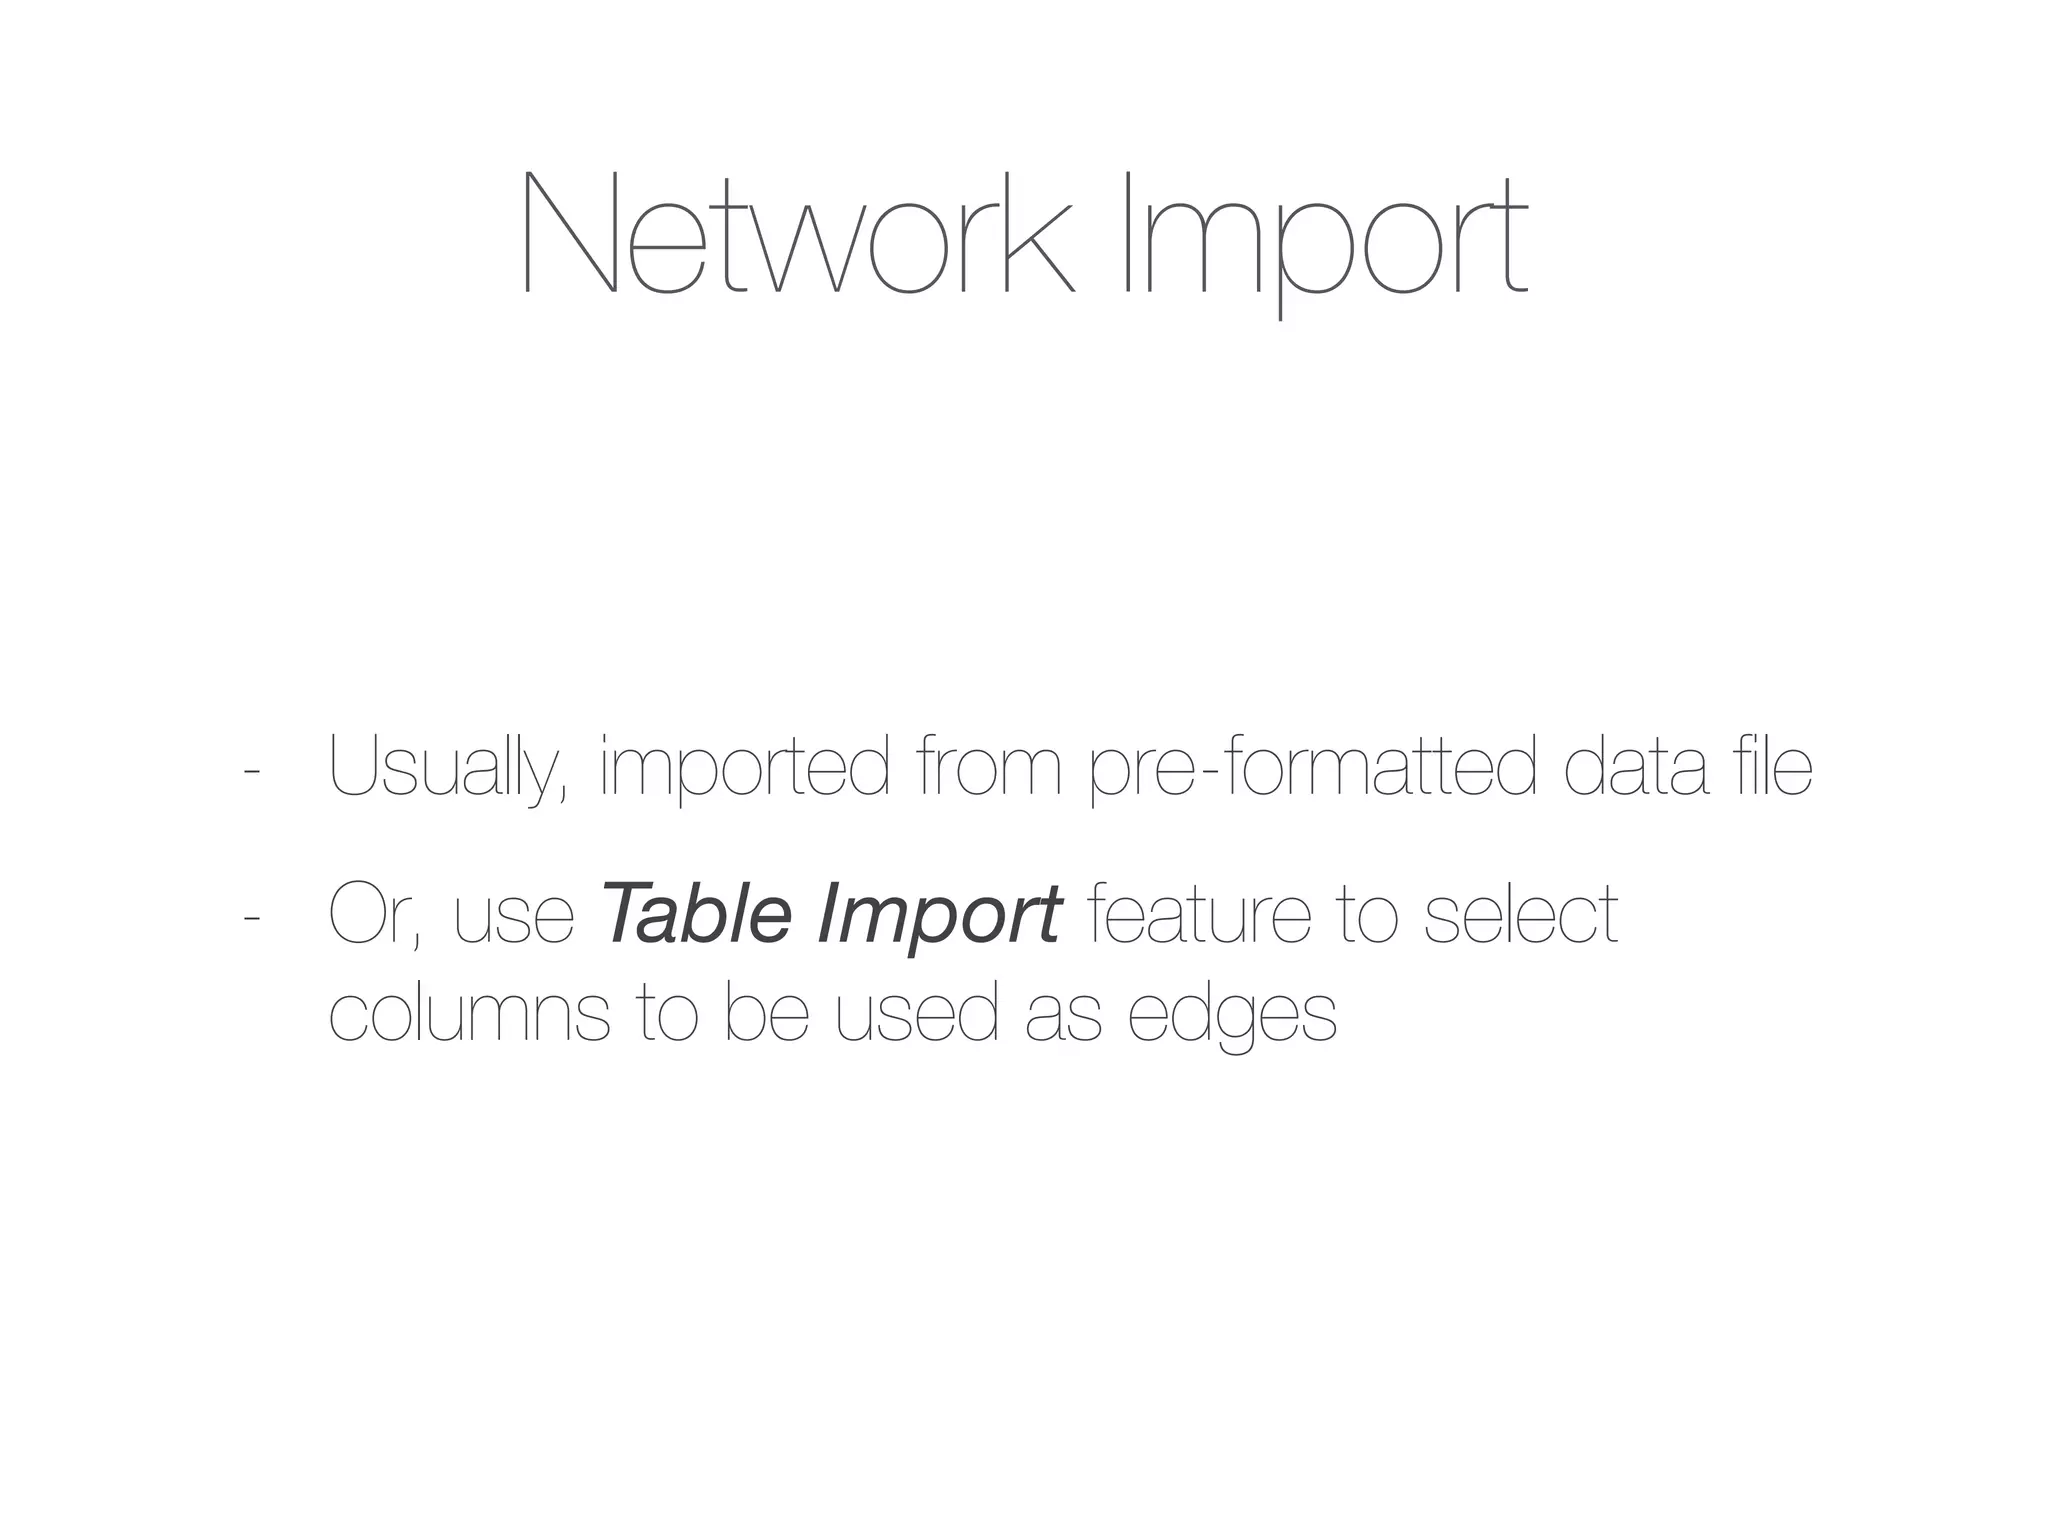
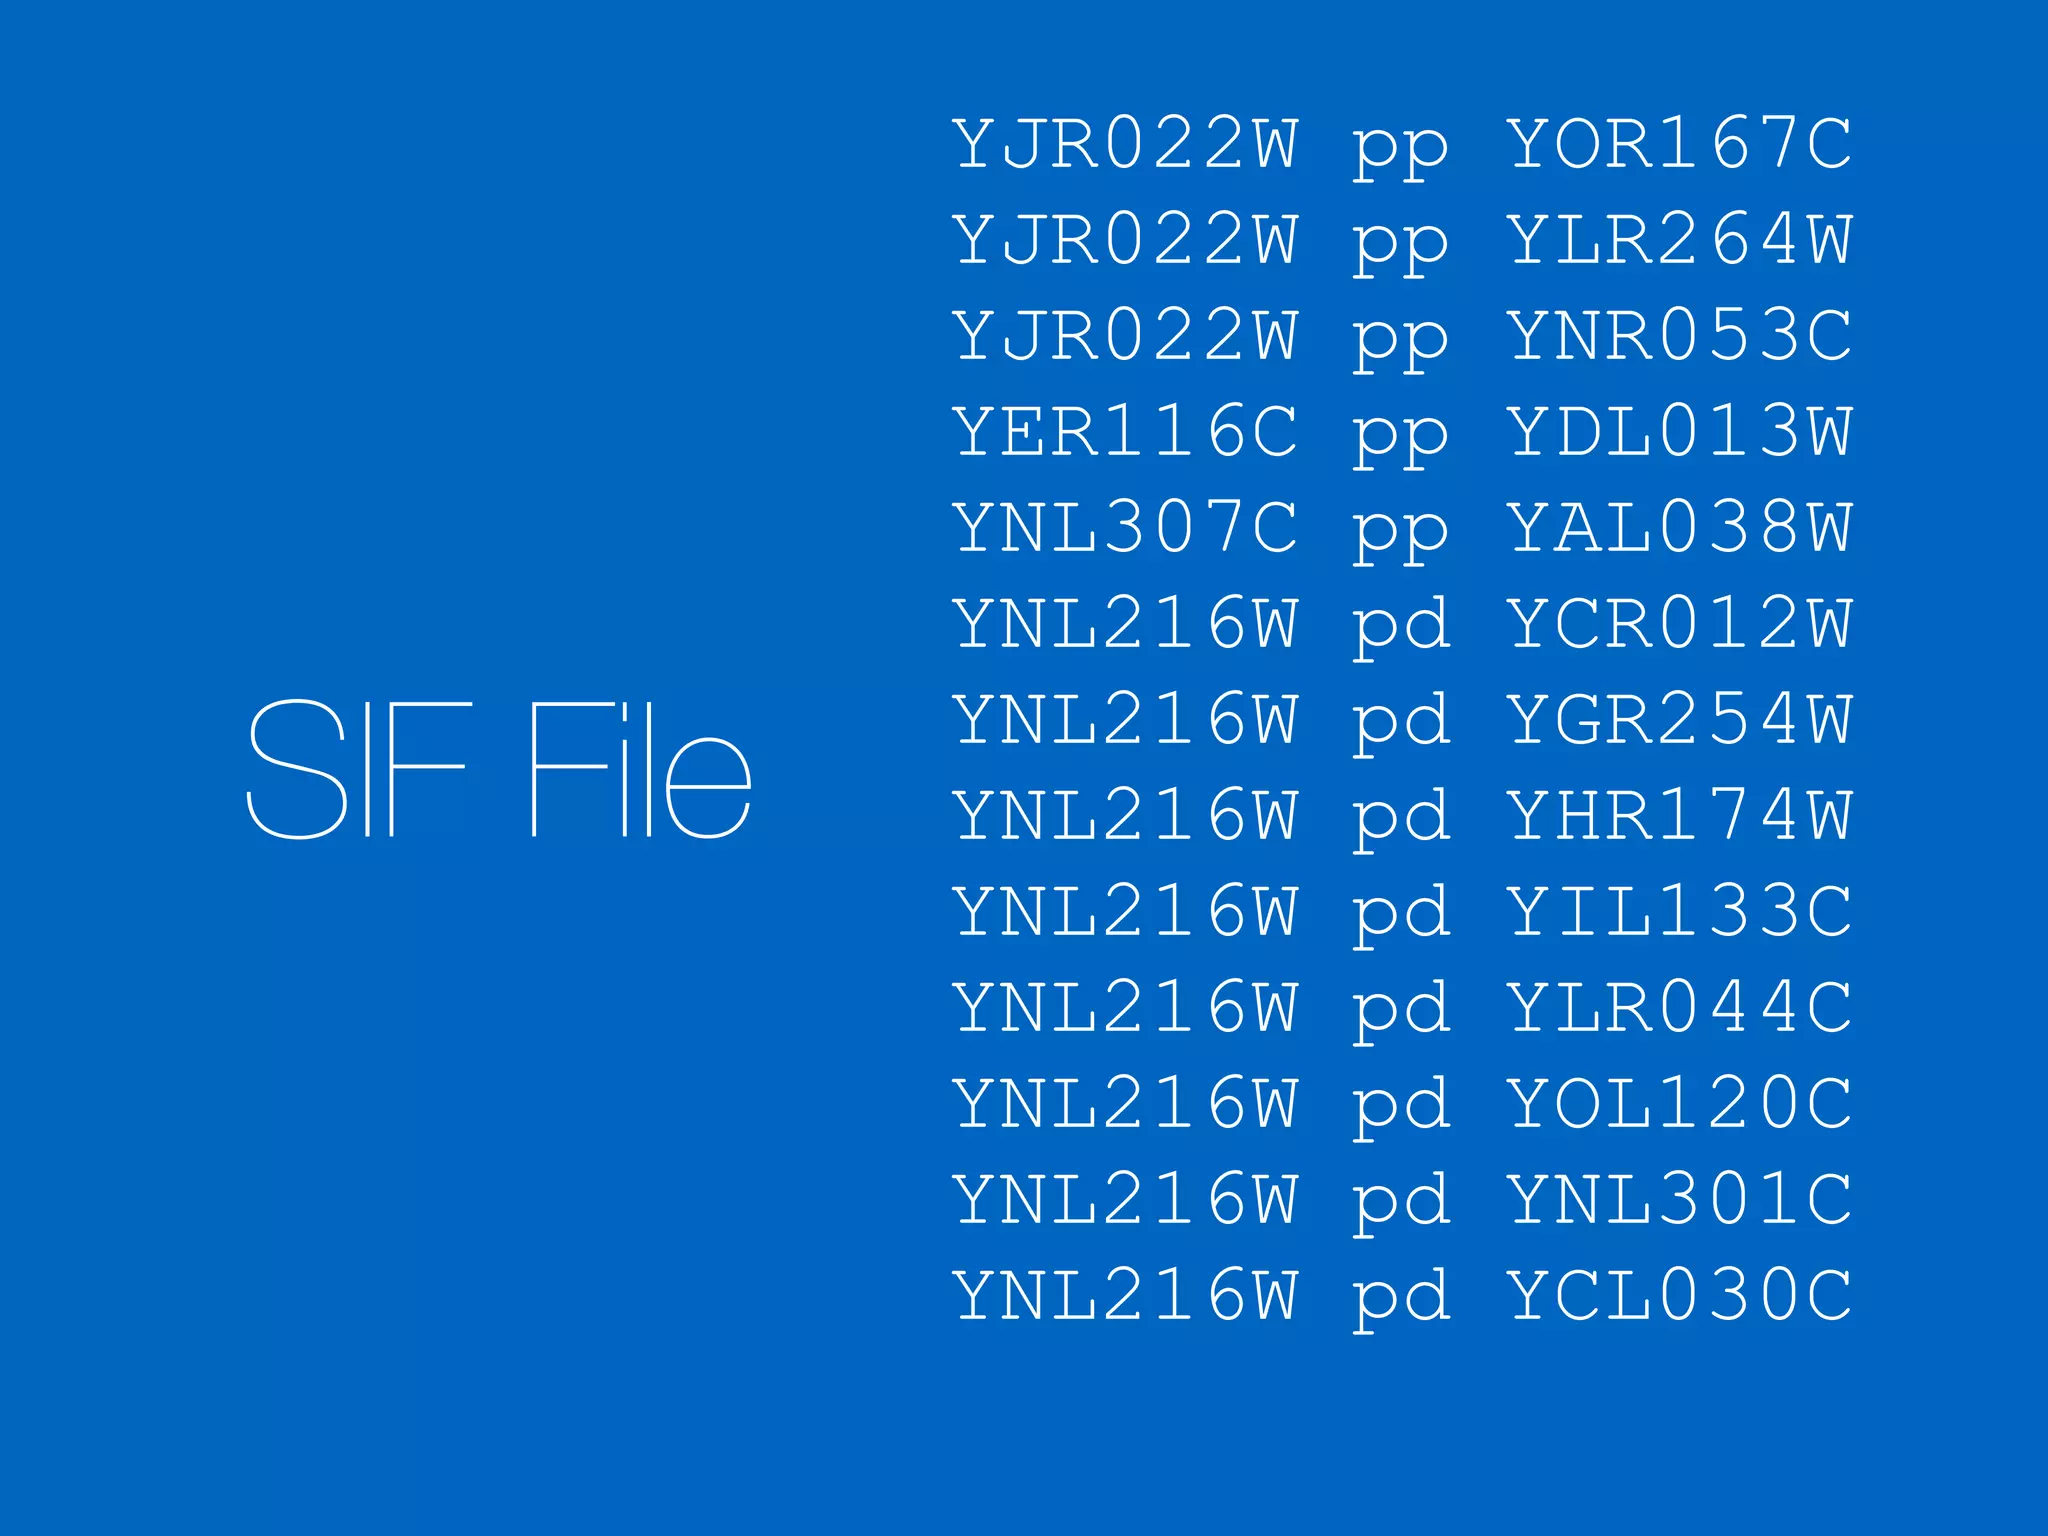
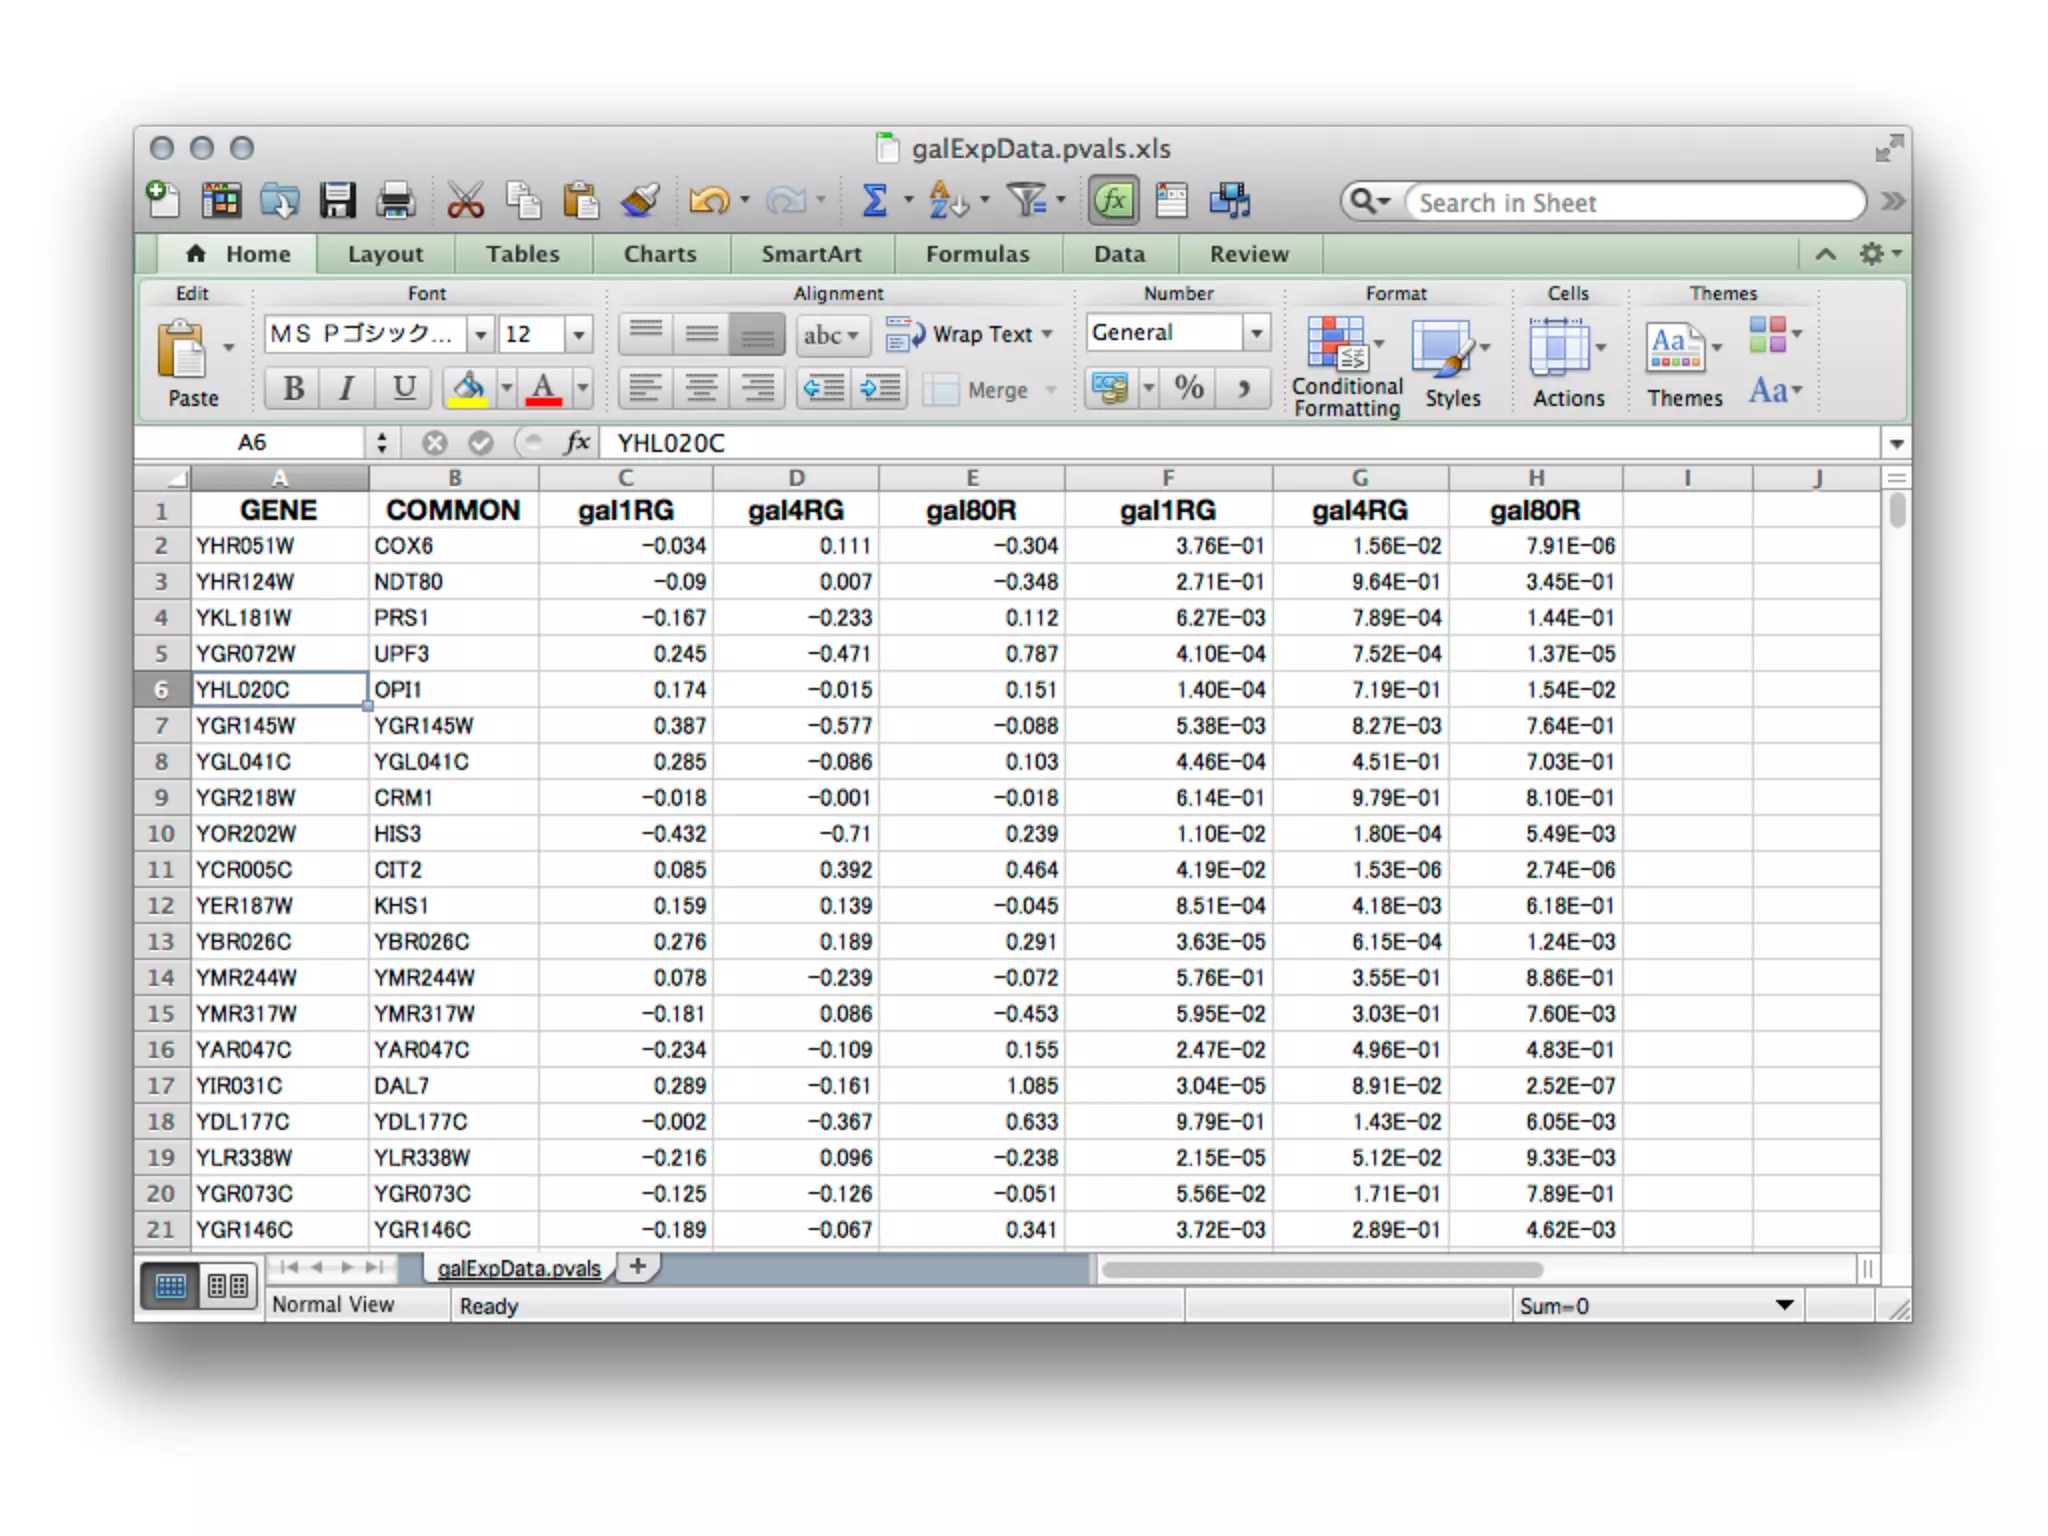
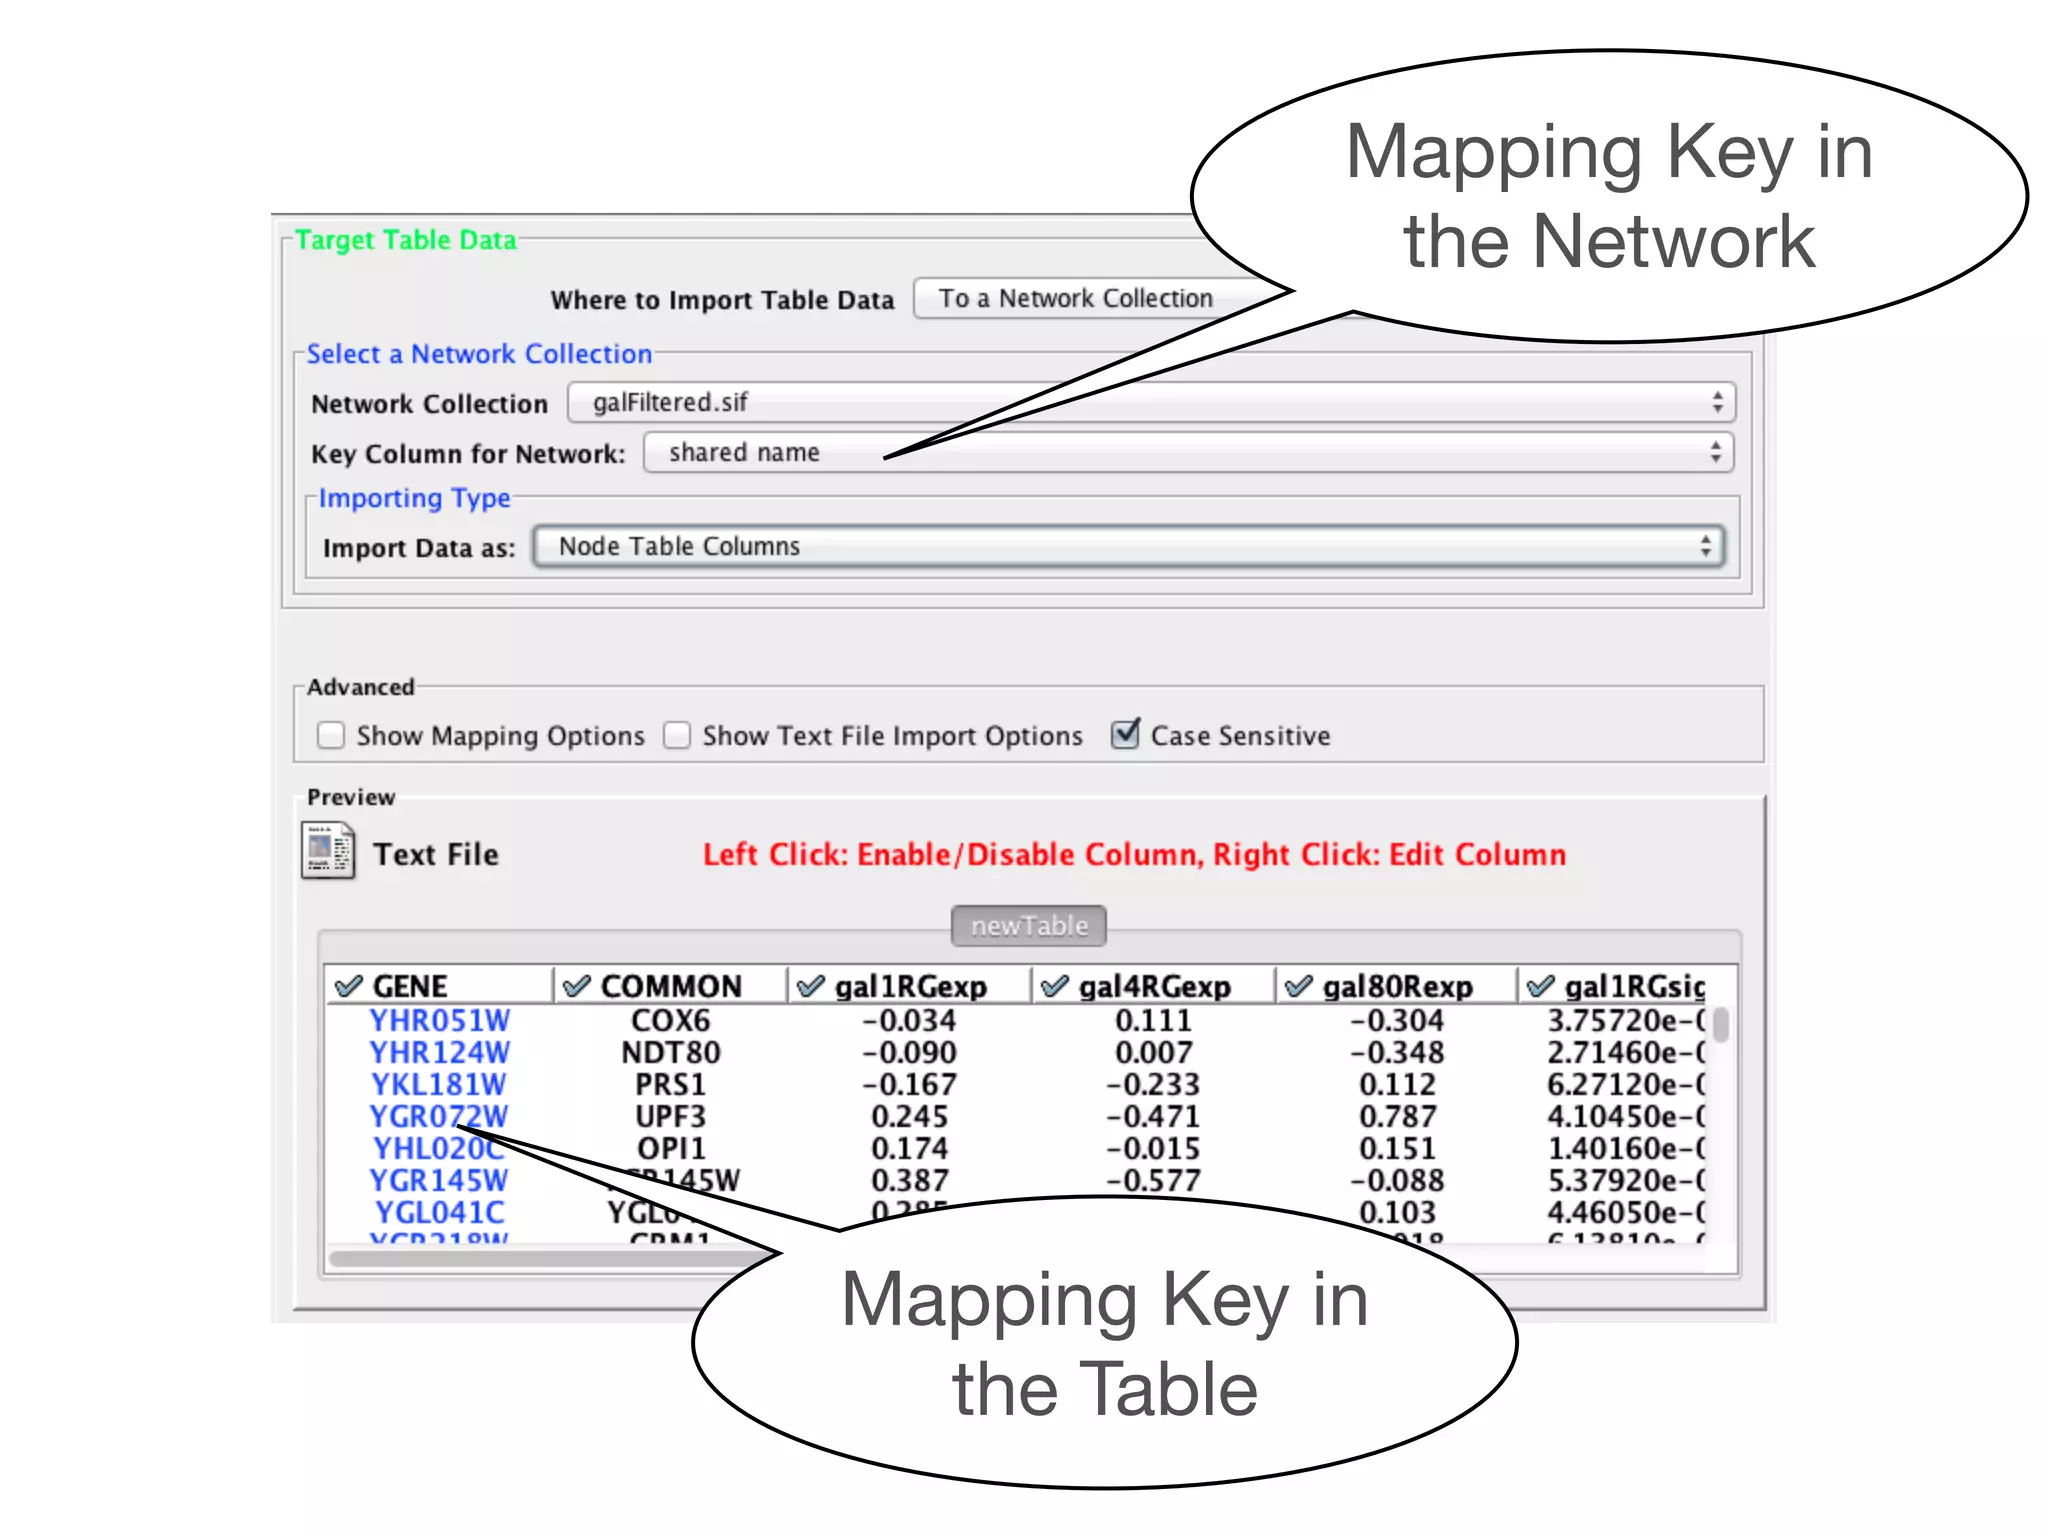
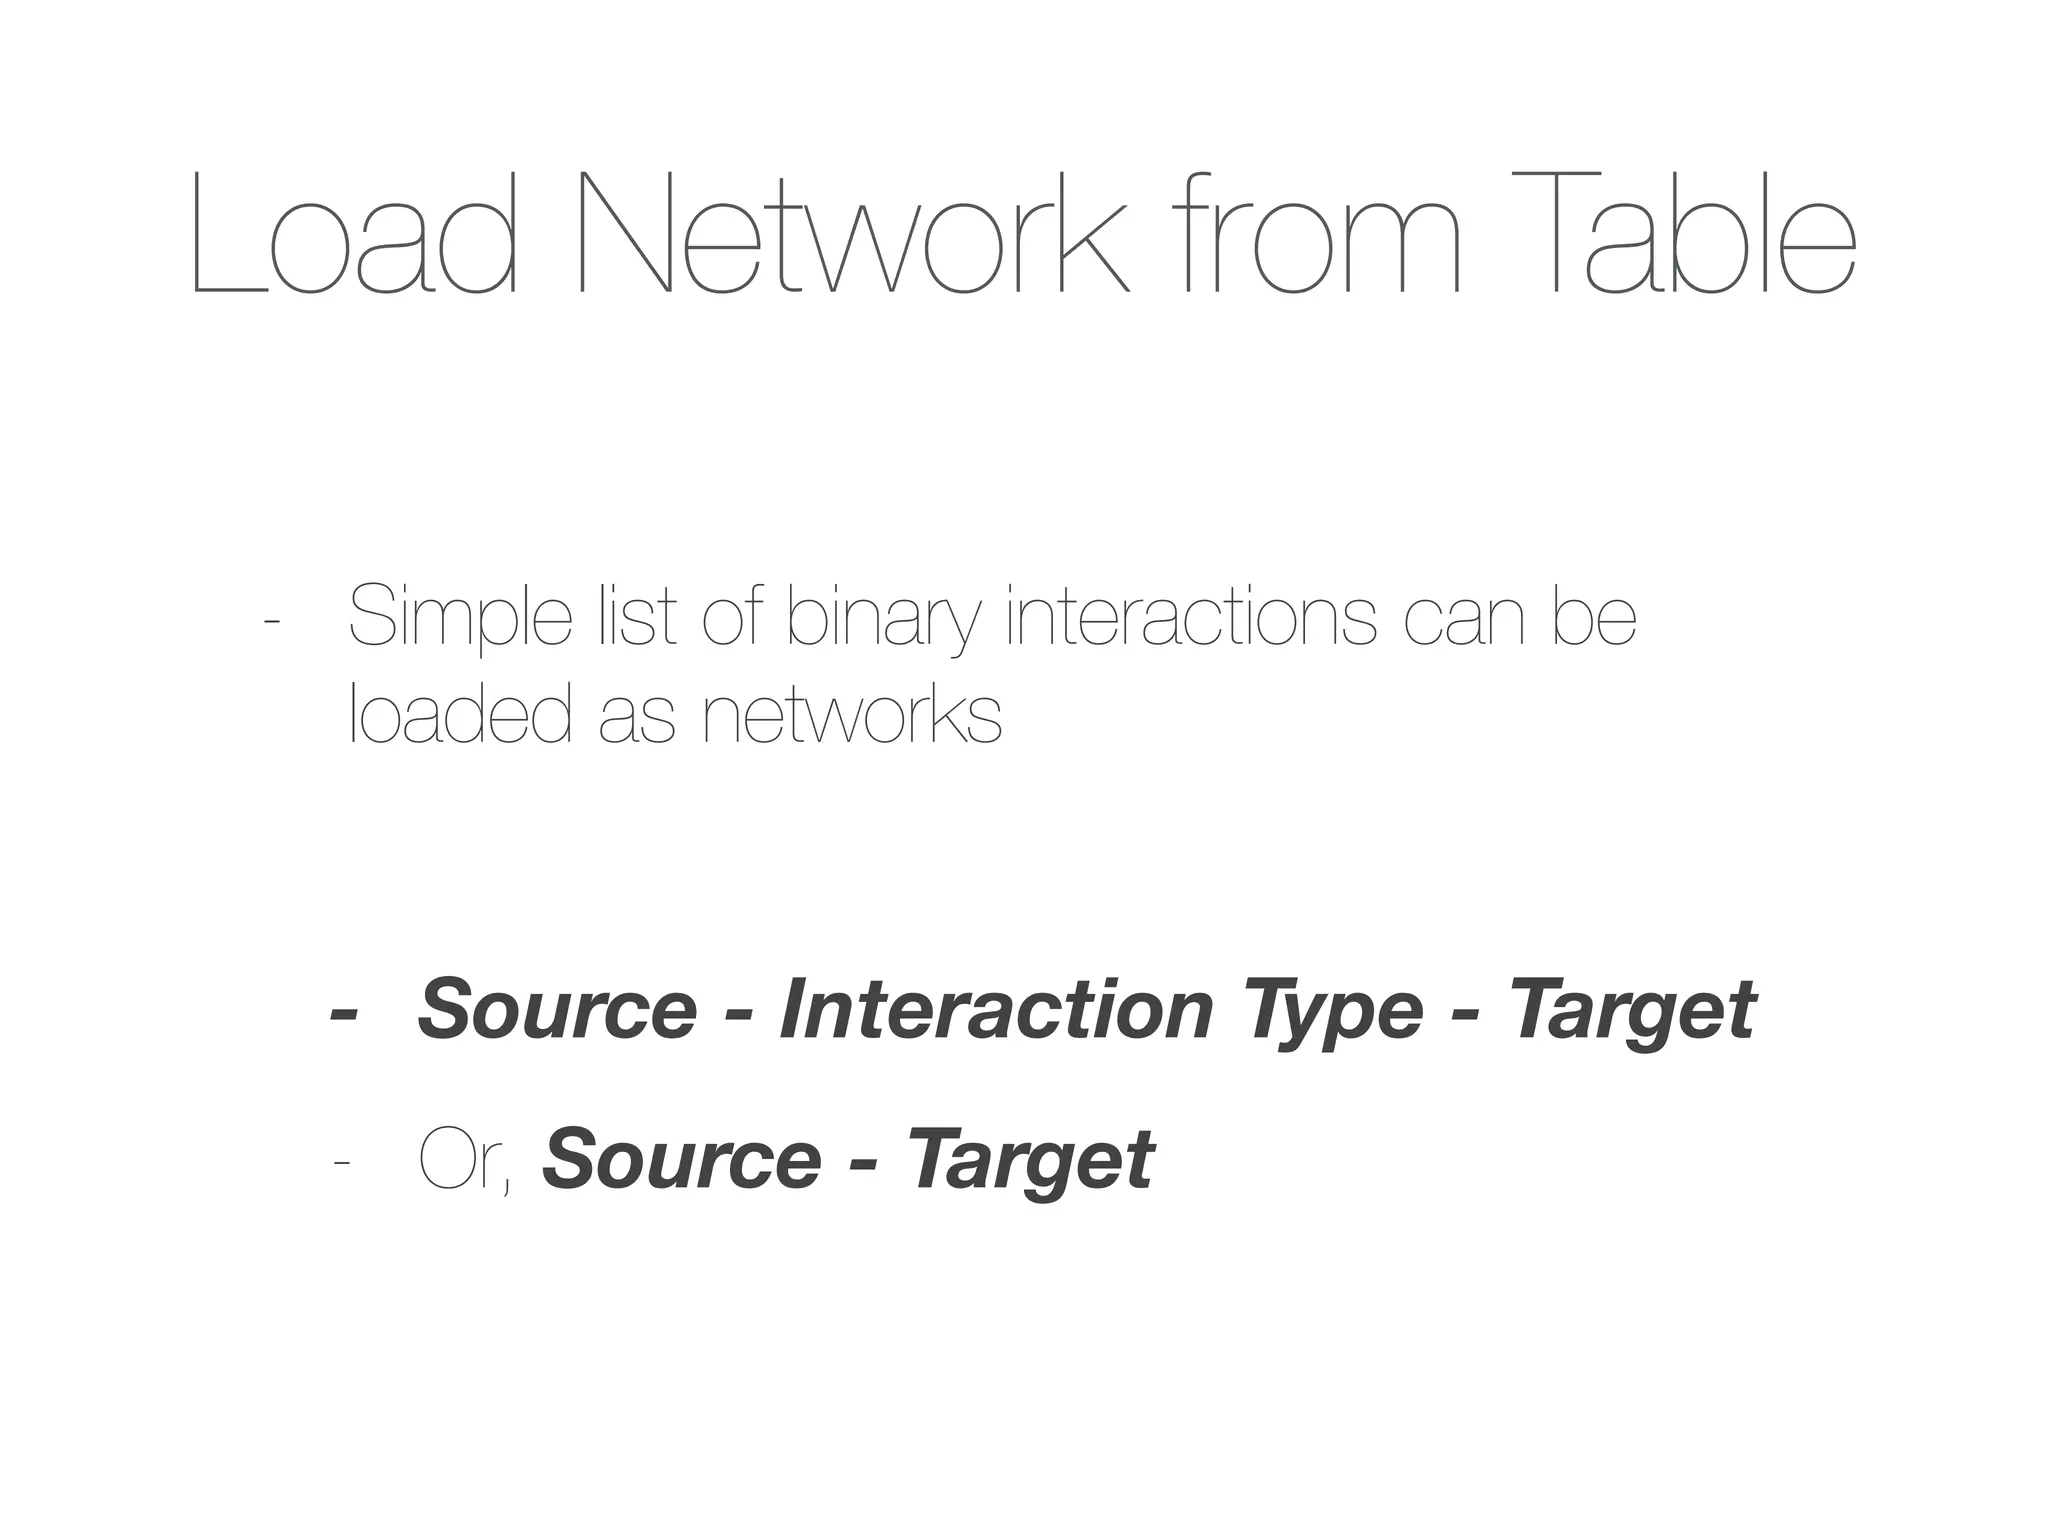
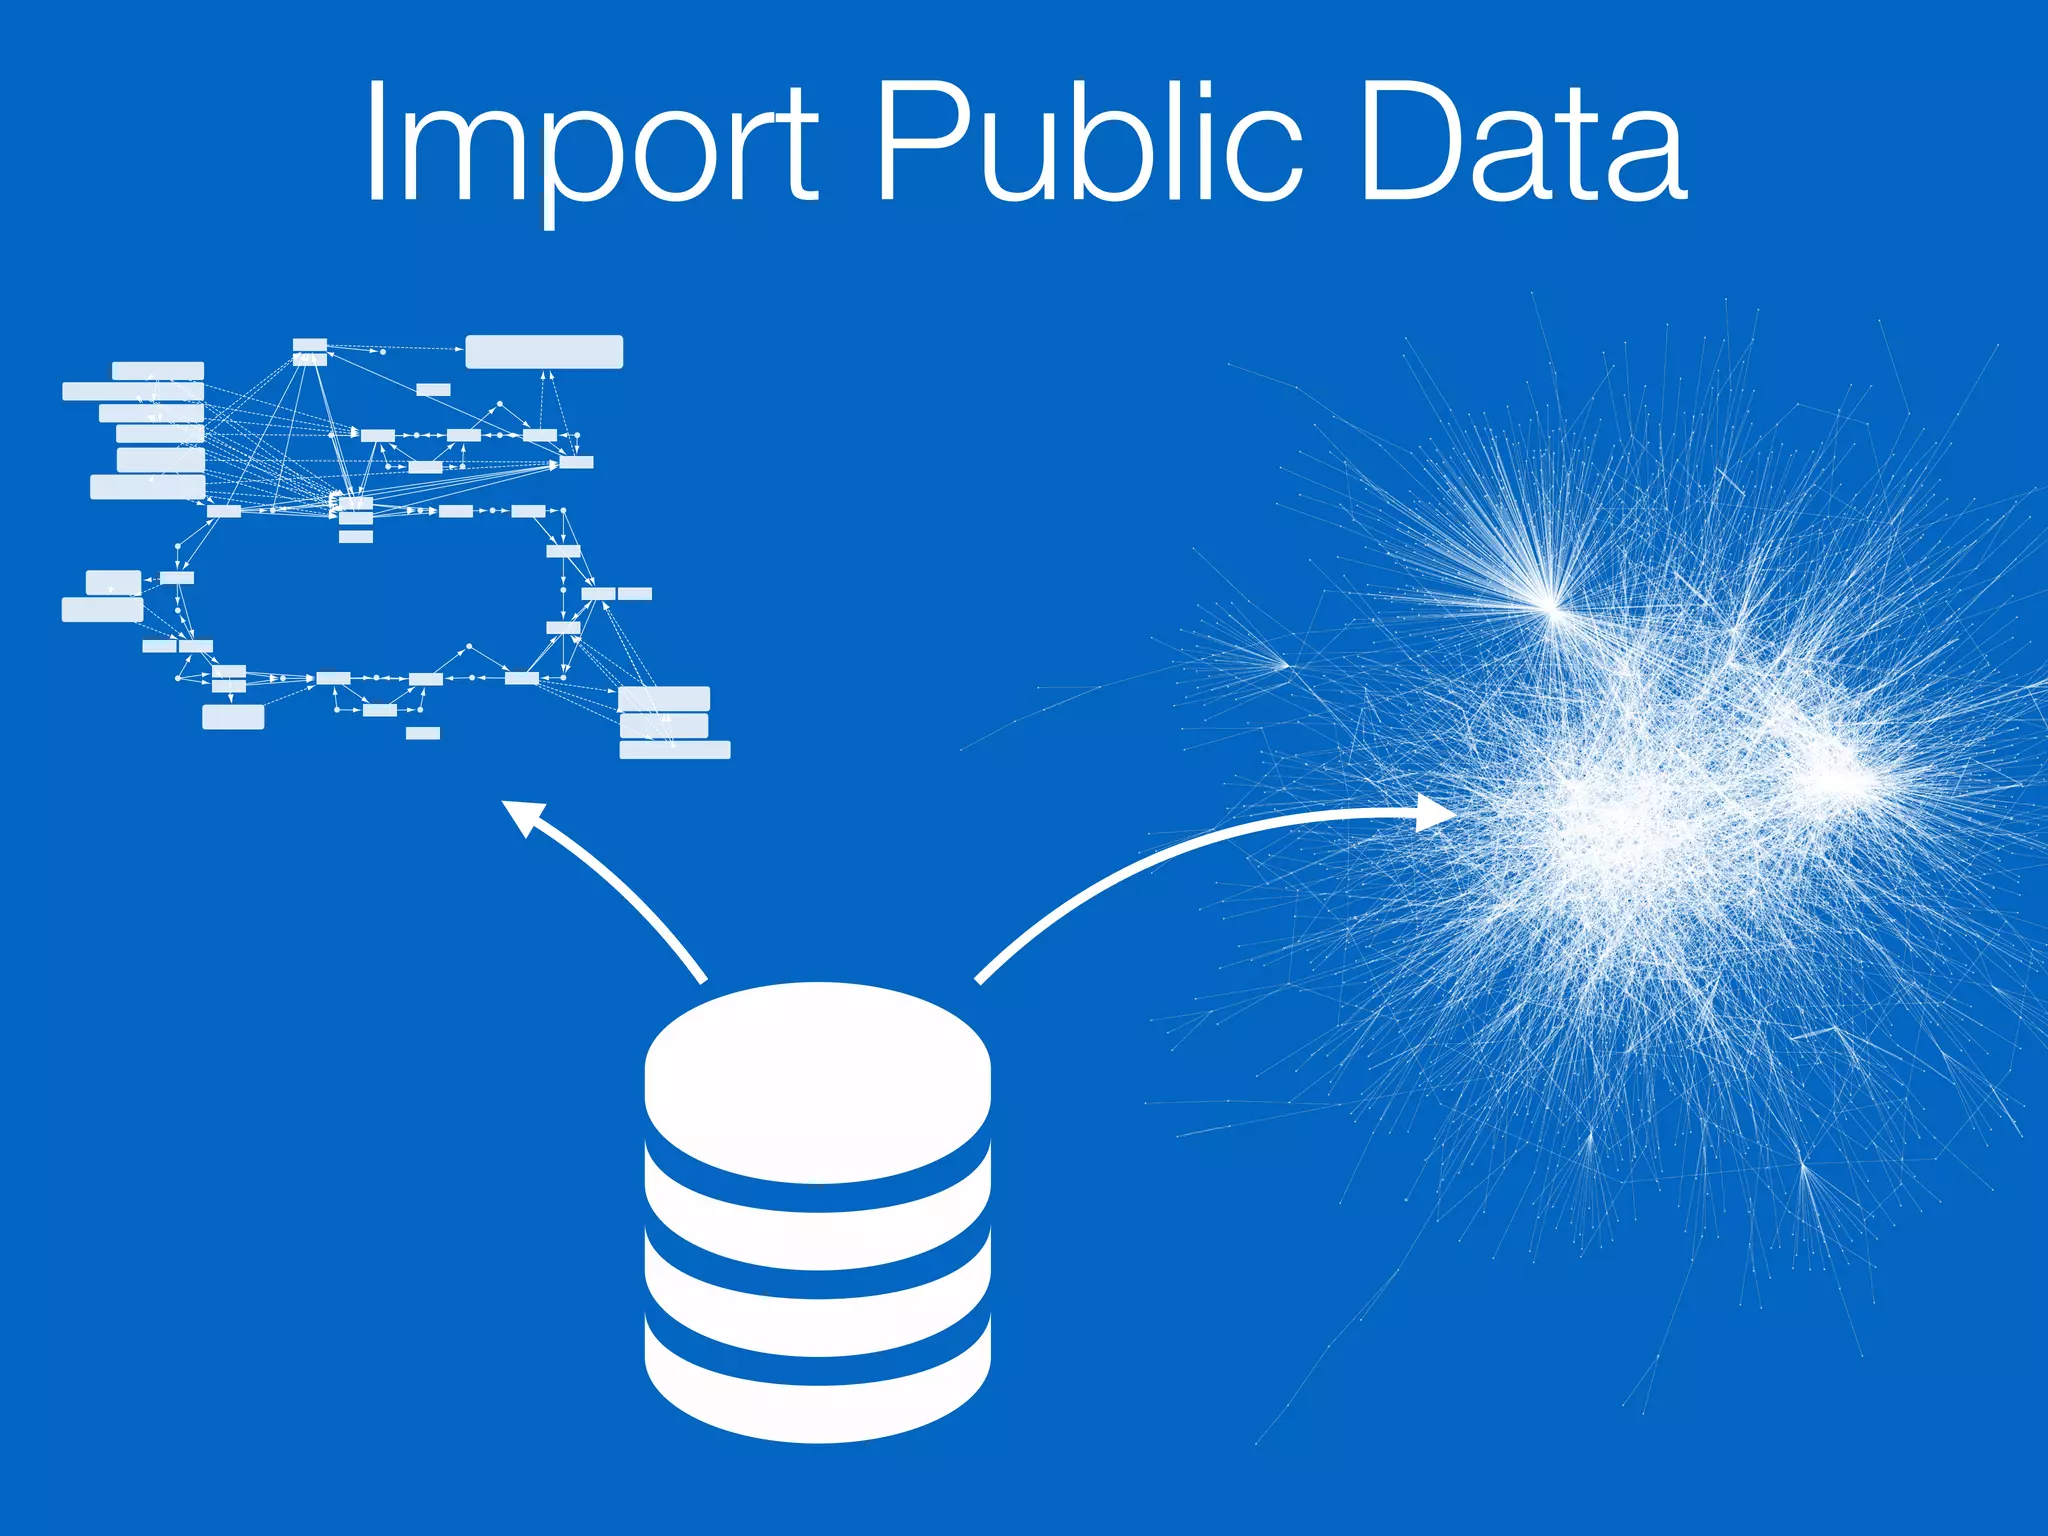
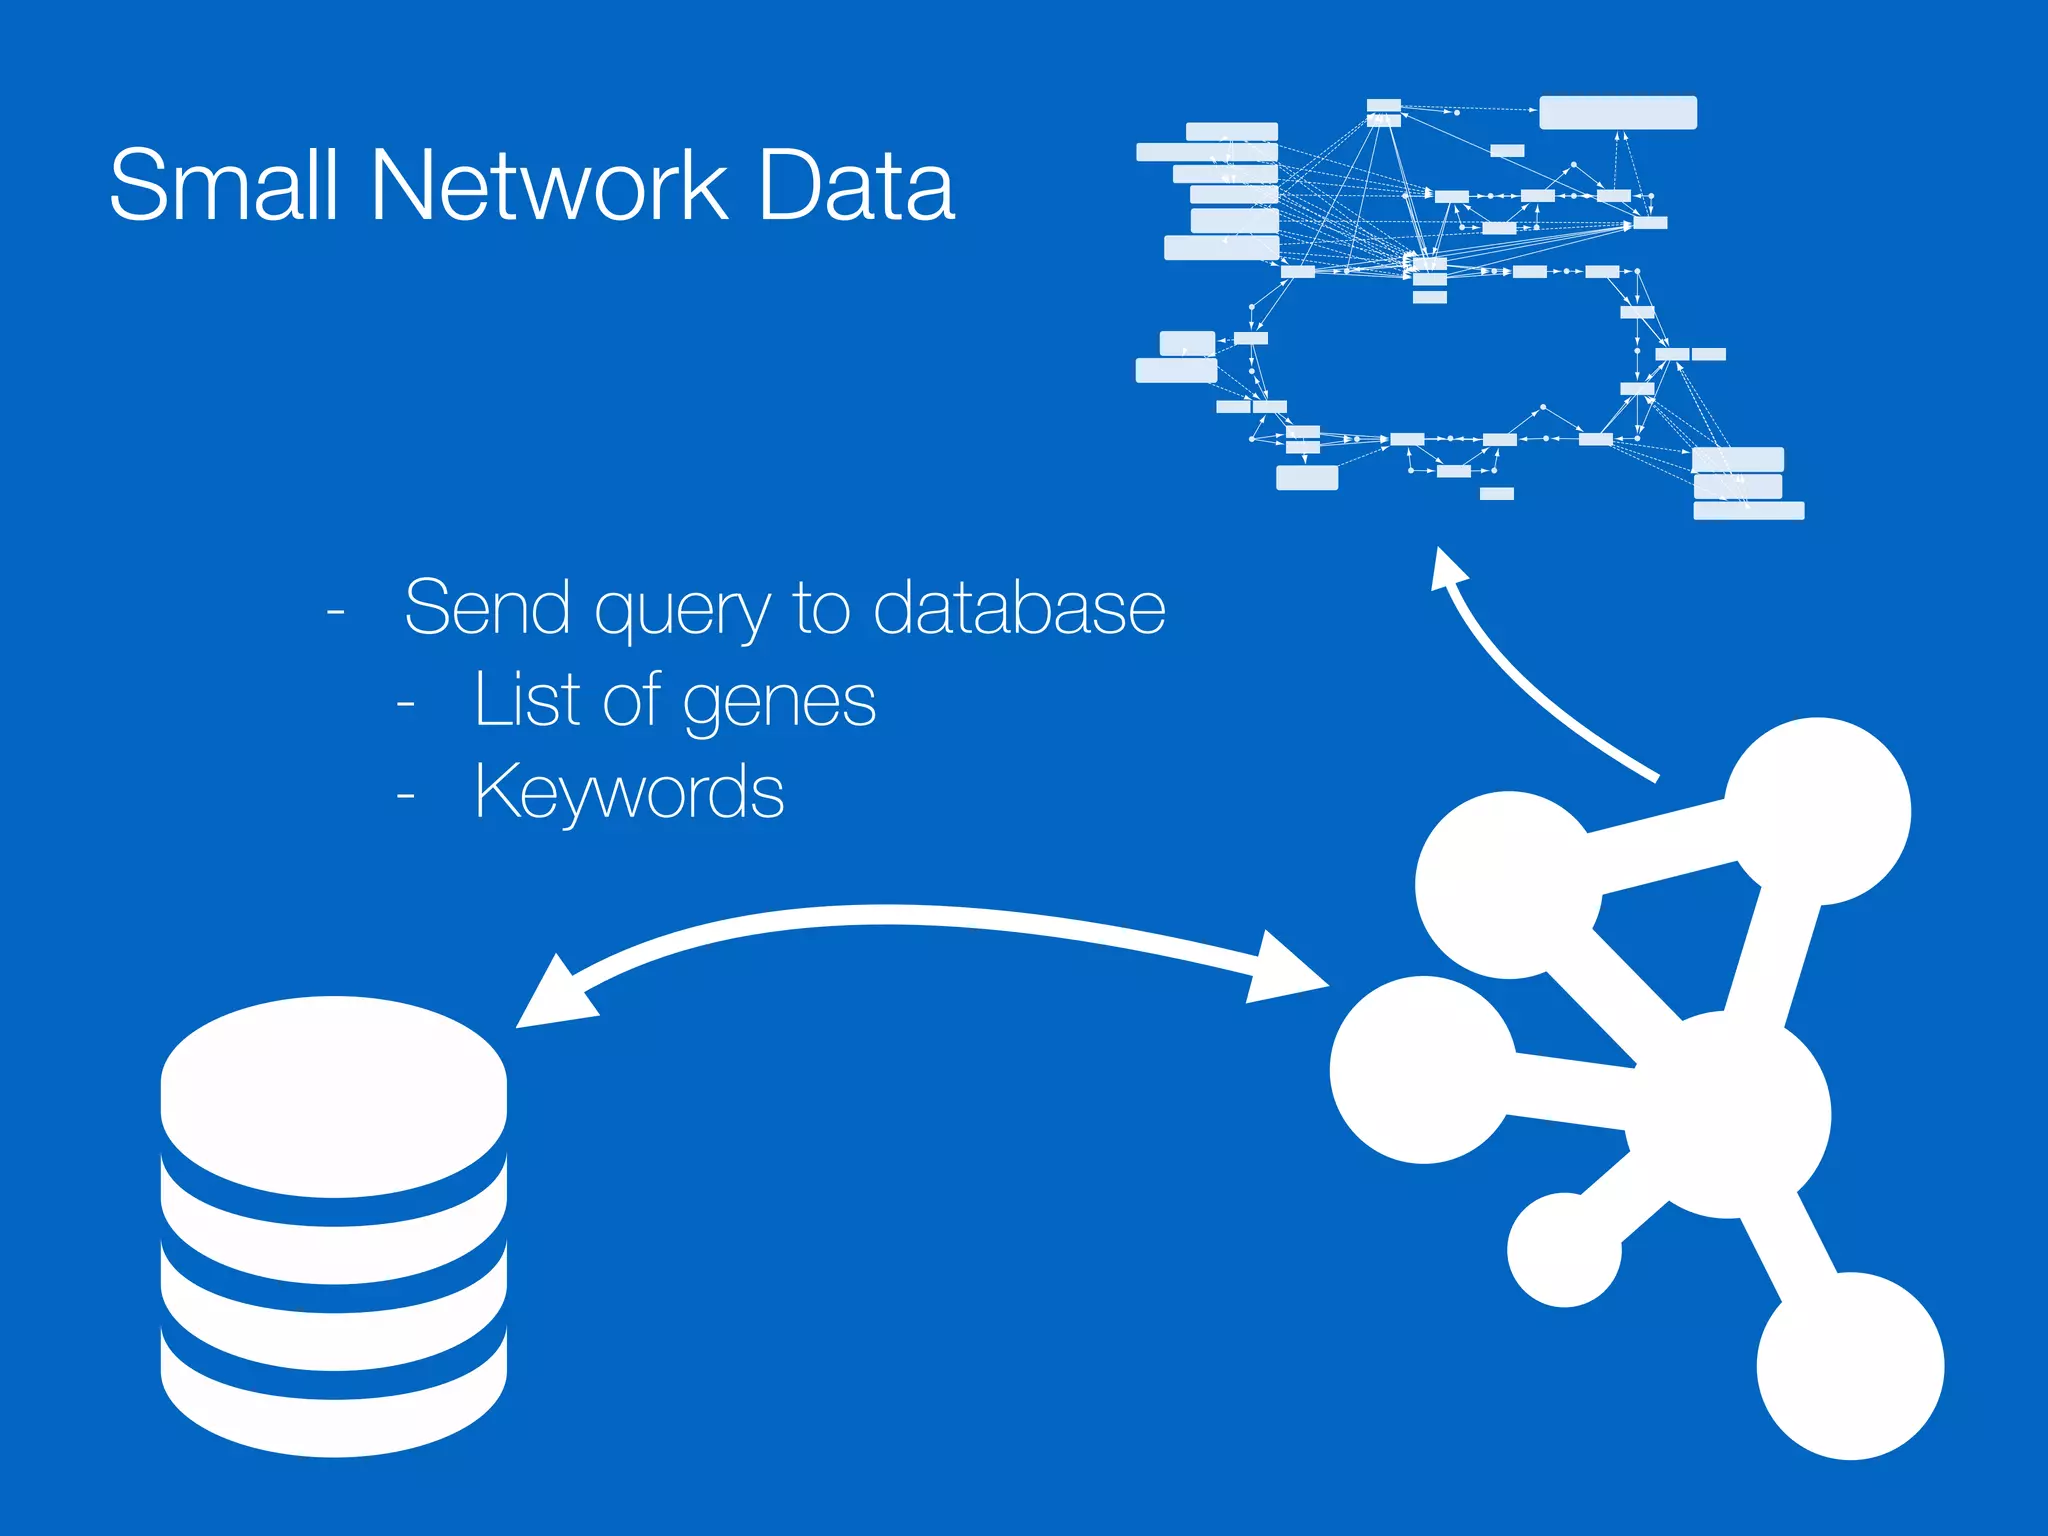
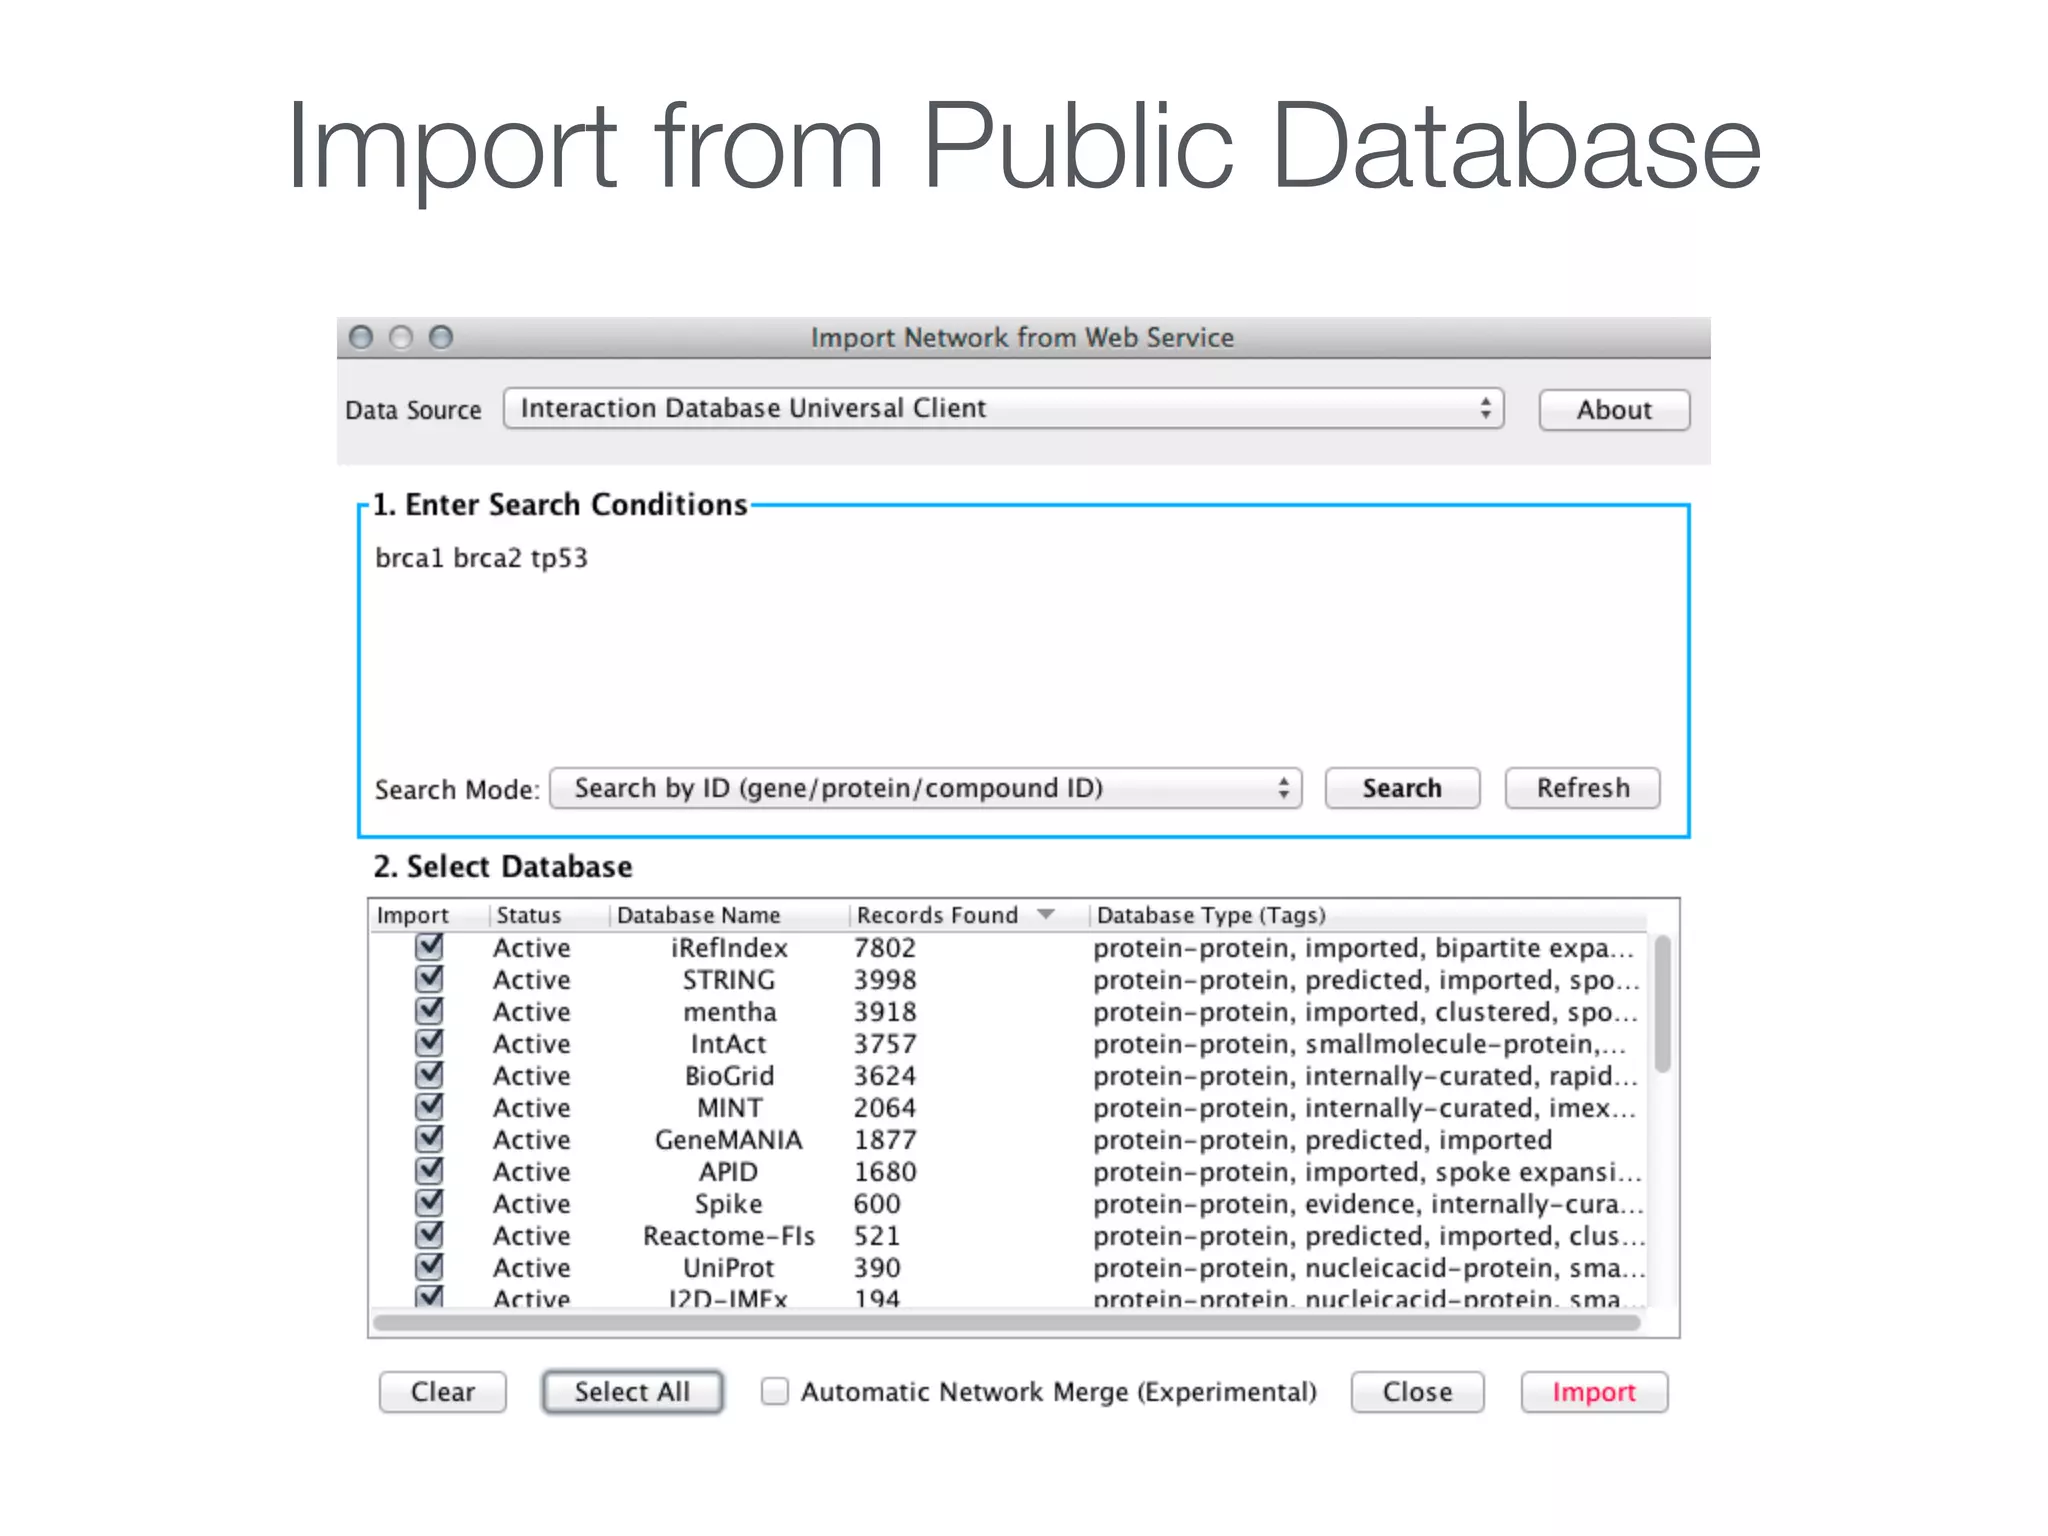
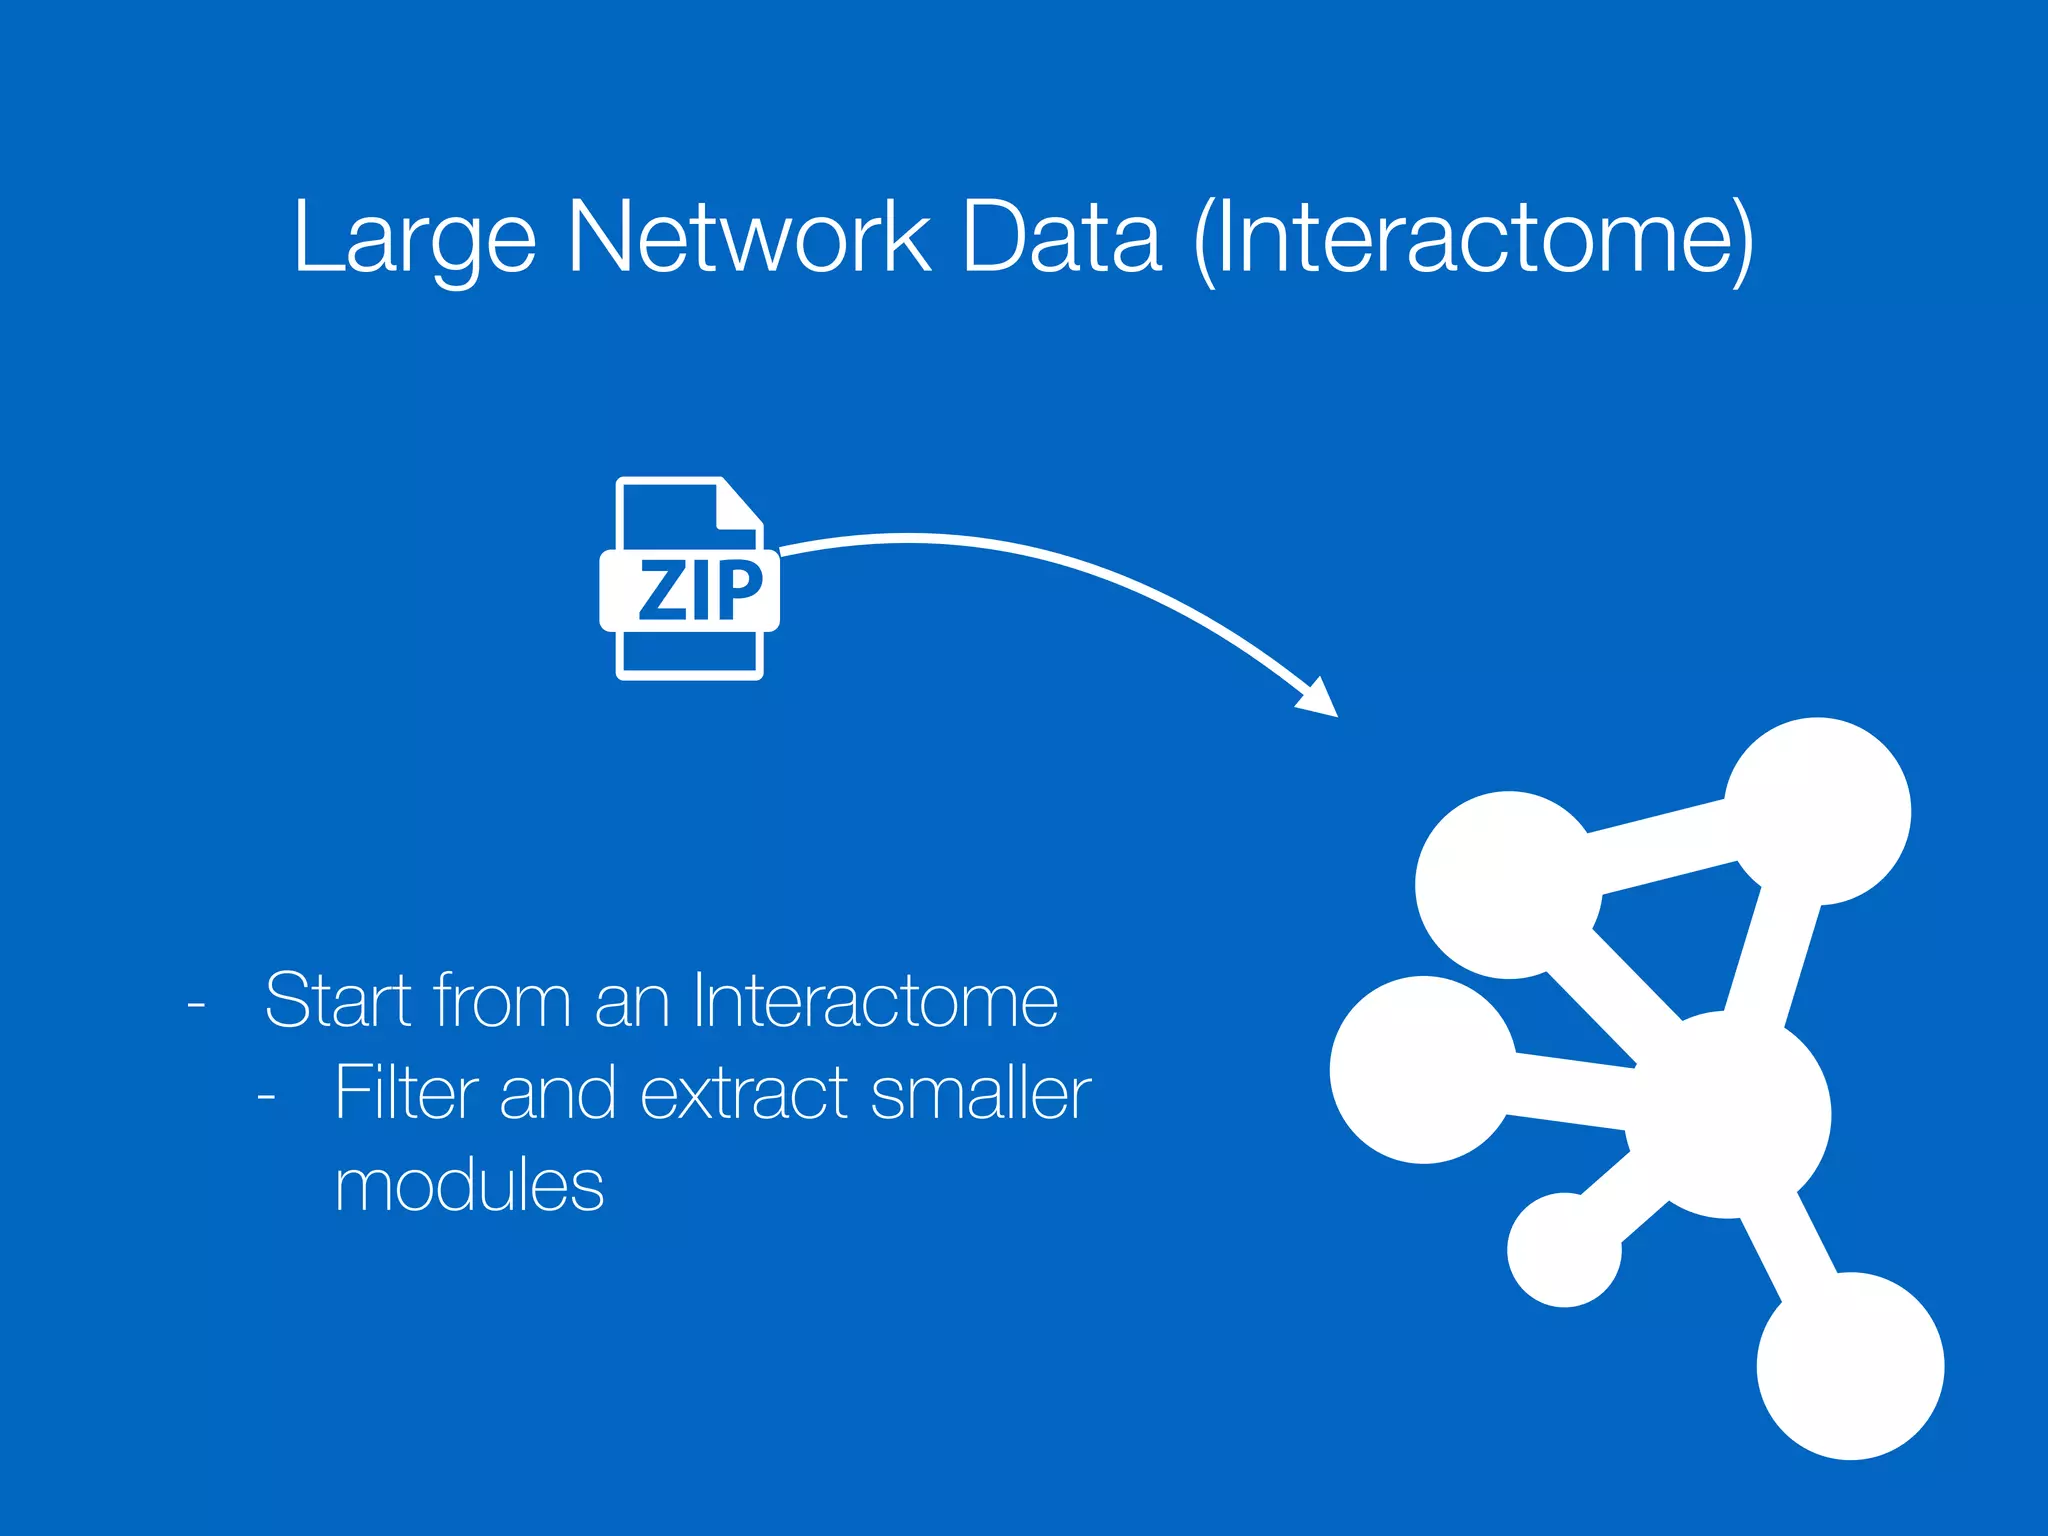
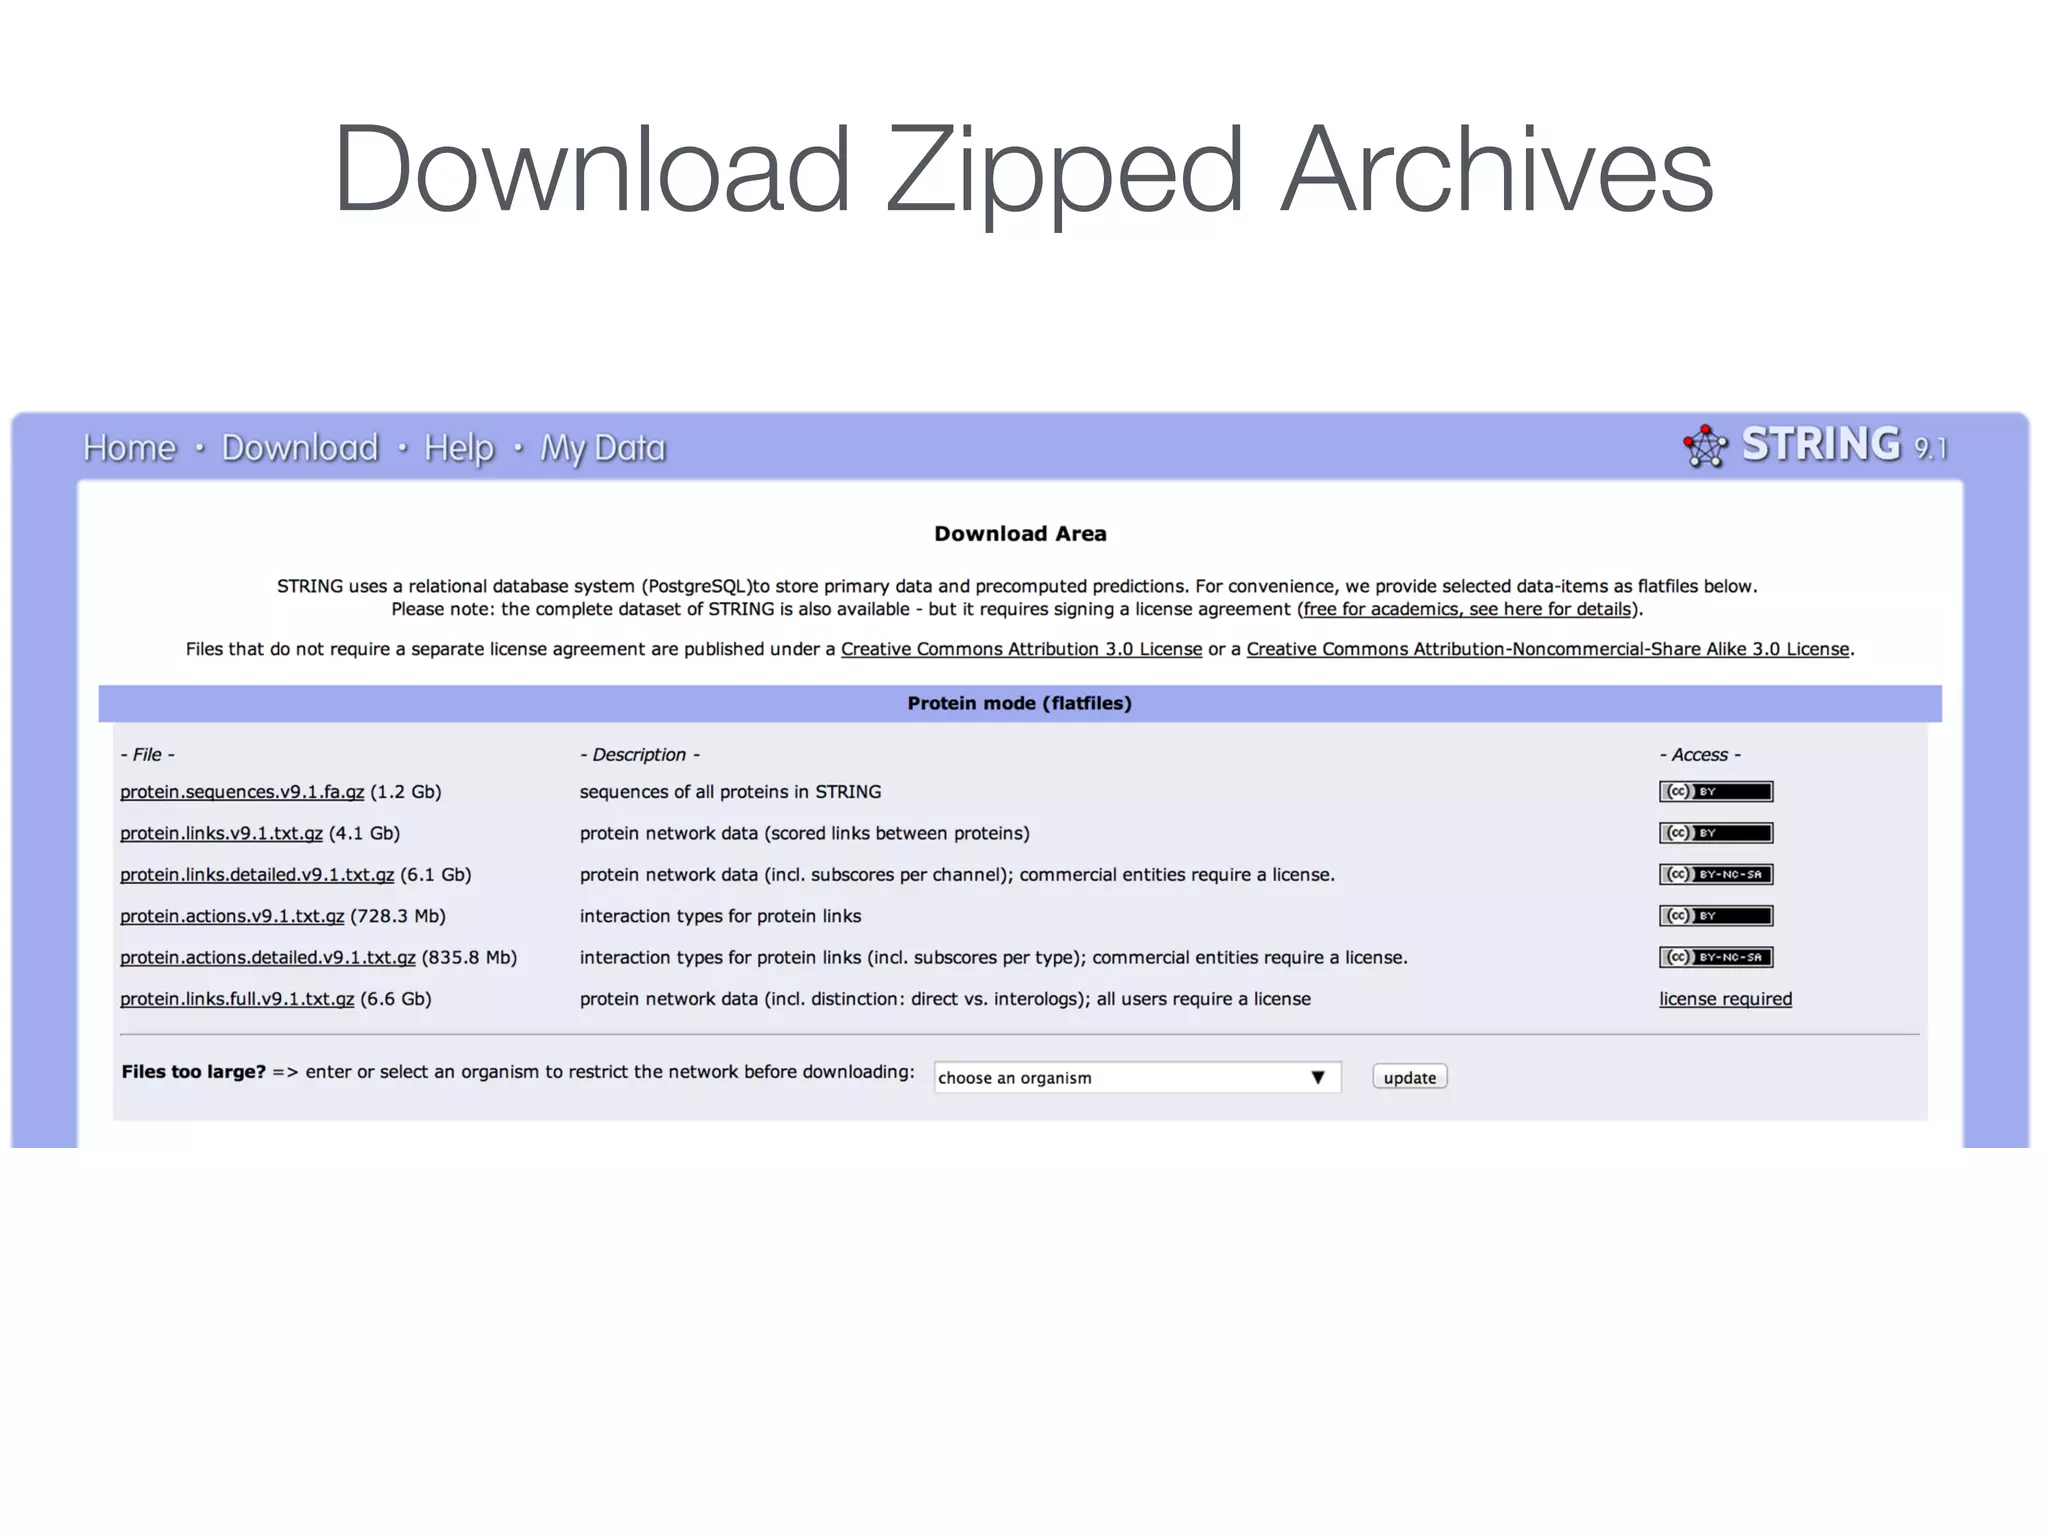
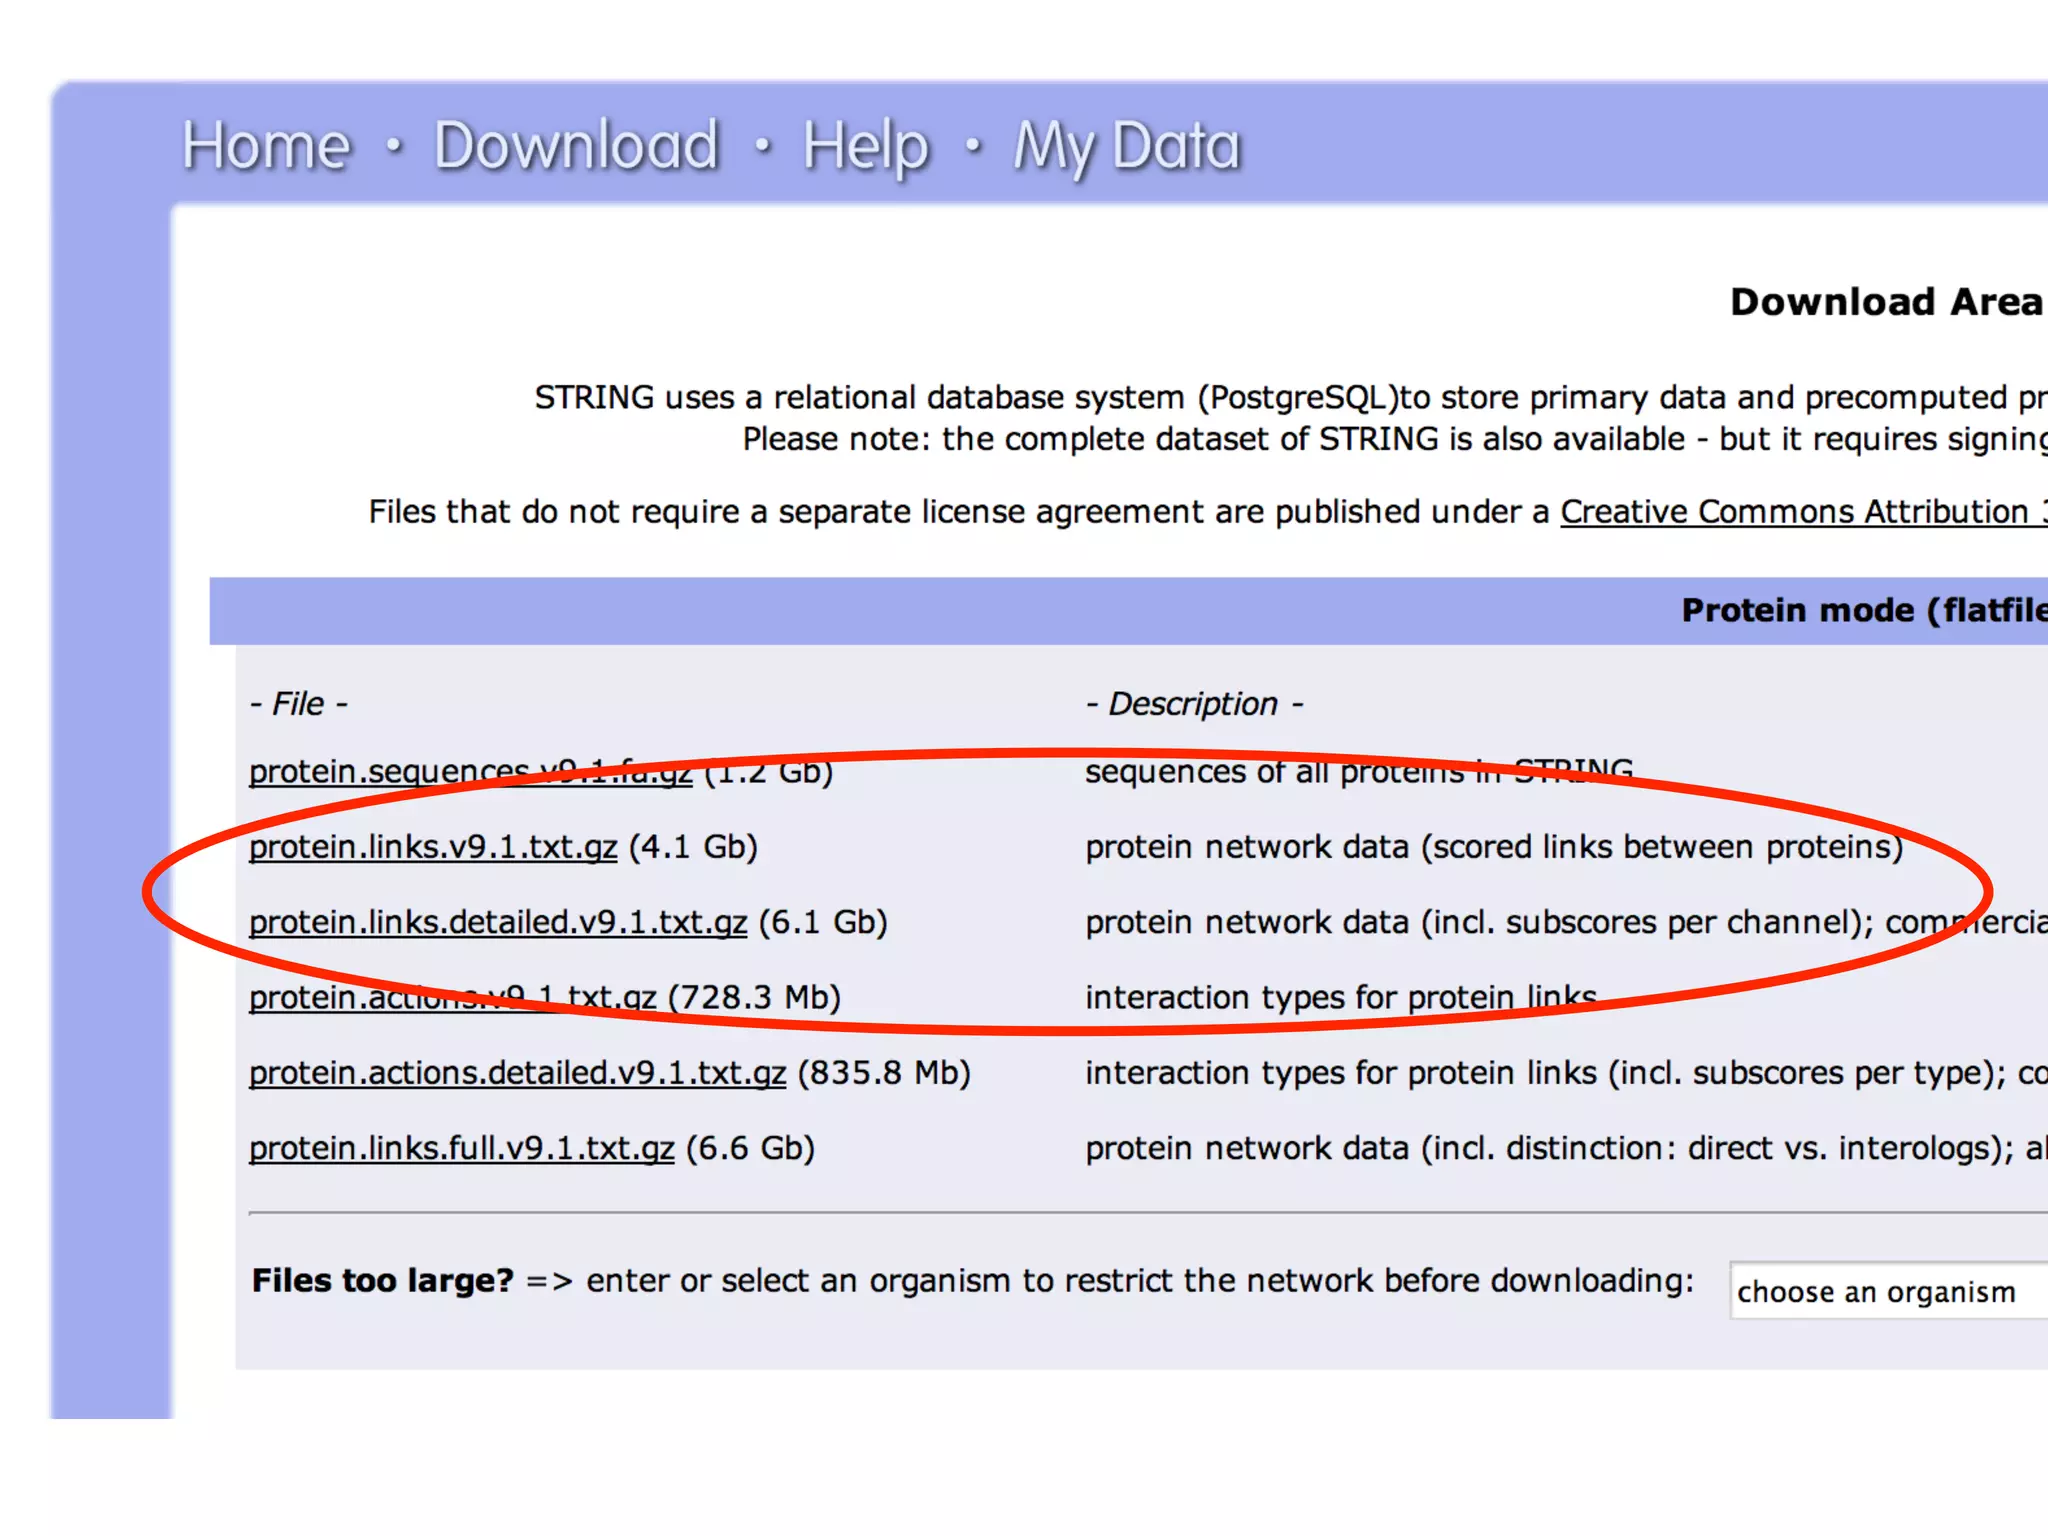
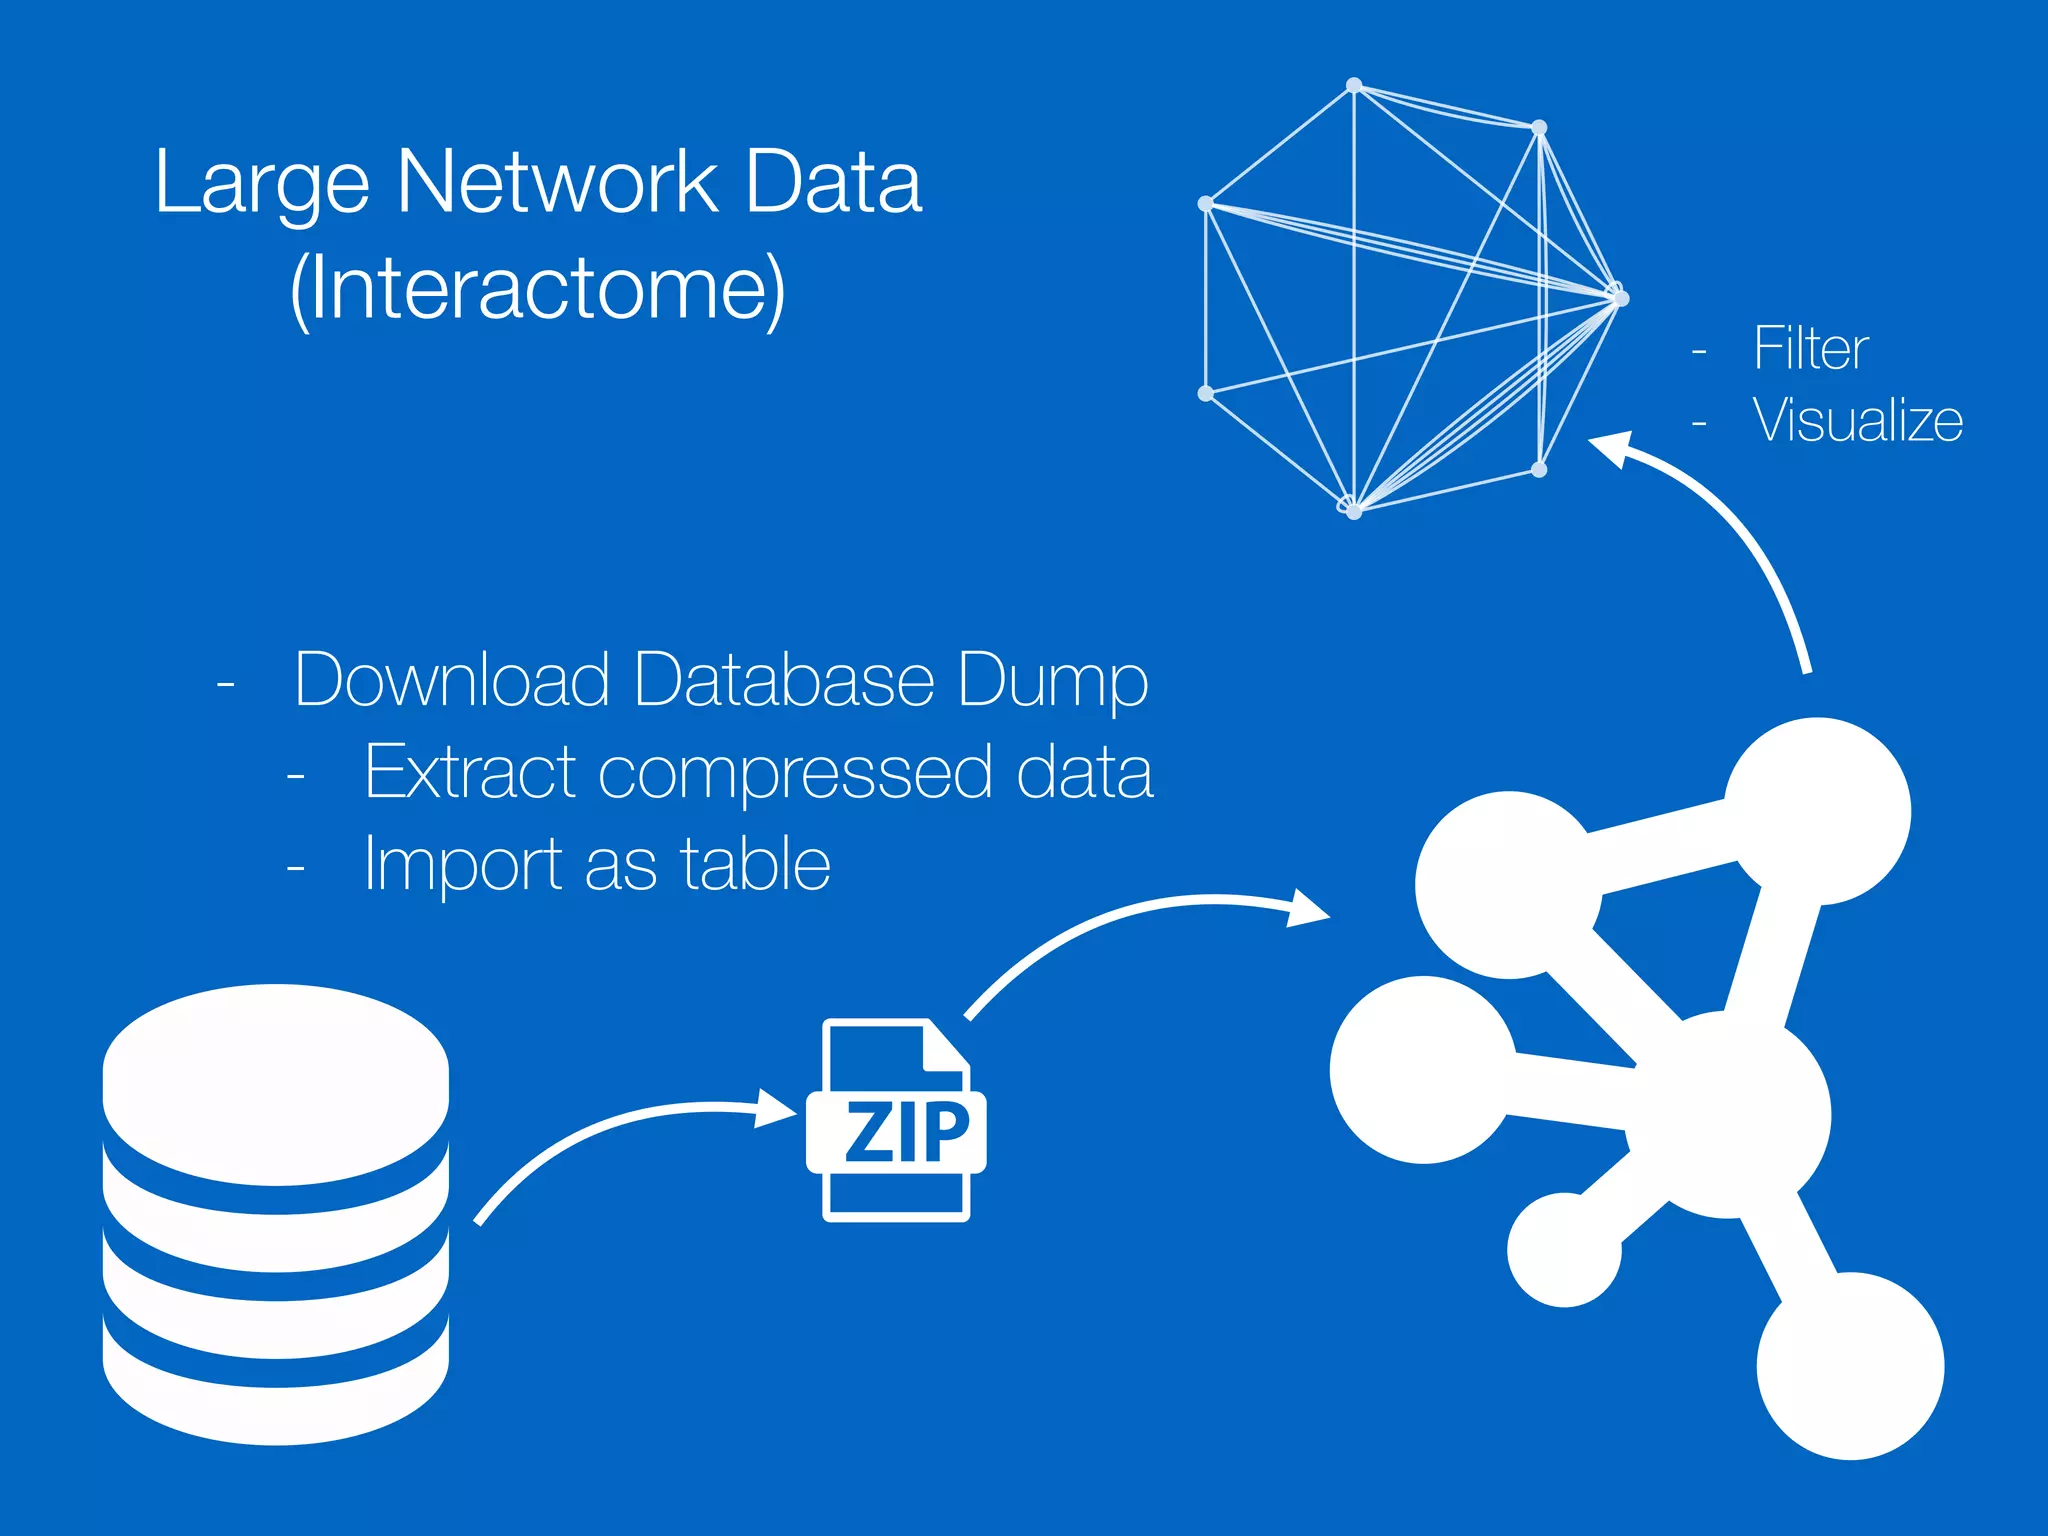
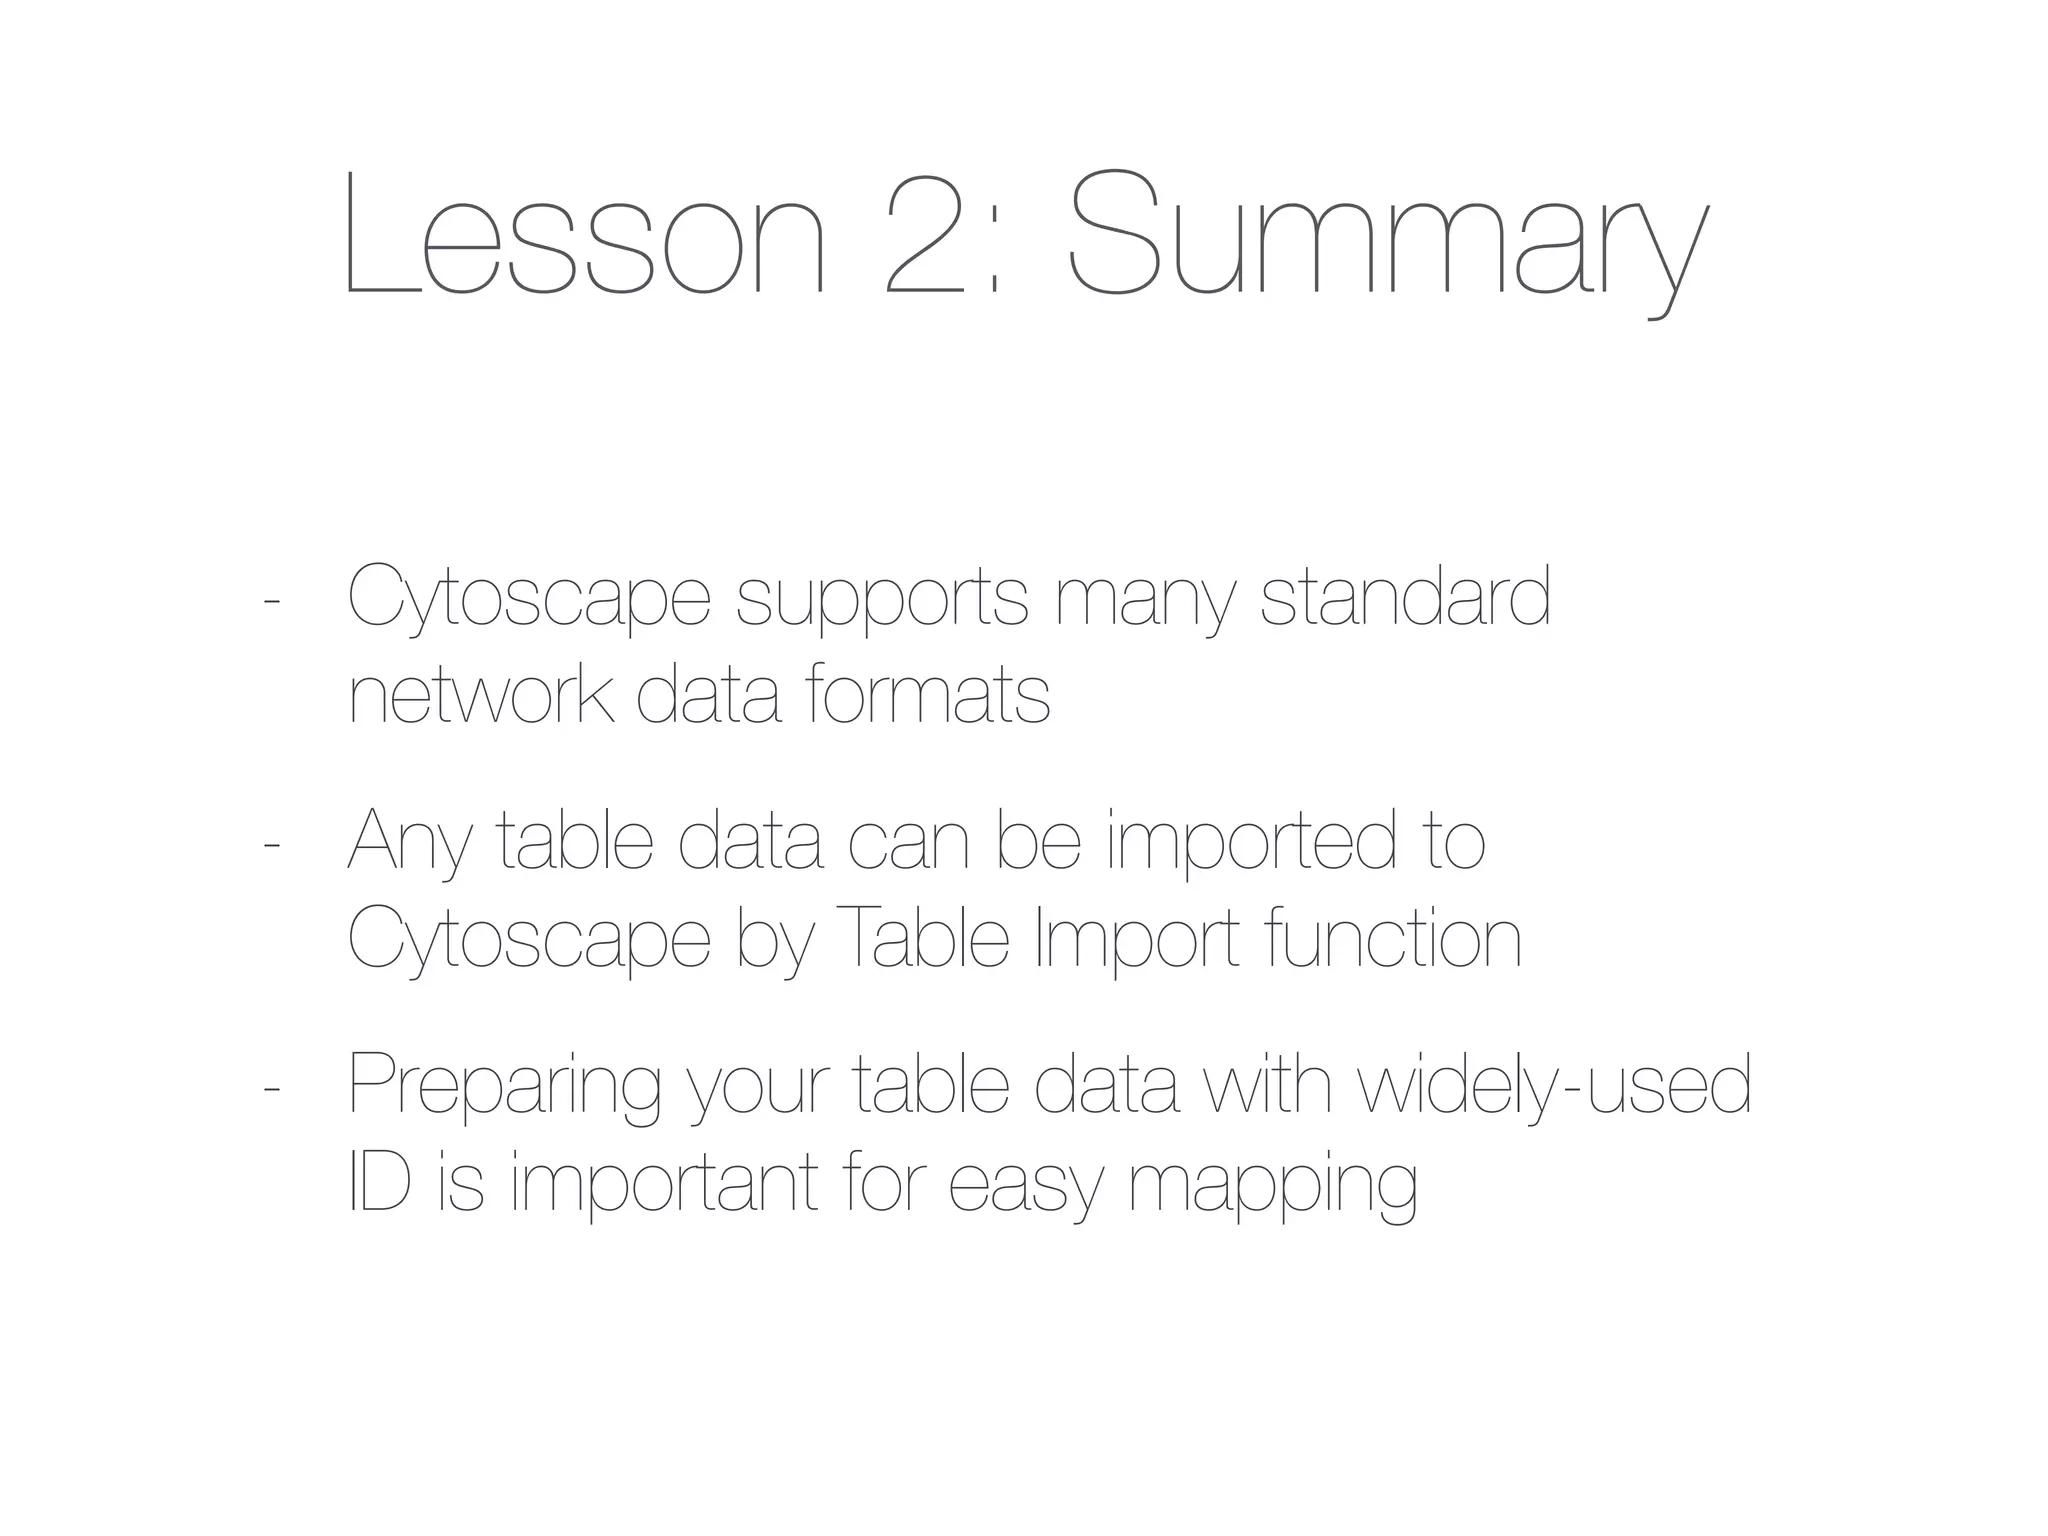
Methods for importing data into Cytoscape, including network data formats and importance of data preparation.
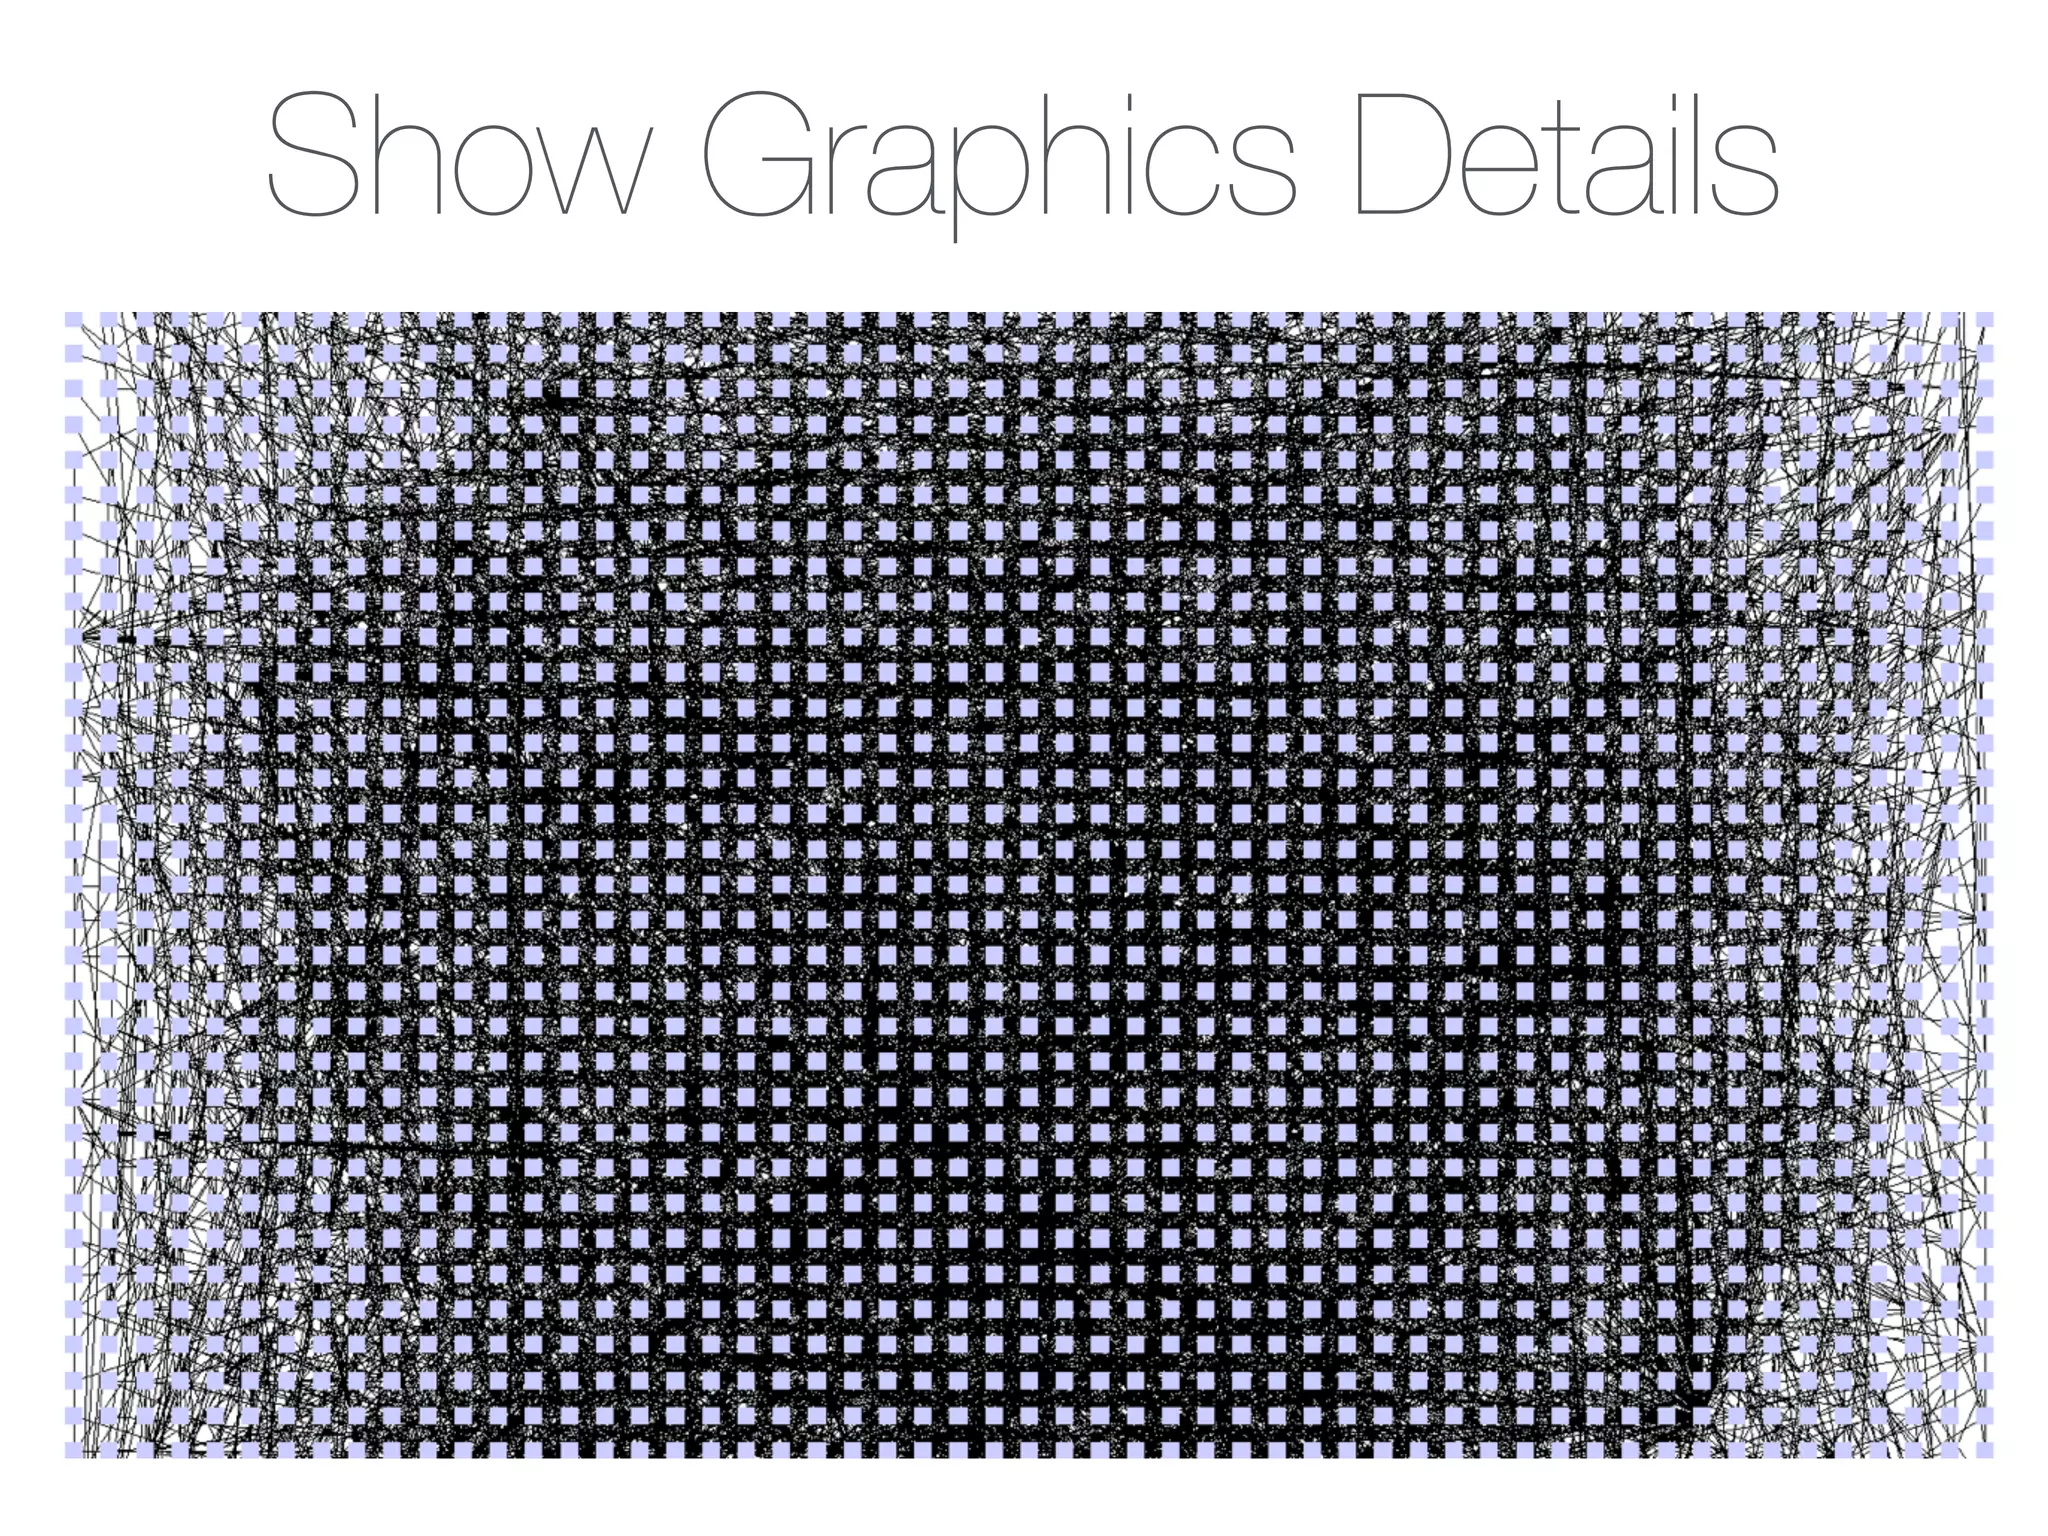
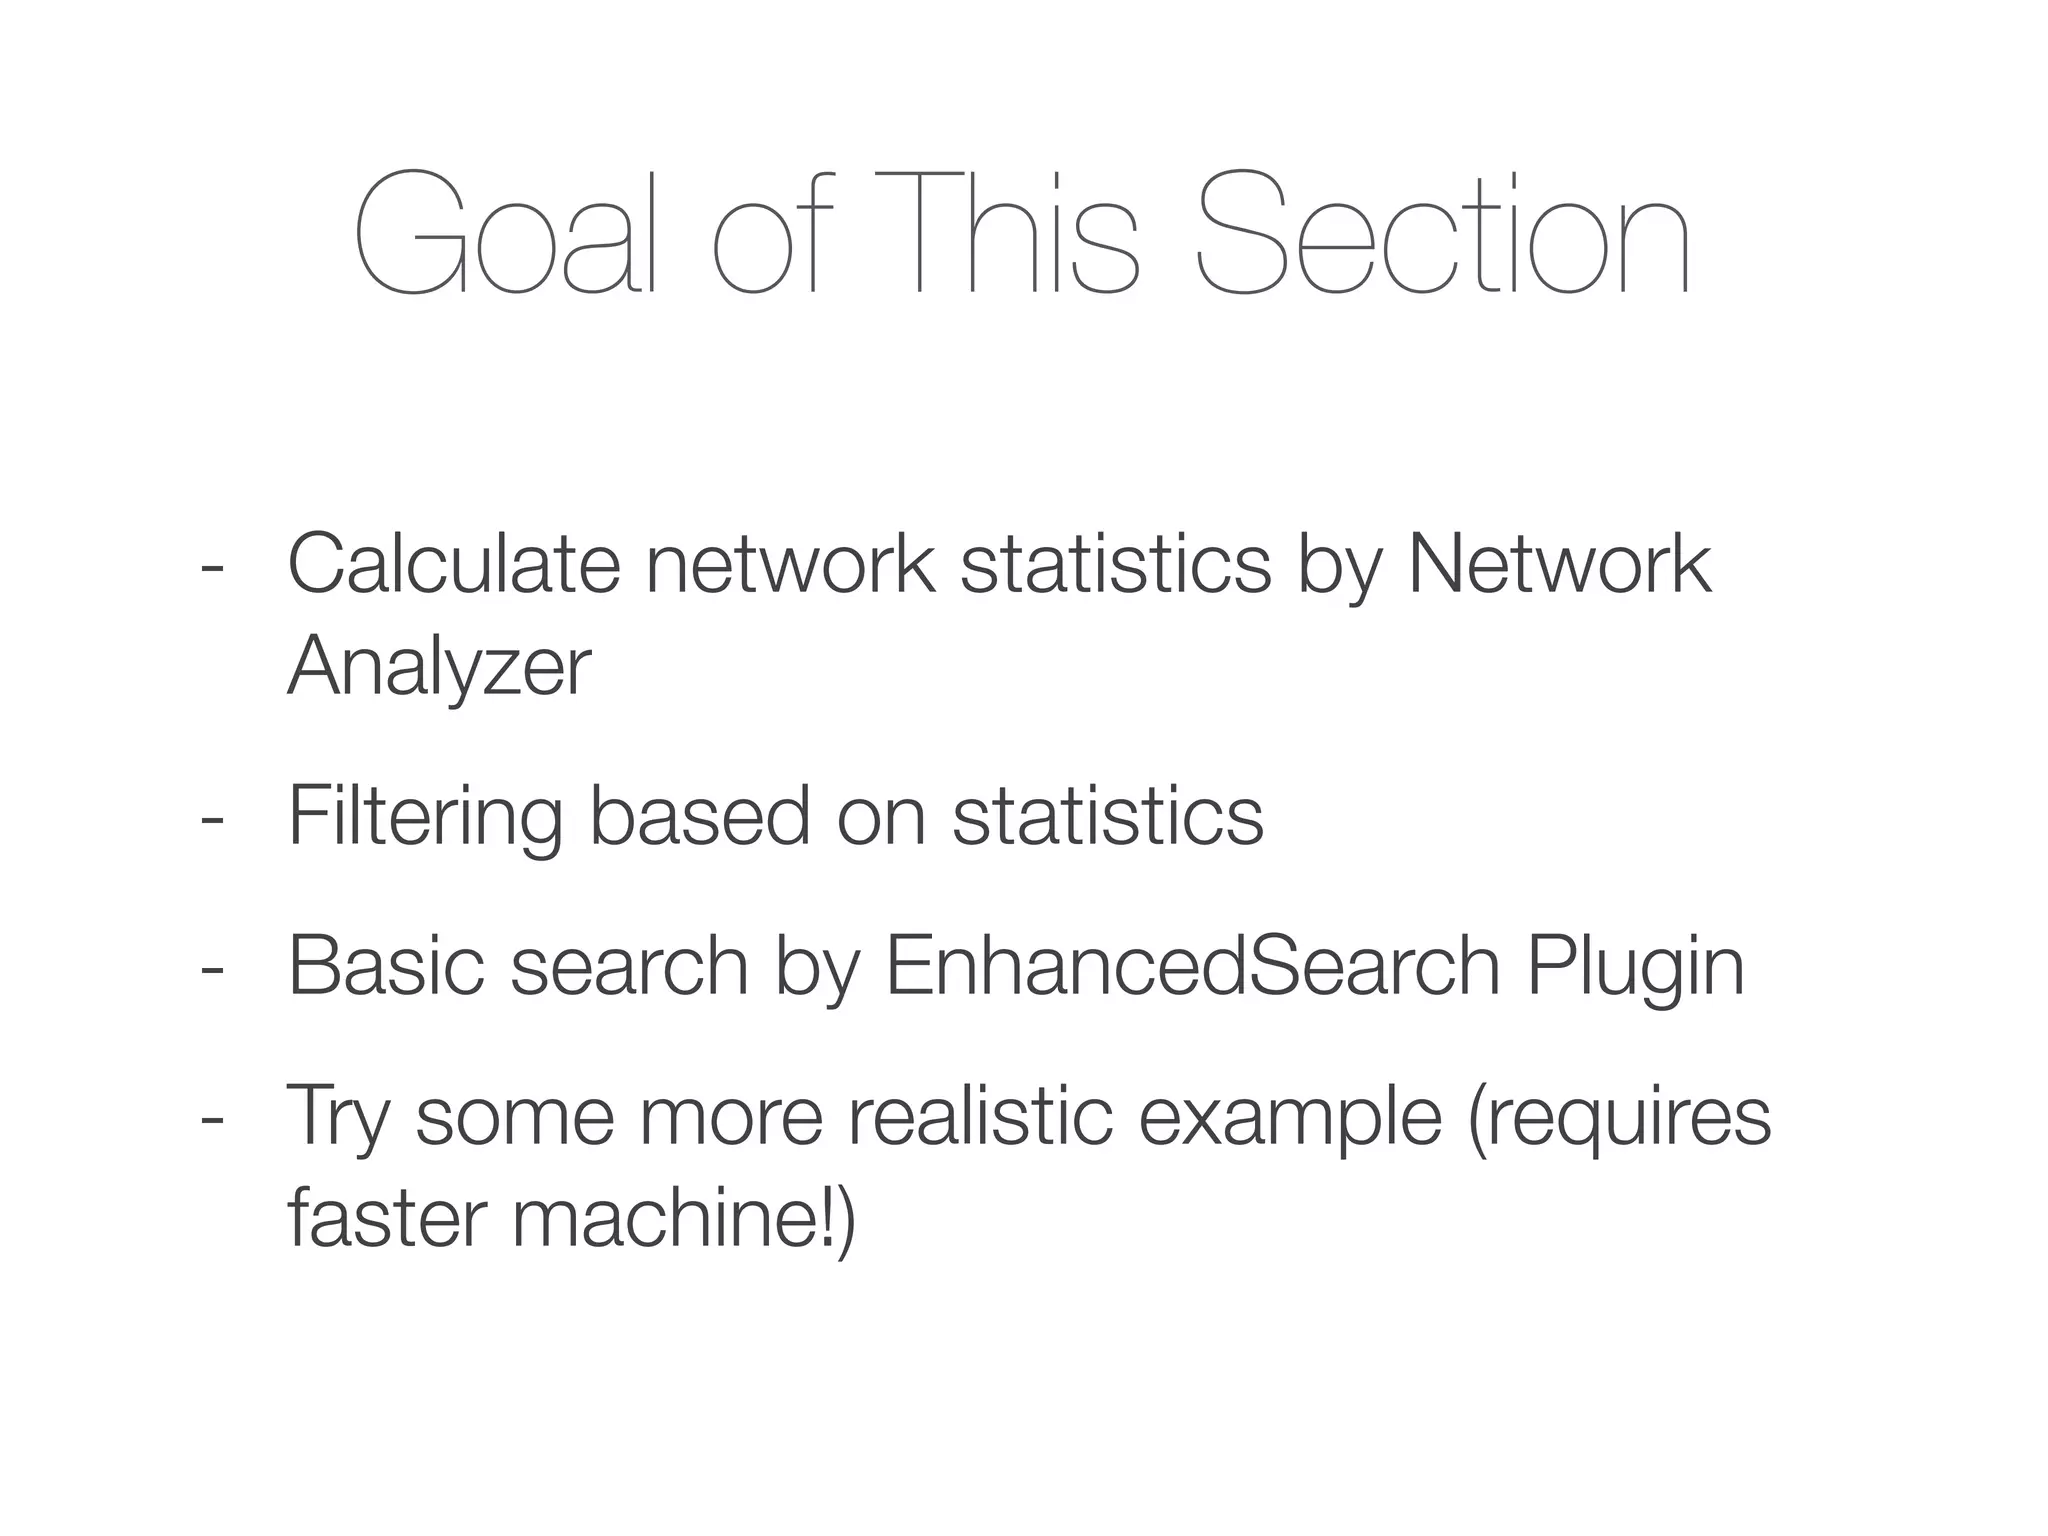
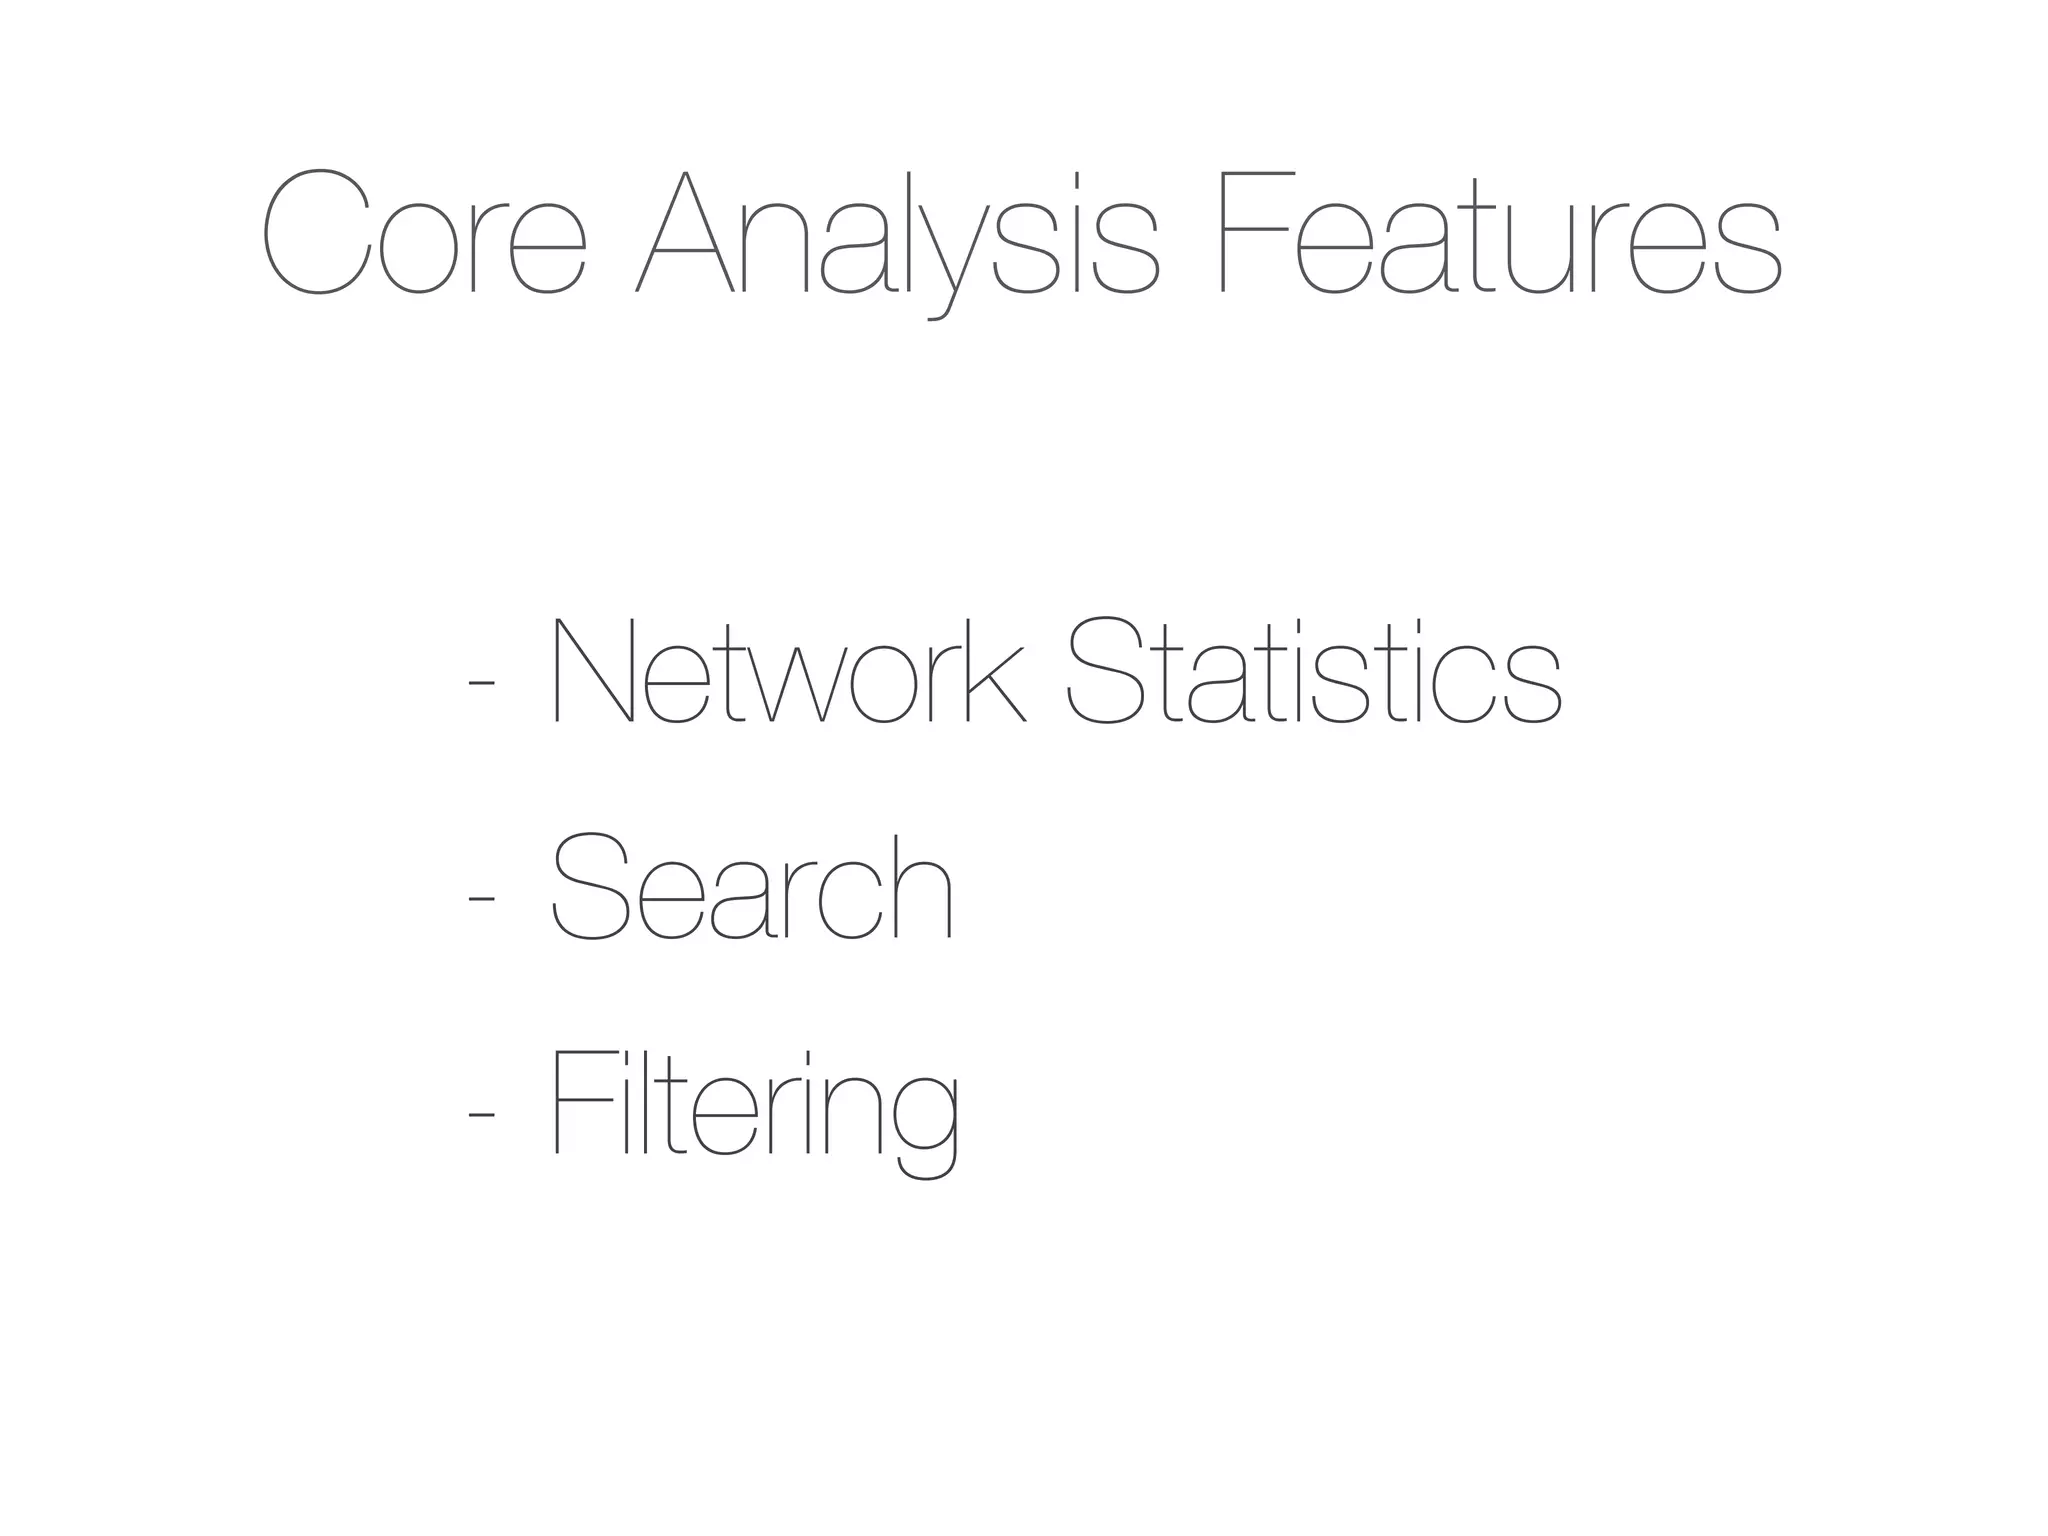
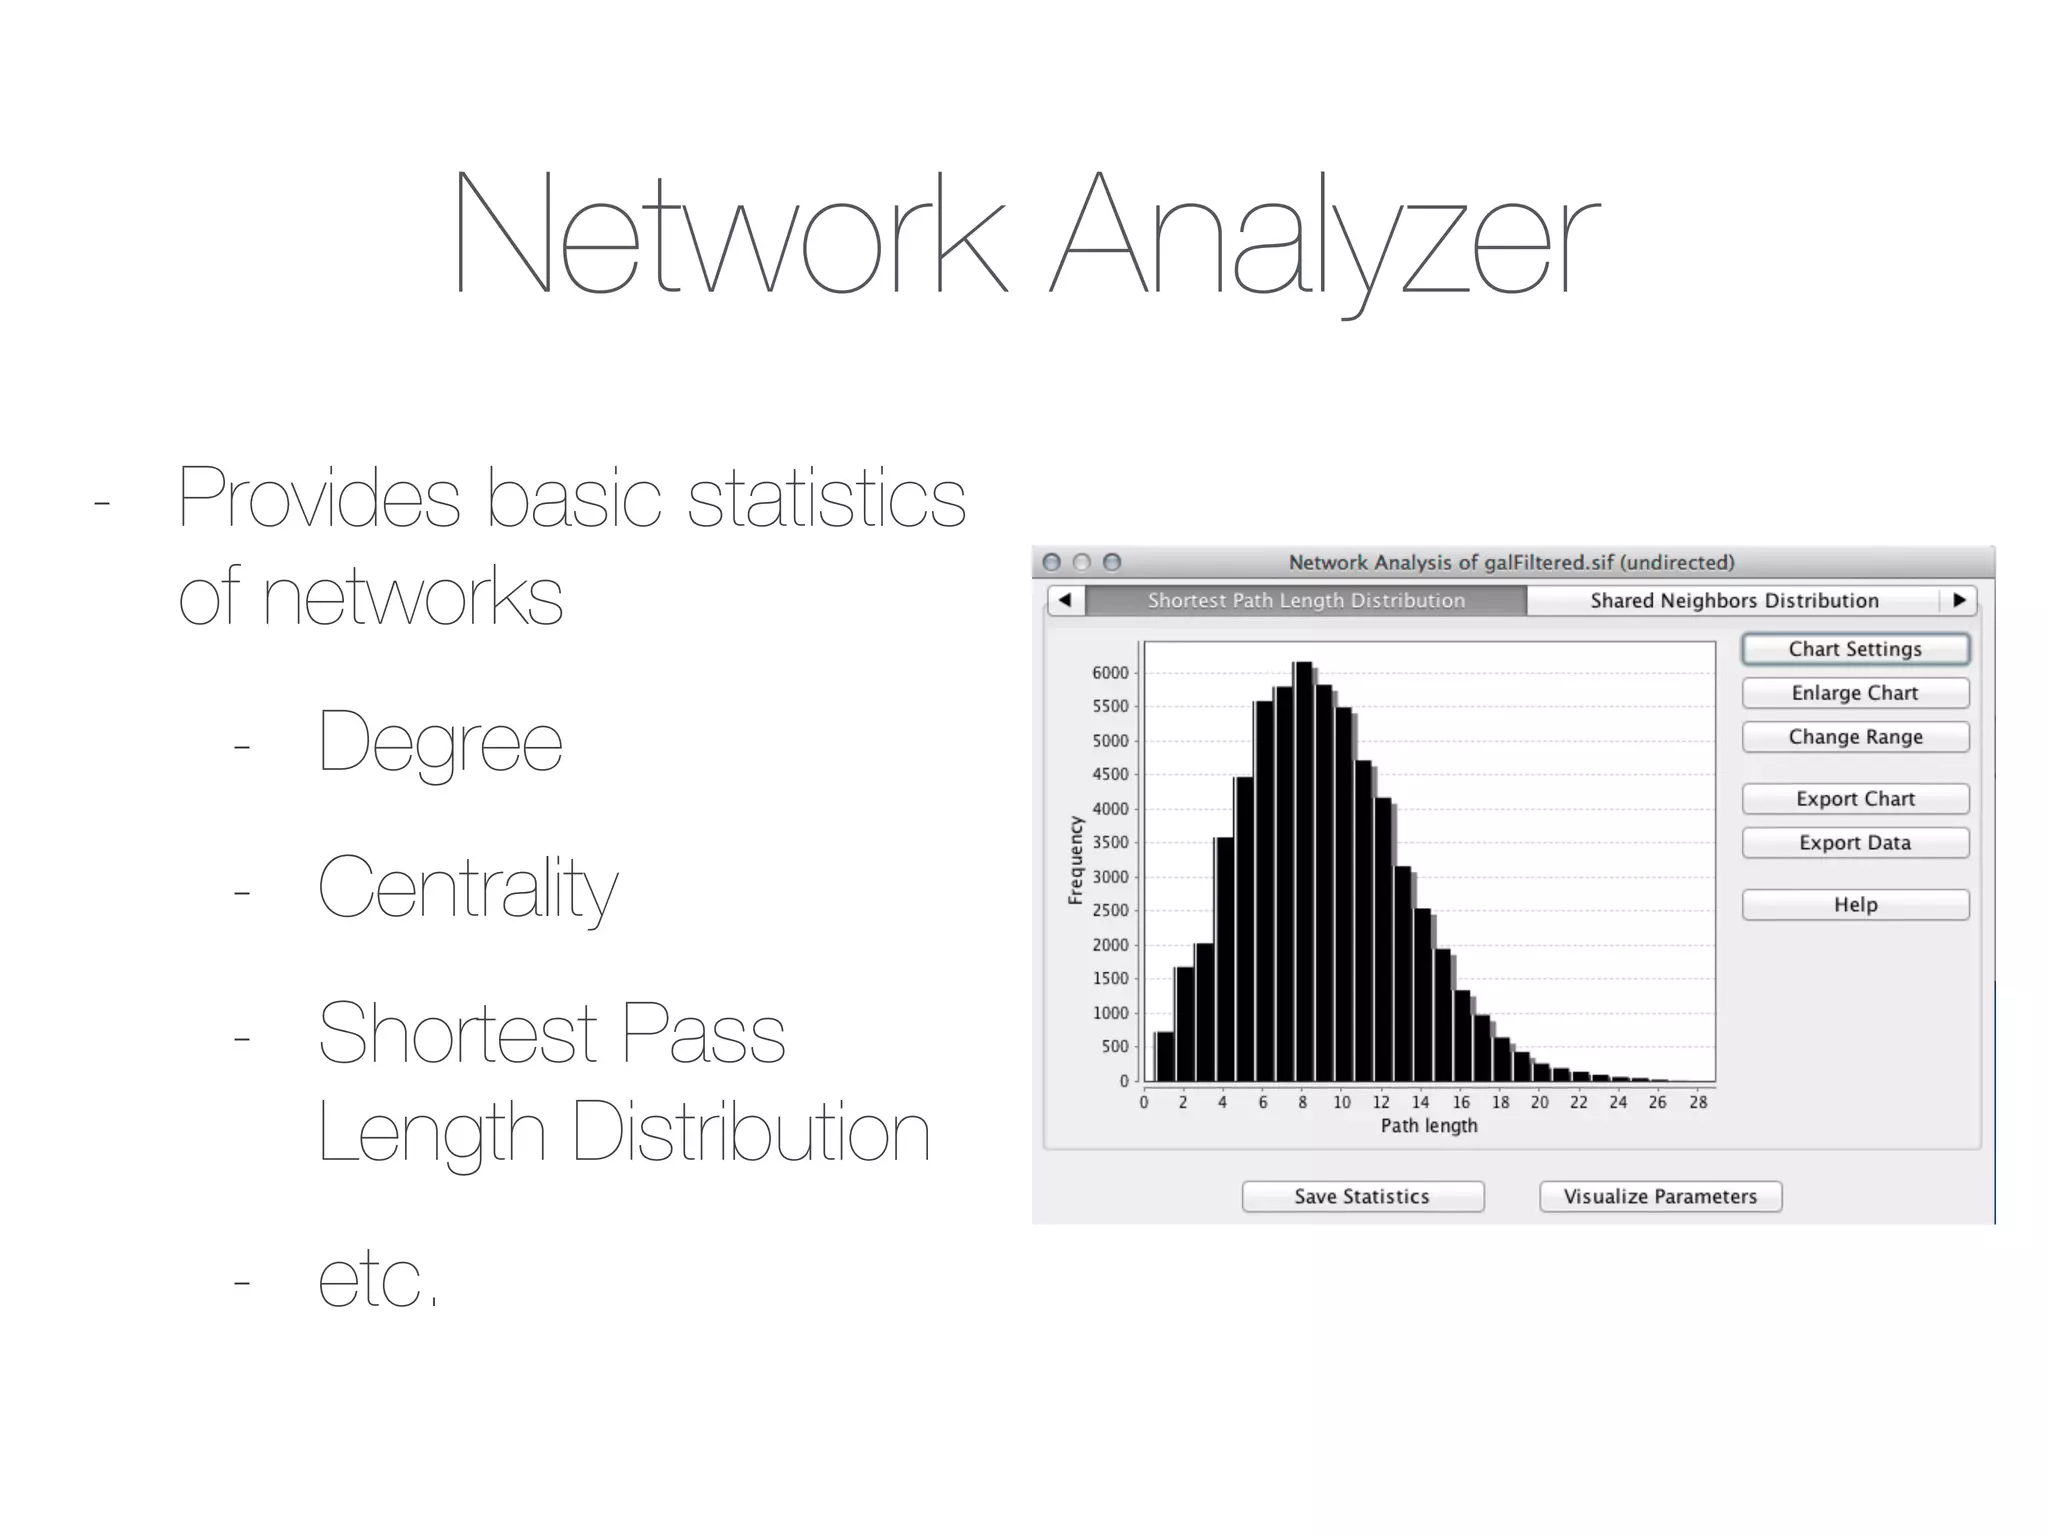
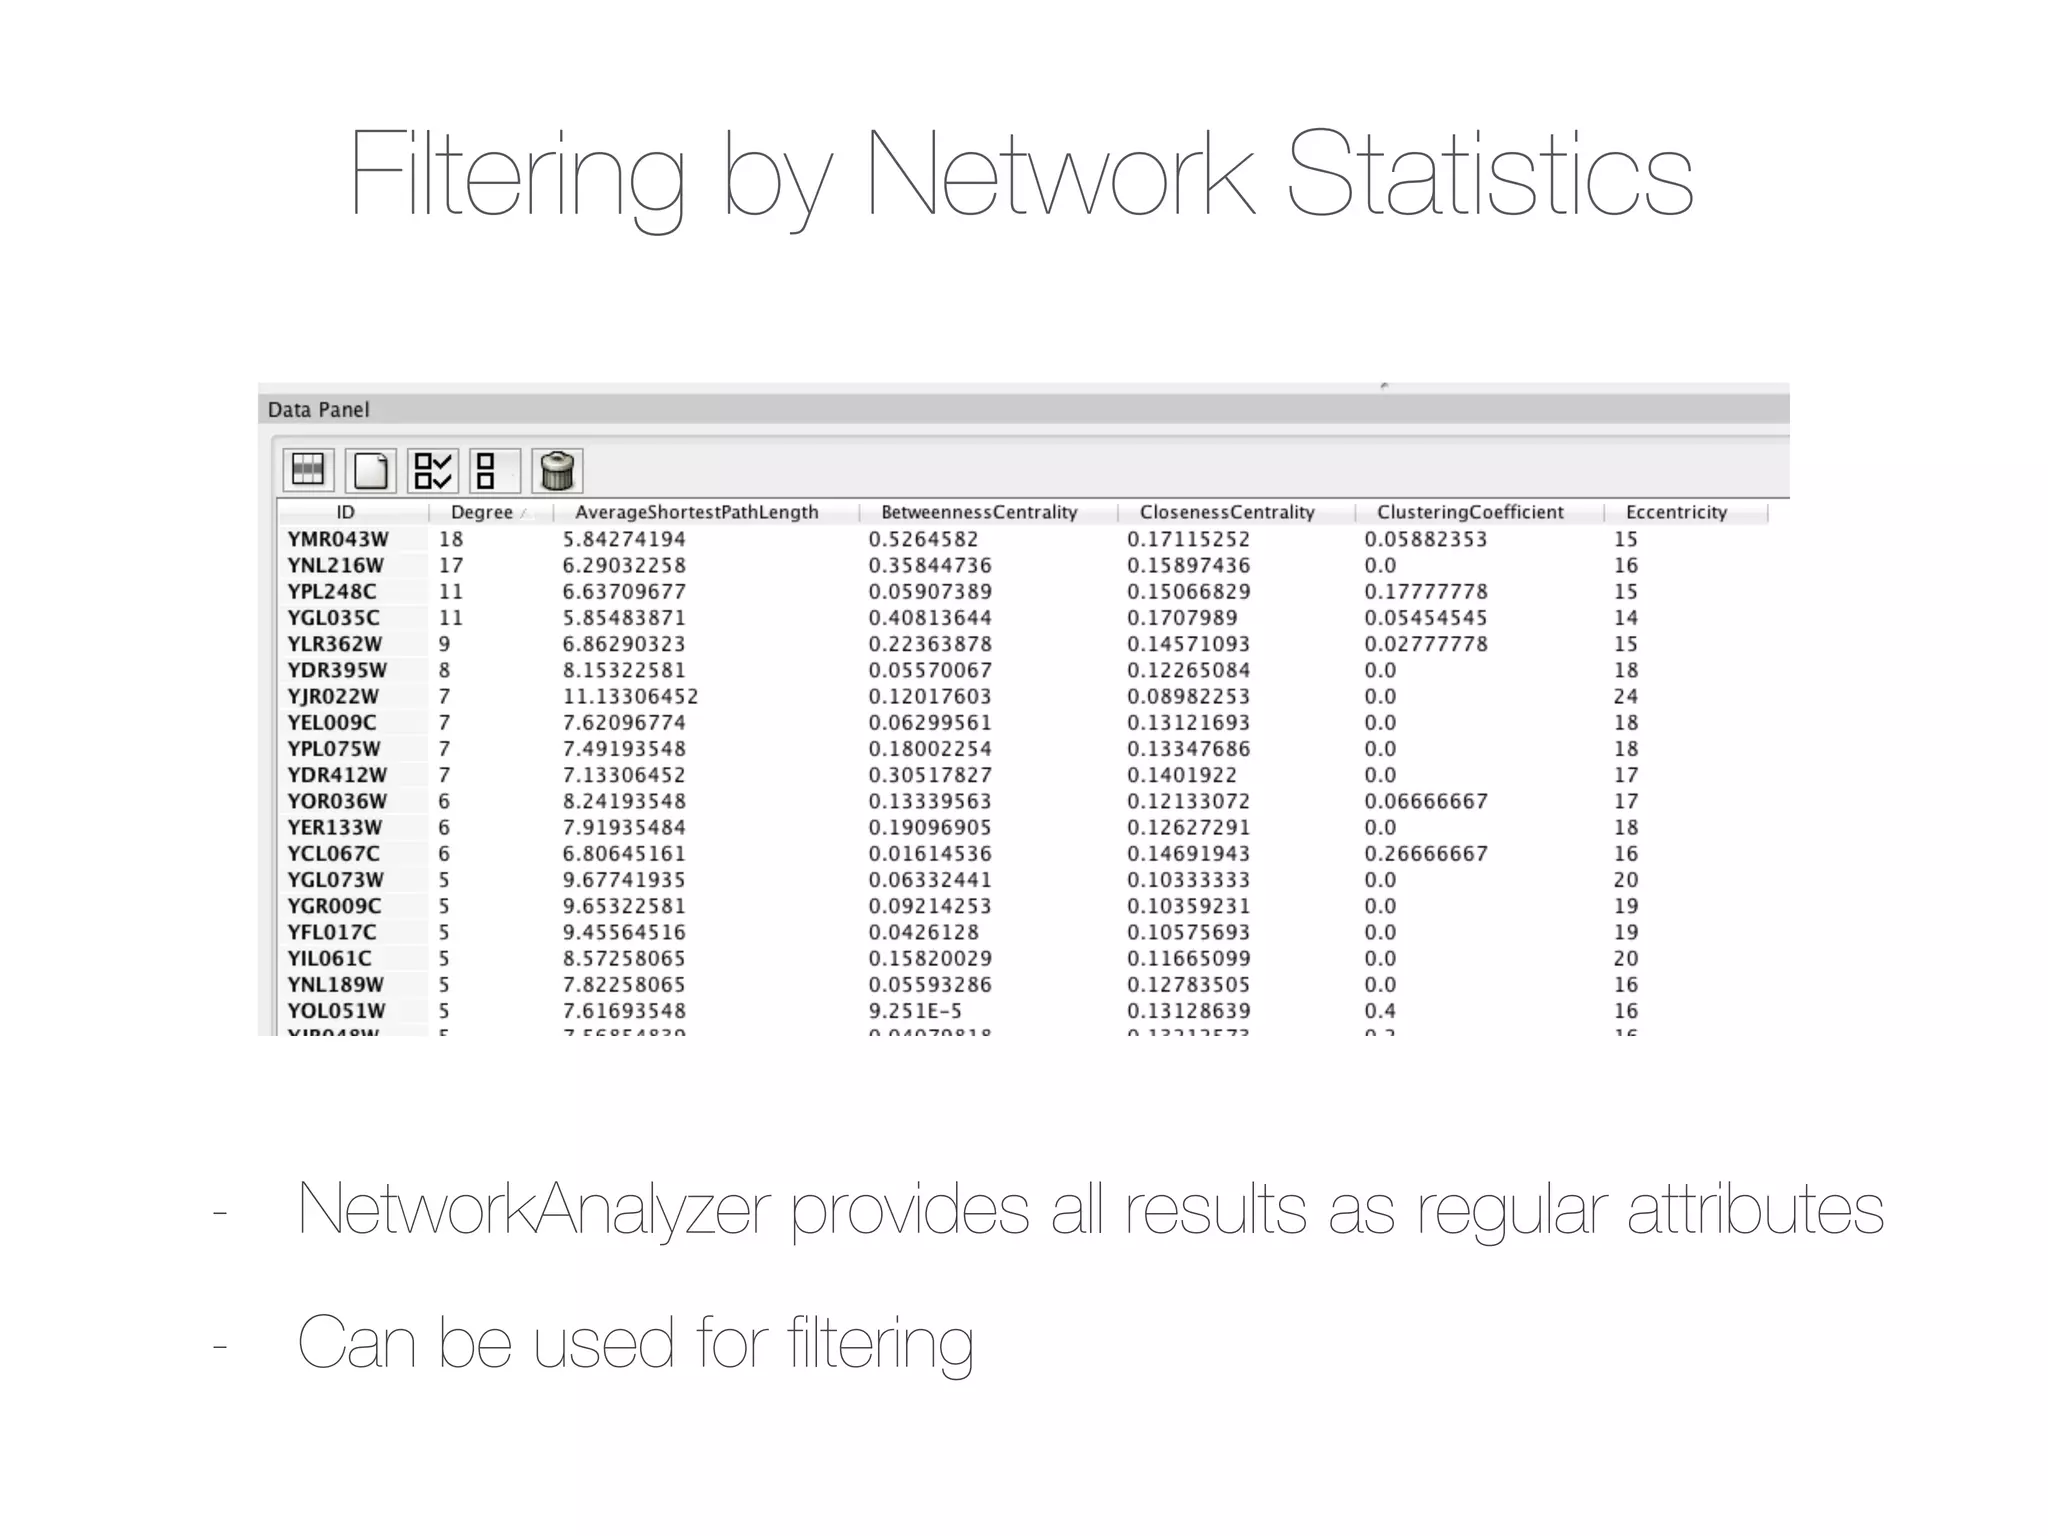
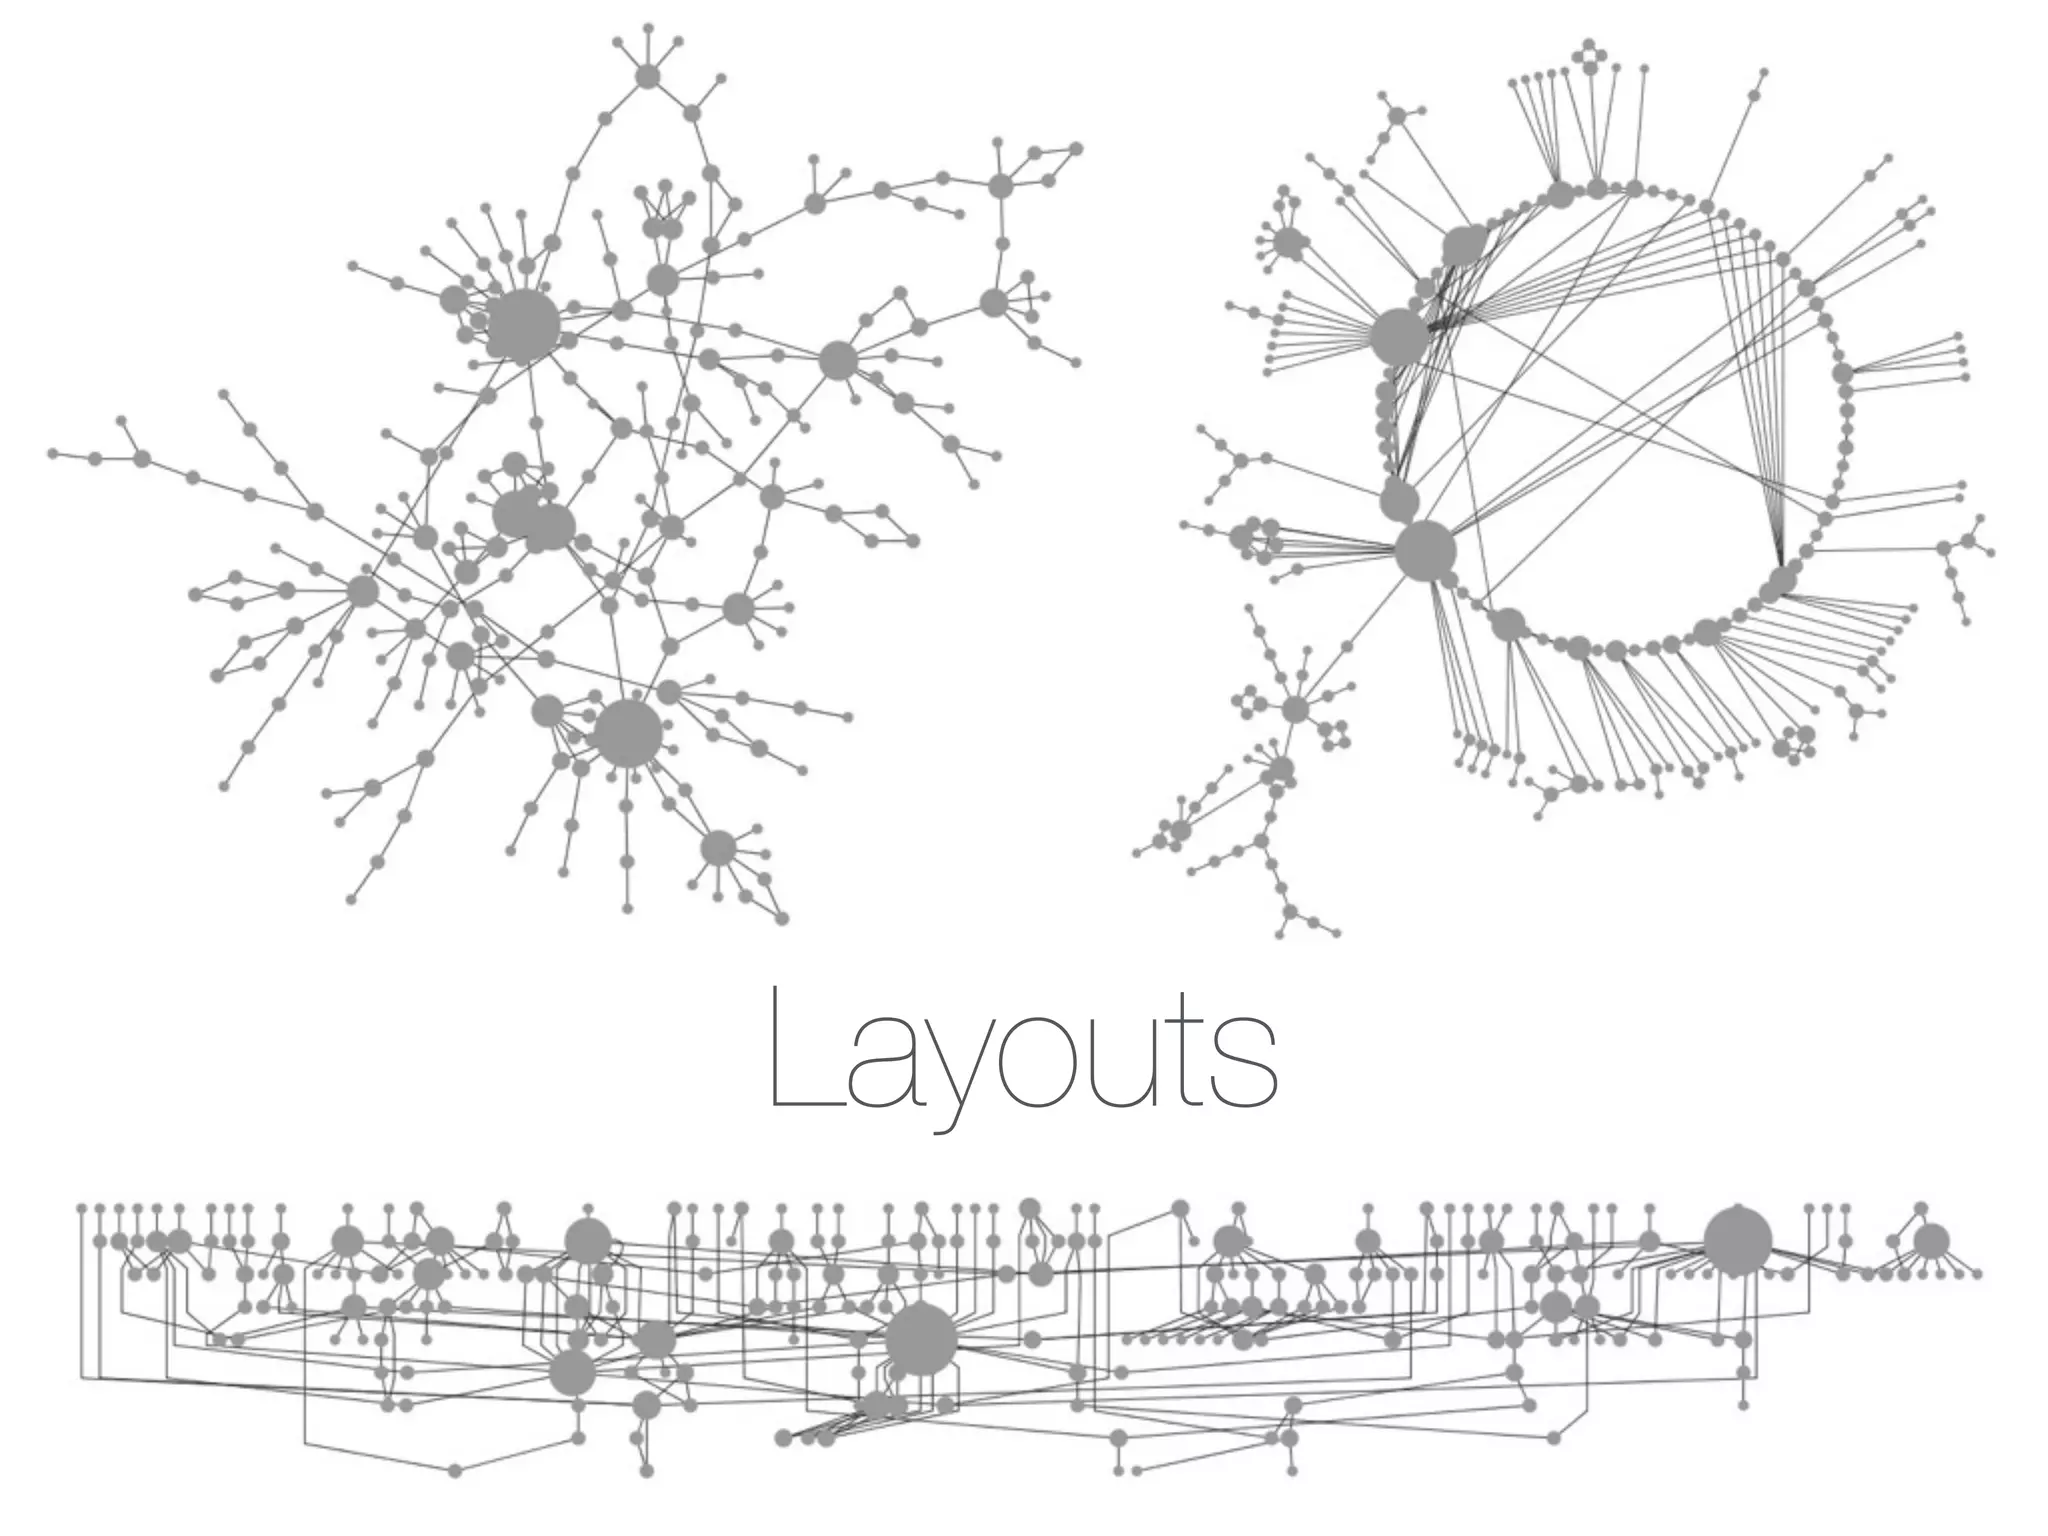
Introduction to basic analysis features, including network statistics and filtering using the Network Analyzer.Overview of visualization methods, including layout options, visual styles, and application of visualization techniques.
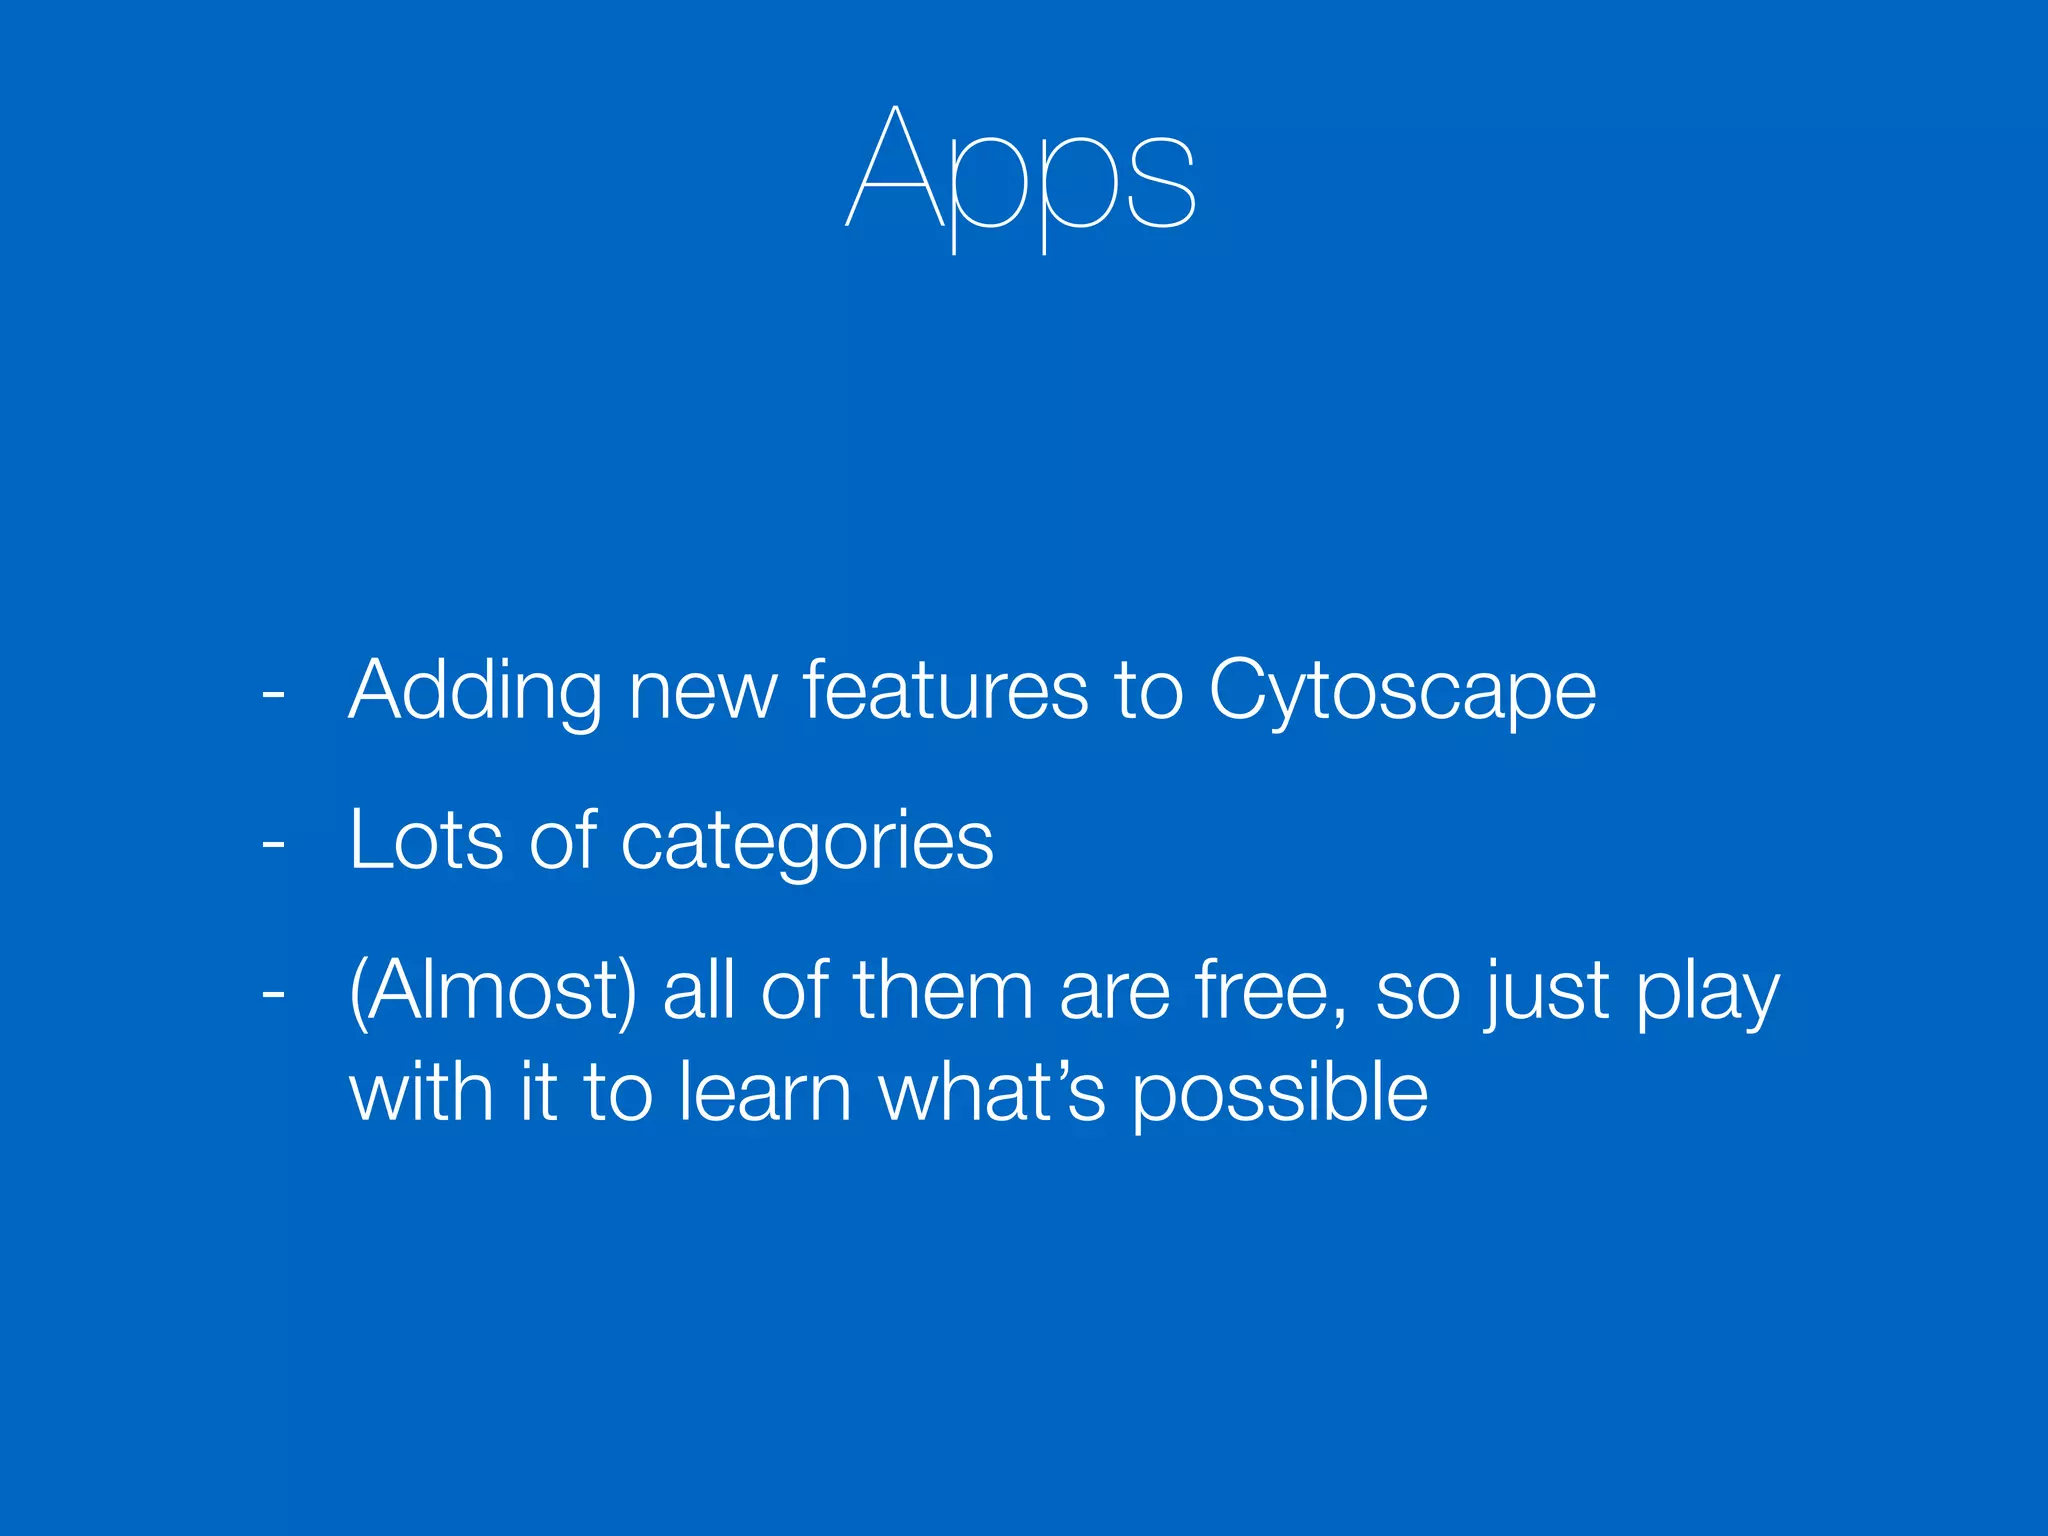
Discusses how to extend Cytoscape's capabilities using apps, including installation and available features.
References for additional reading on network biology, Cytoscape apps, and tutorials for further learning.