Downloaded 159 times
![Graph of Sine Domain: All Real Numbers Range: [-1, 1] Symmetry: Origin](https://image.slidesharecdn.com/graphingtranslationsoftrigfunctions-100712150026-phpapp01/75/Graphing-translations-of-trig-functions-3-2048.jpg)
![Graph of Cosine Domain: All Real Numbers Range: [-1, 1] Symmetry: y -axis](https://image.slidesharecdn.com/graphingtranslationsoftrigfunctions-100712150026-phpapp01/75/Graphing-translations-of-trig-functions-4-2048.jpg)
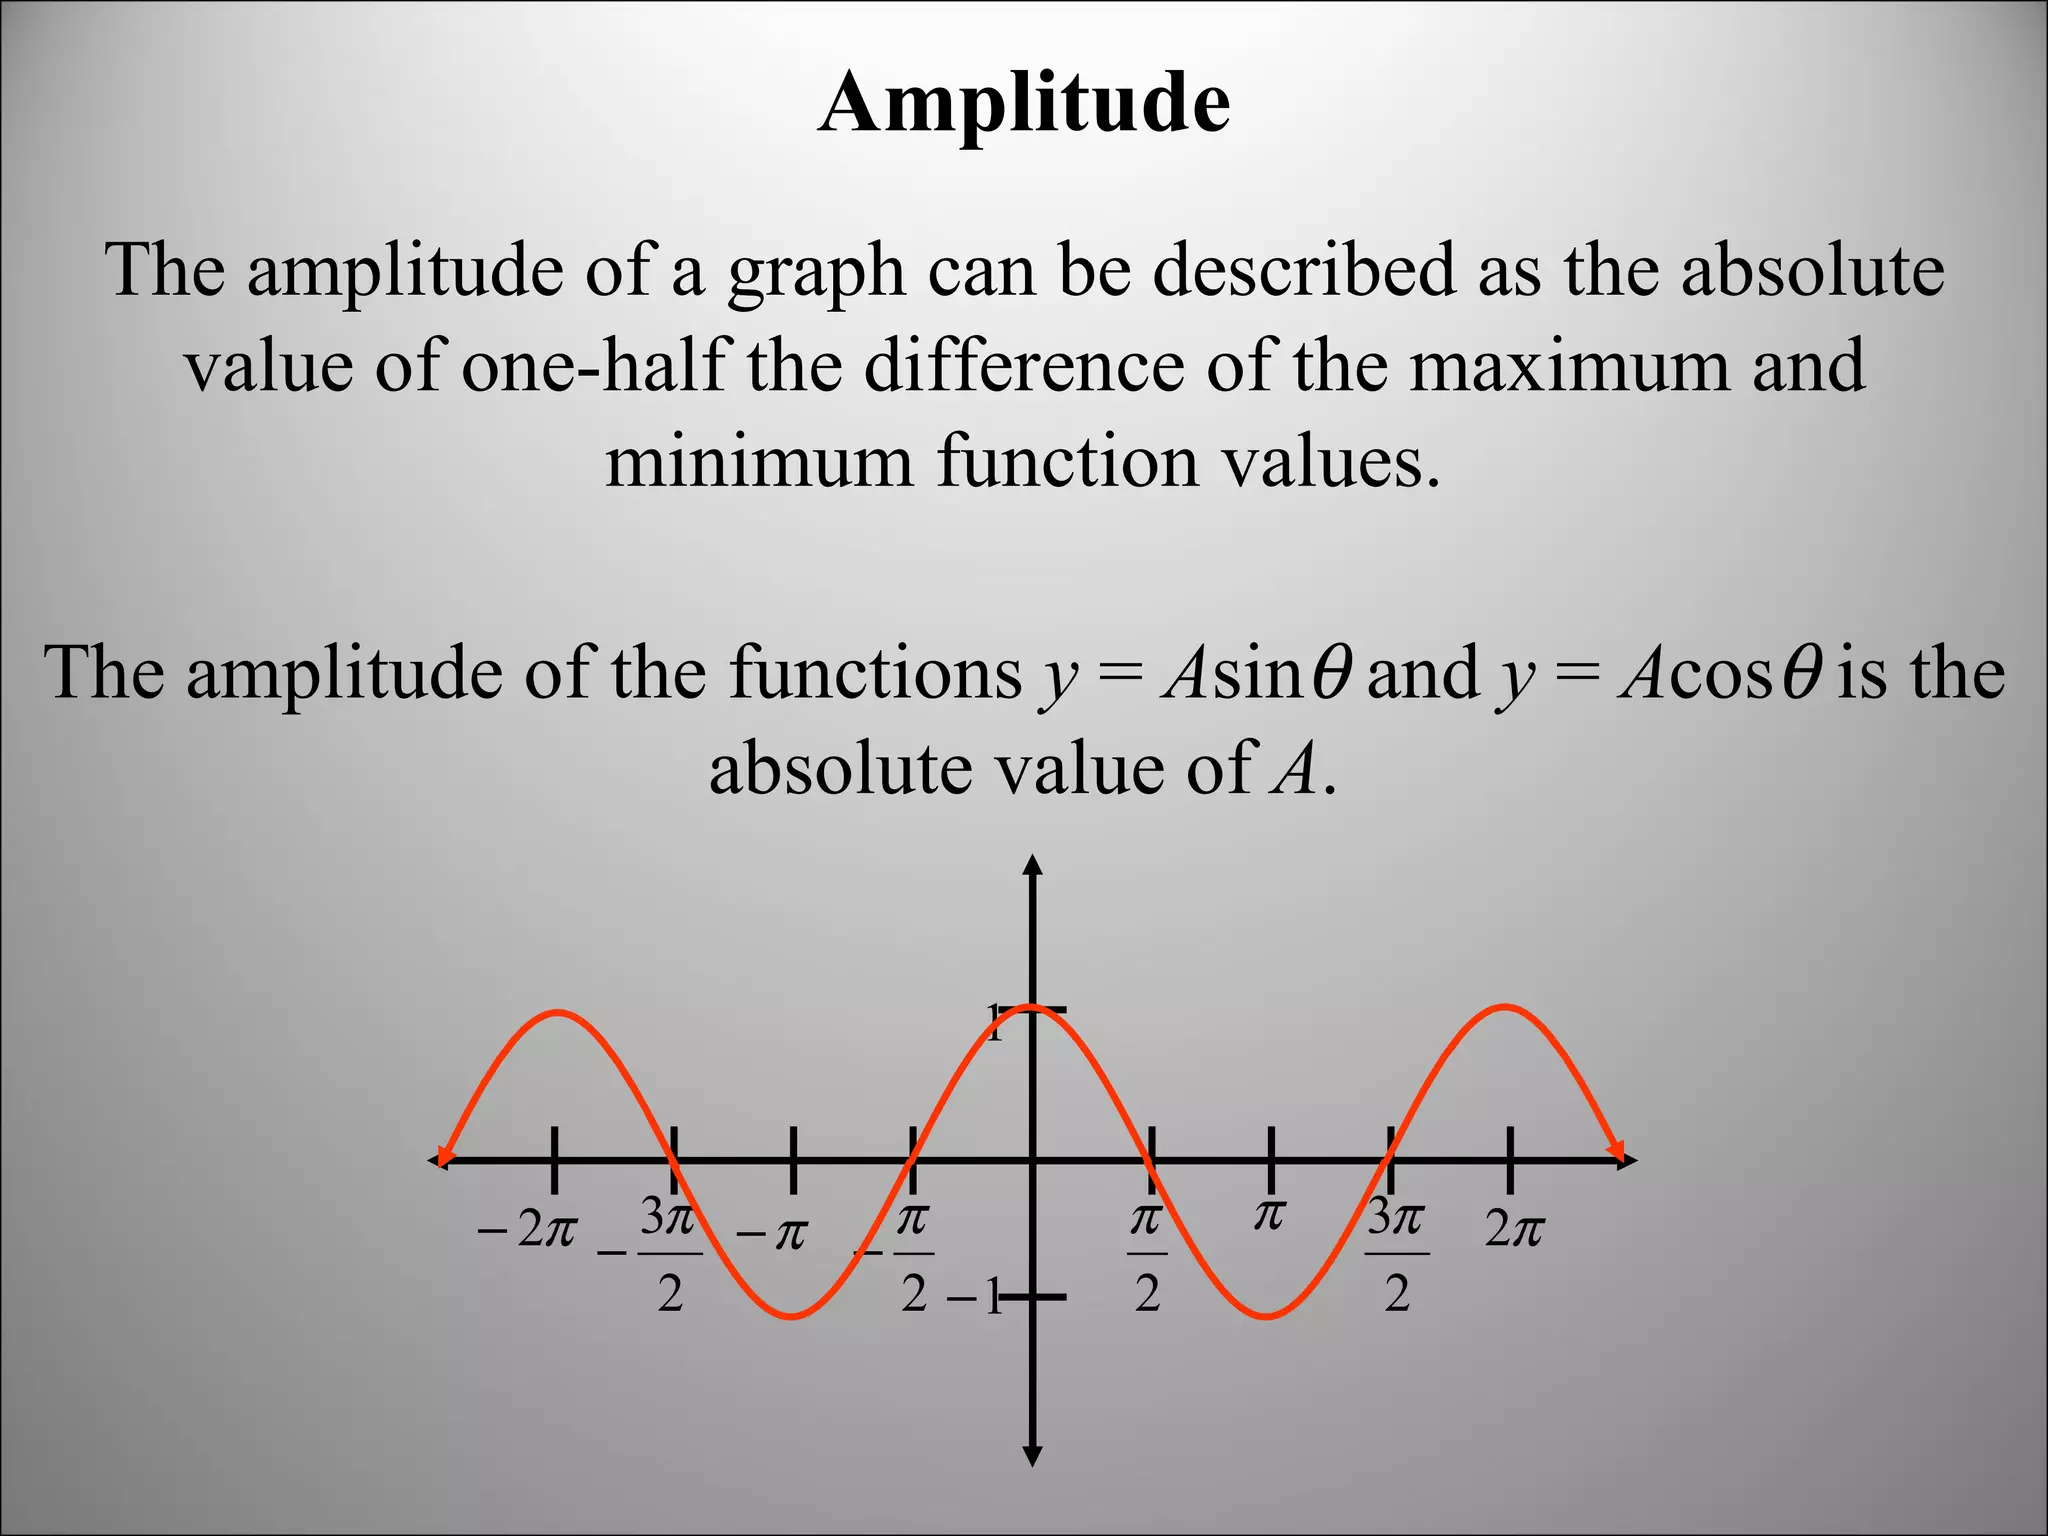
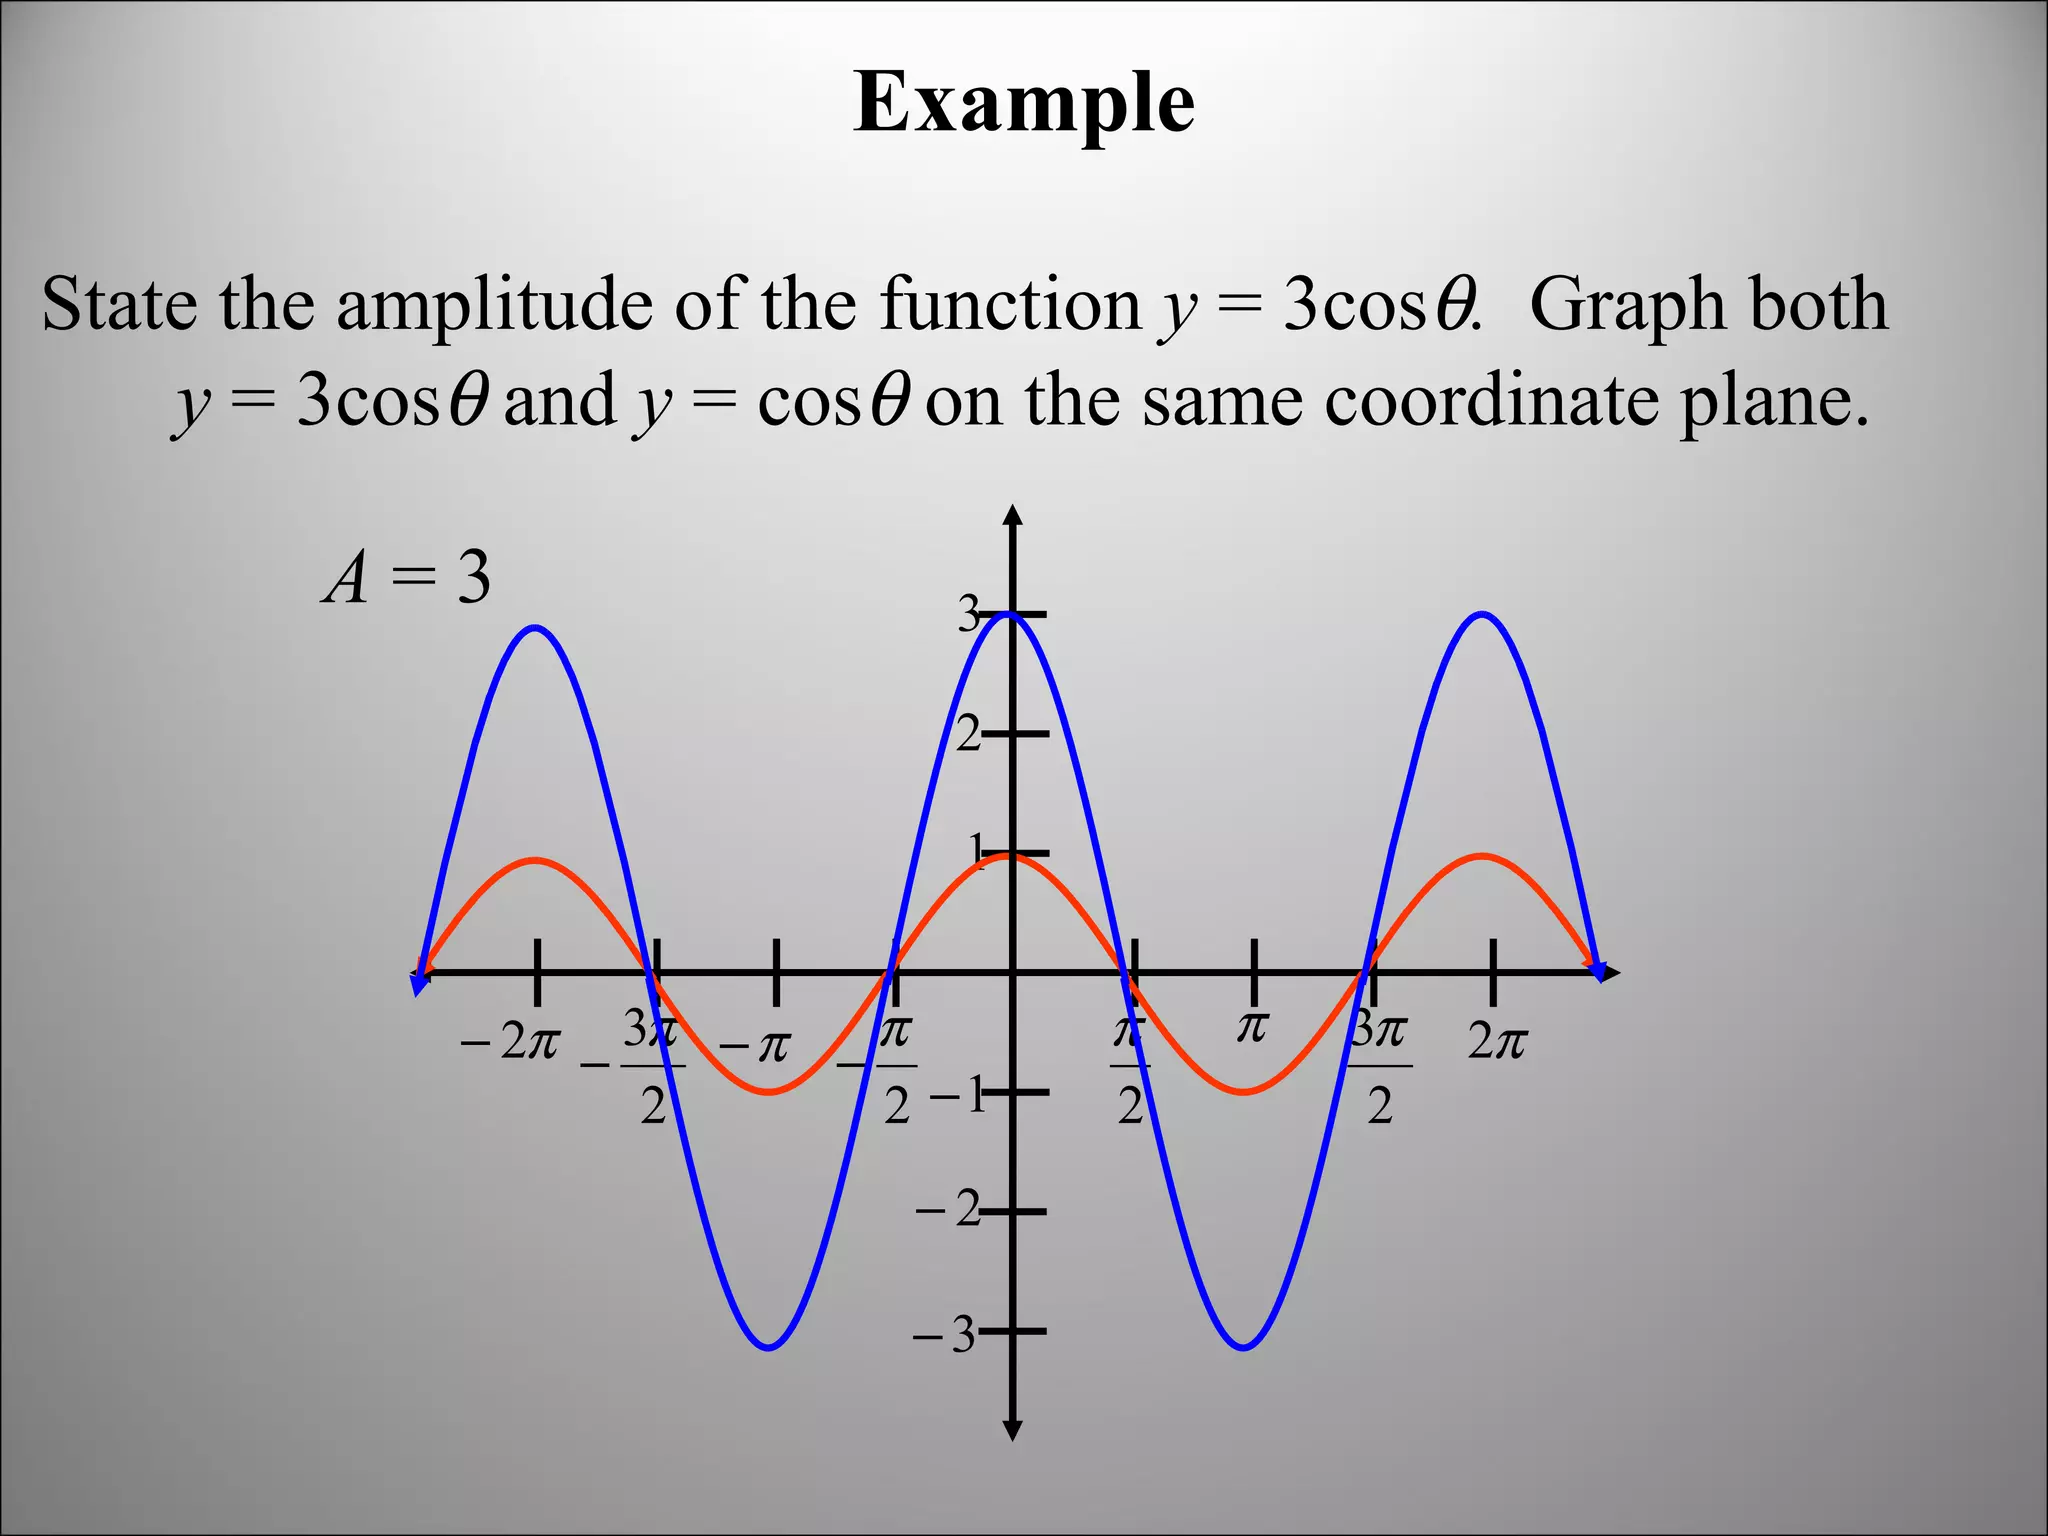
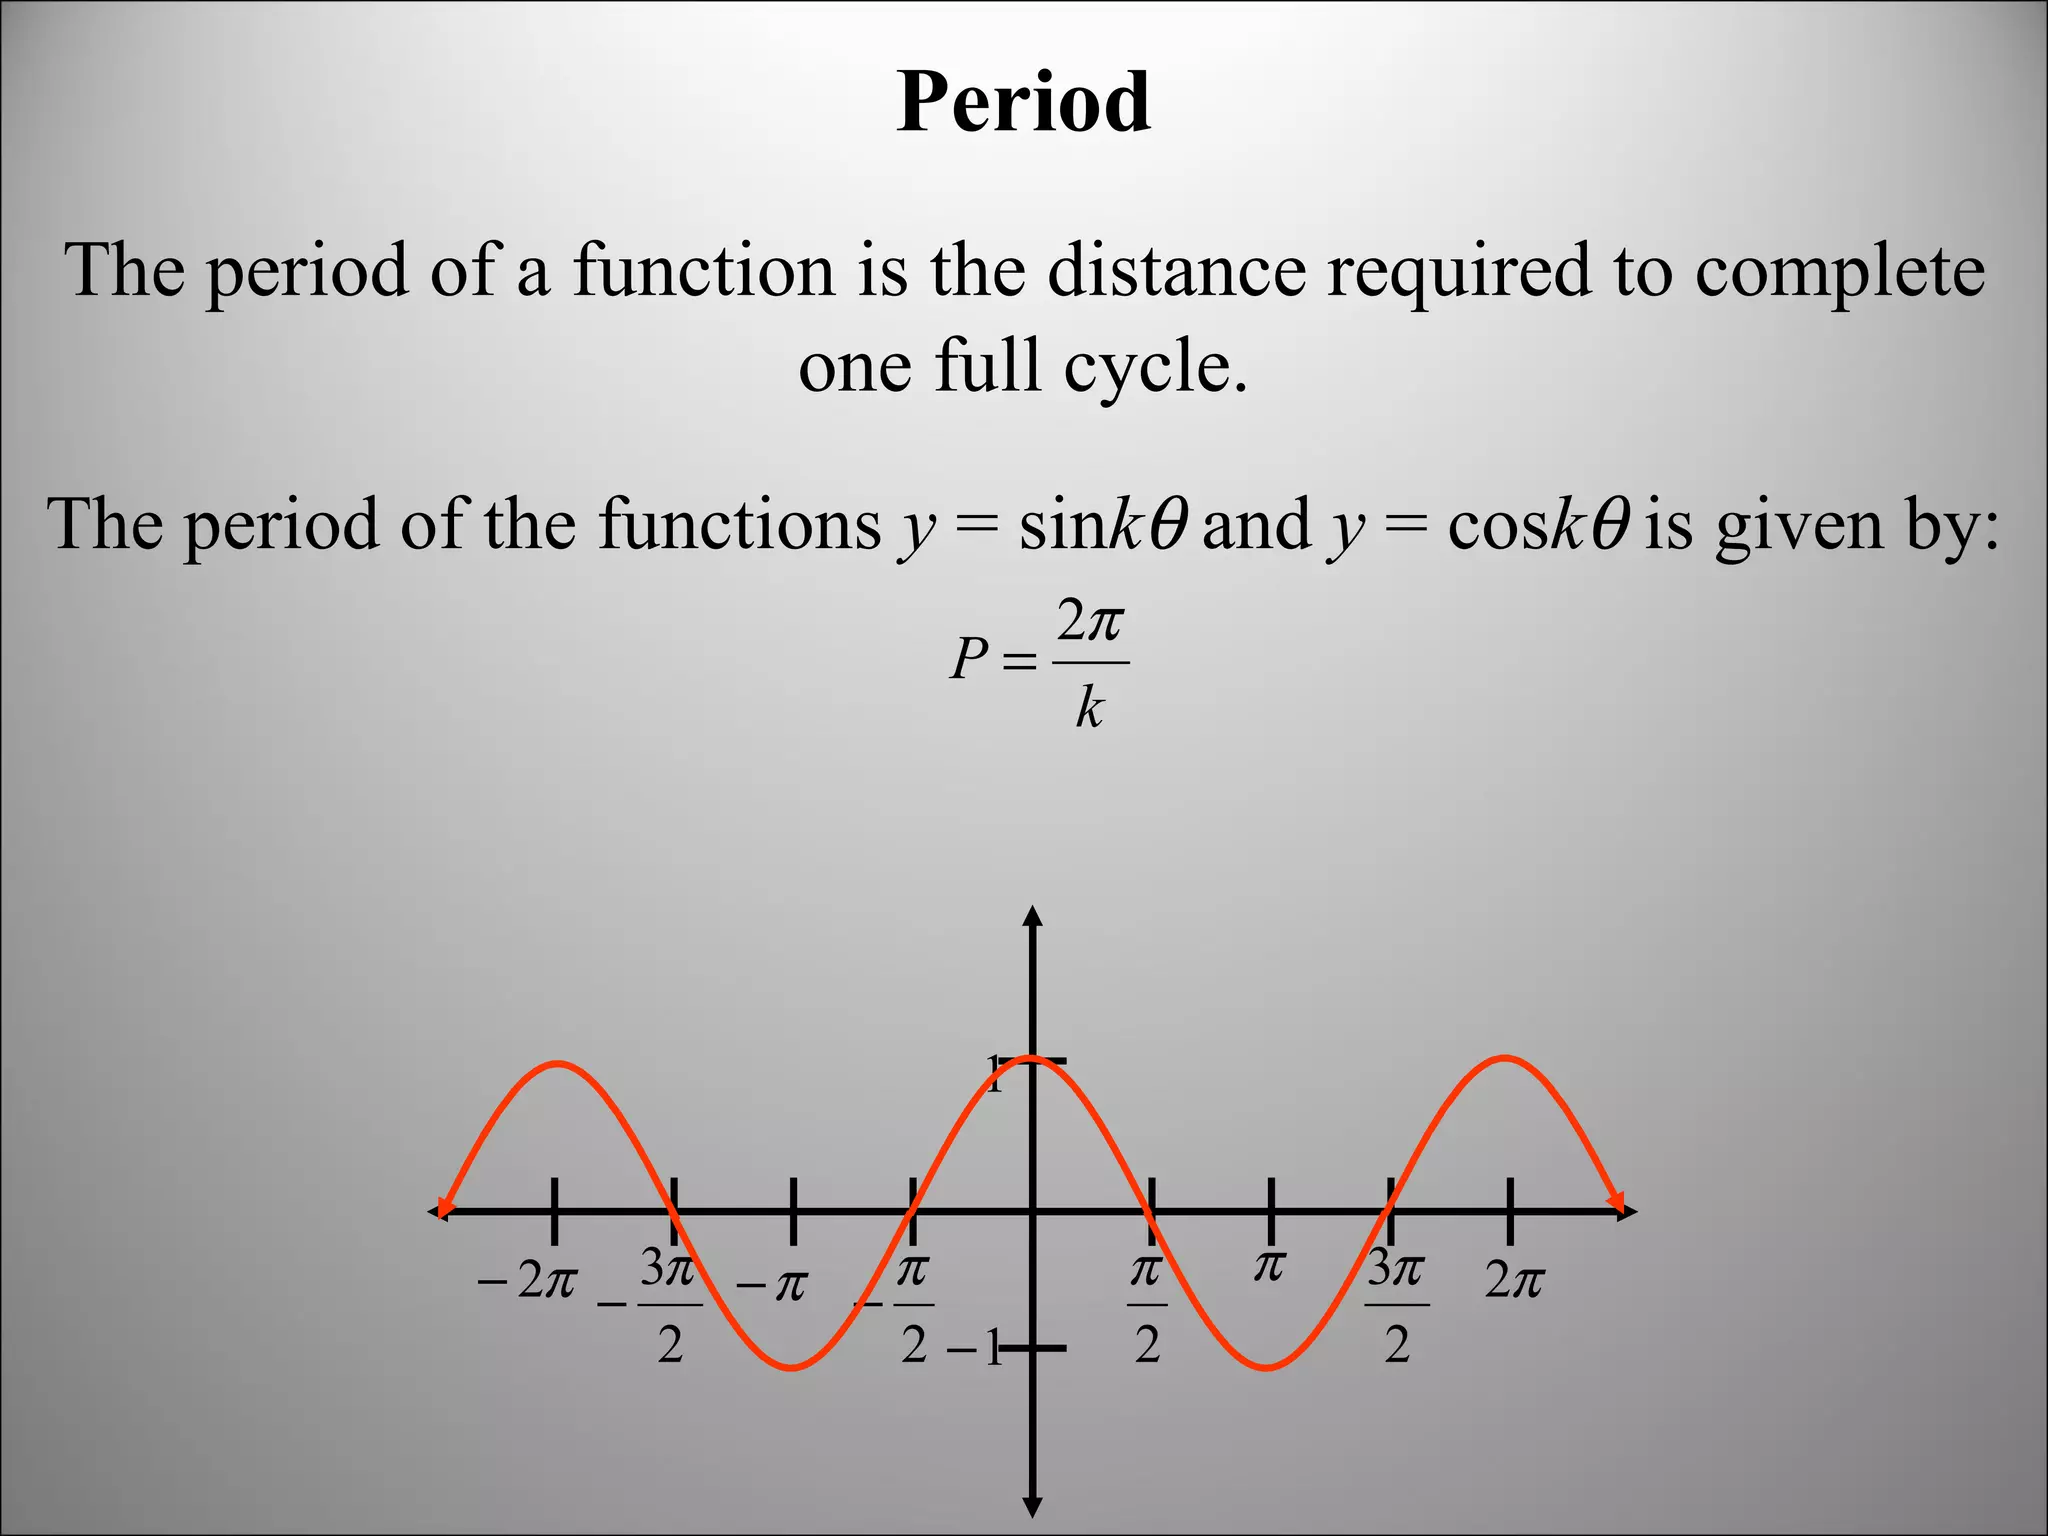
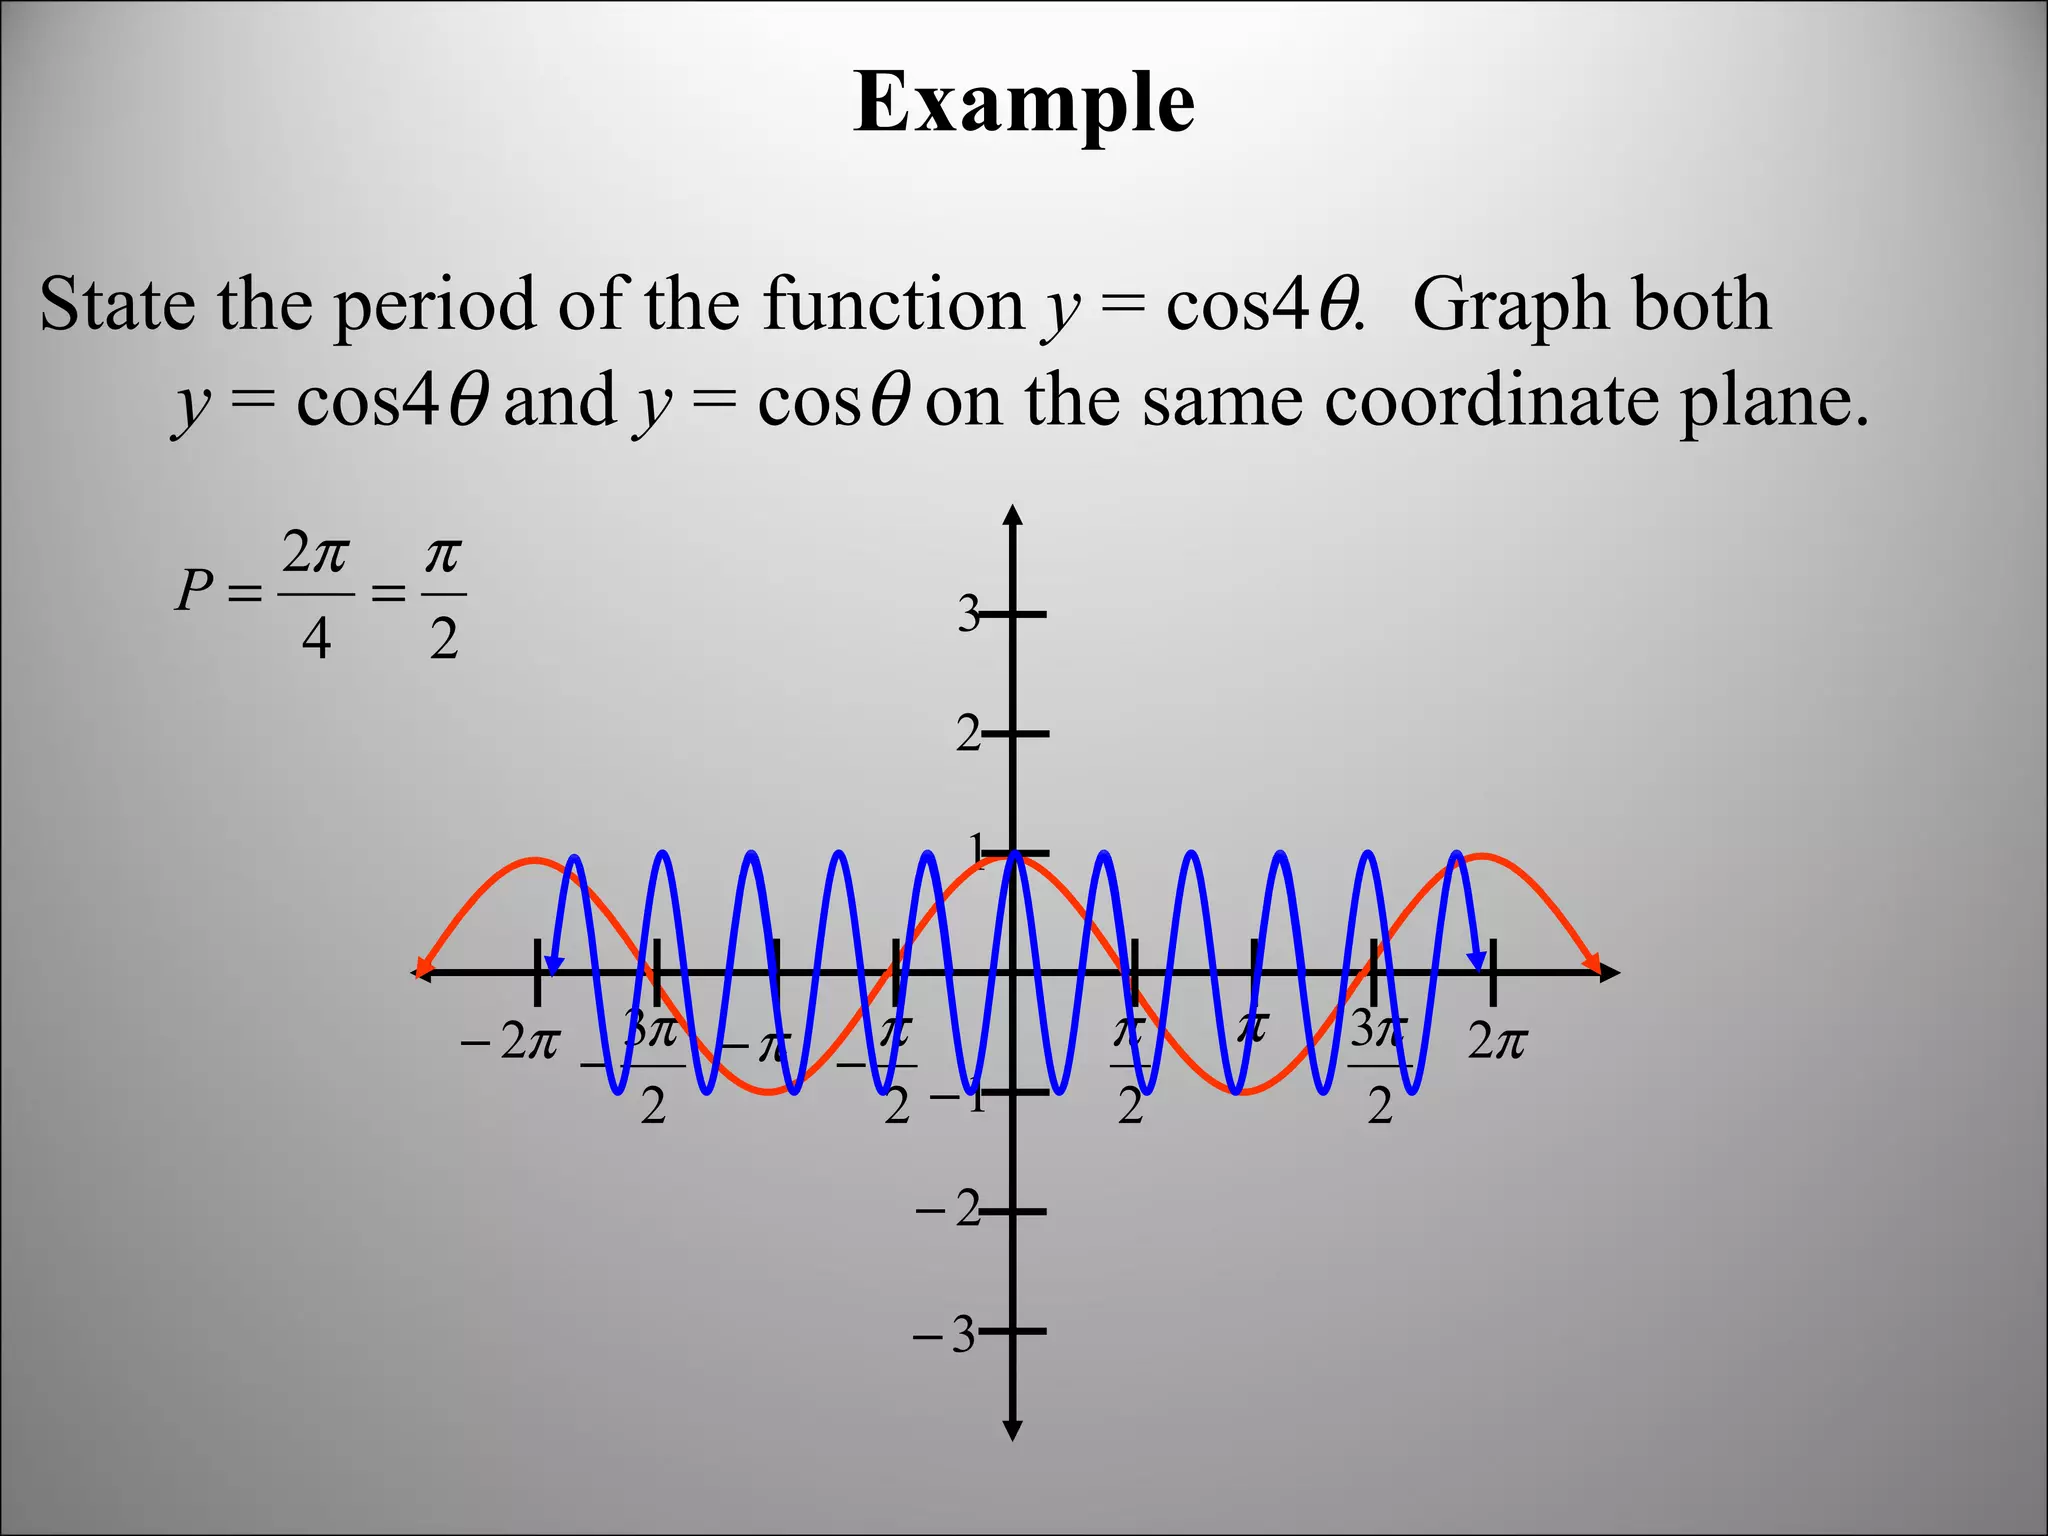
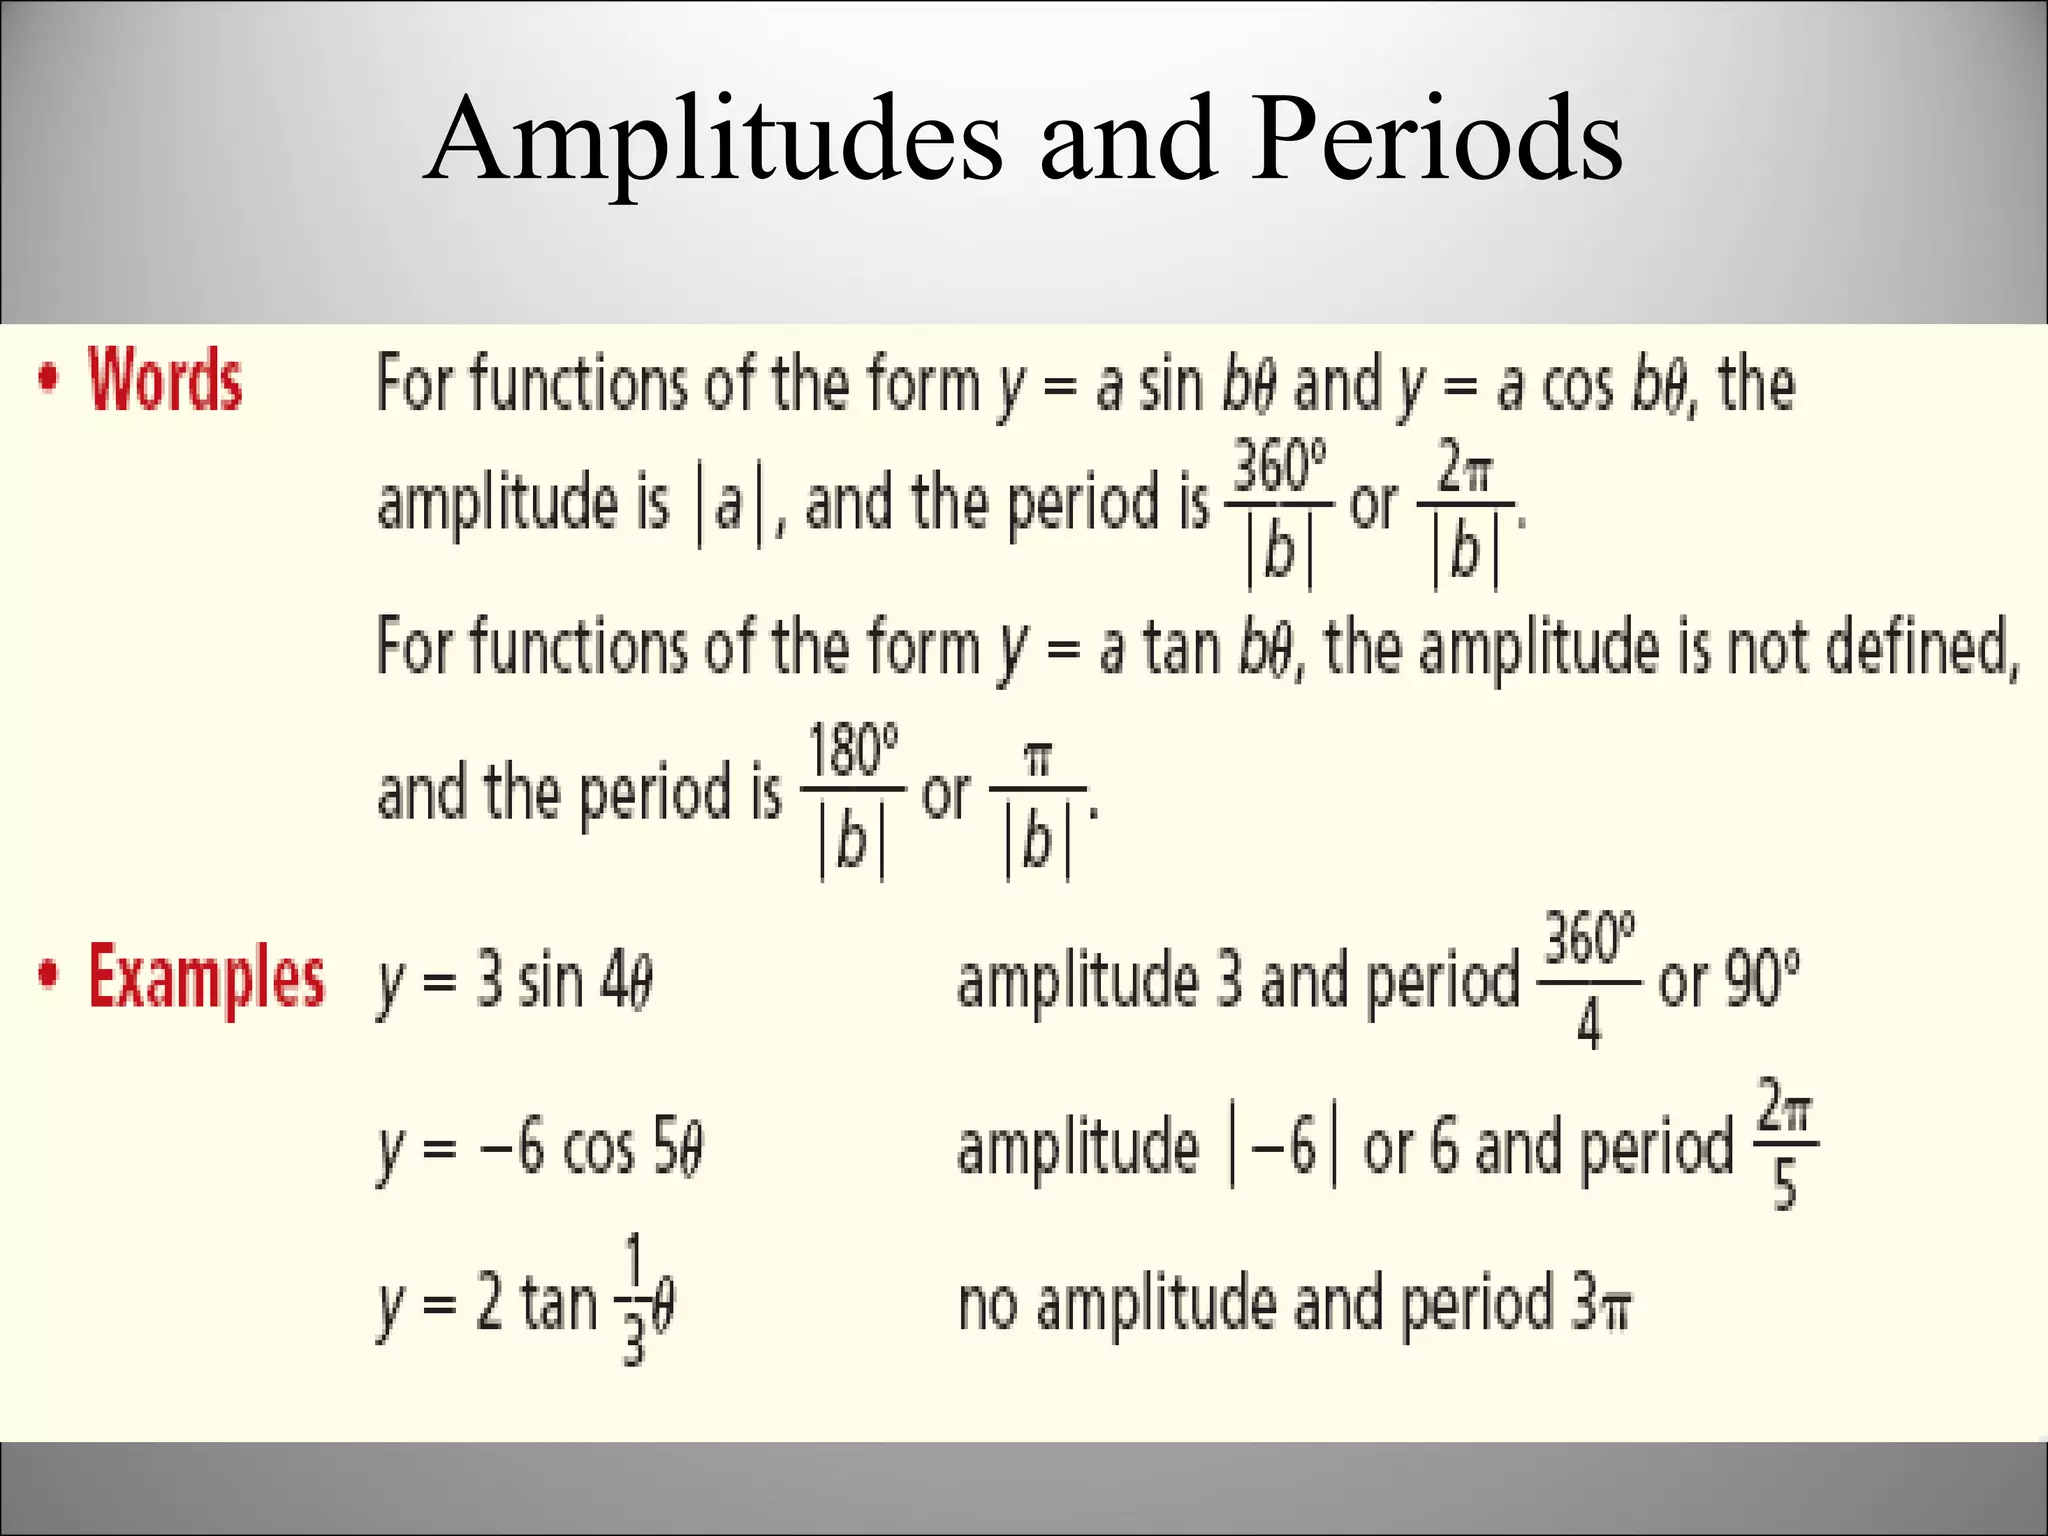
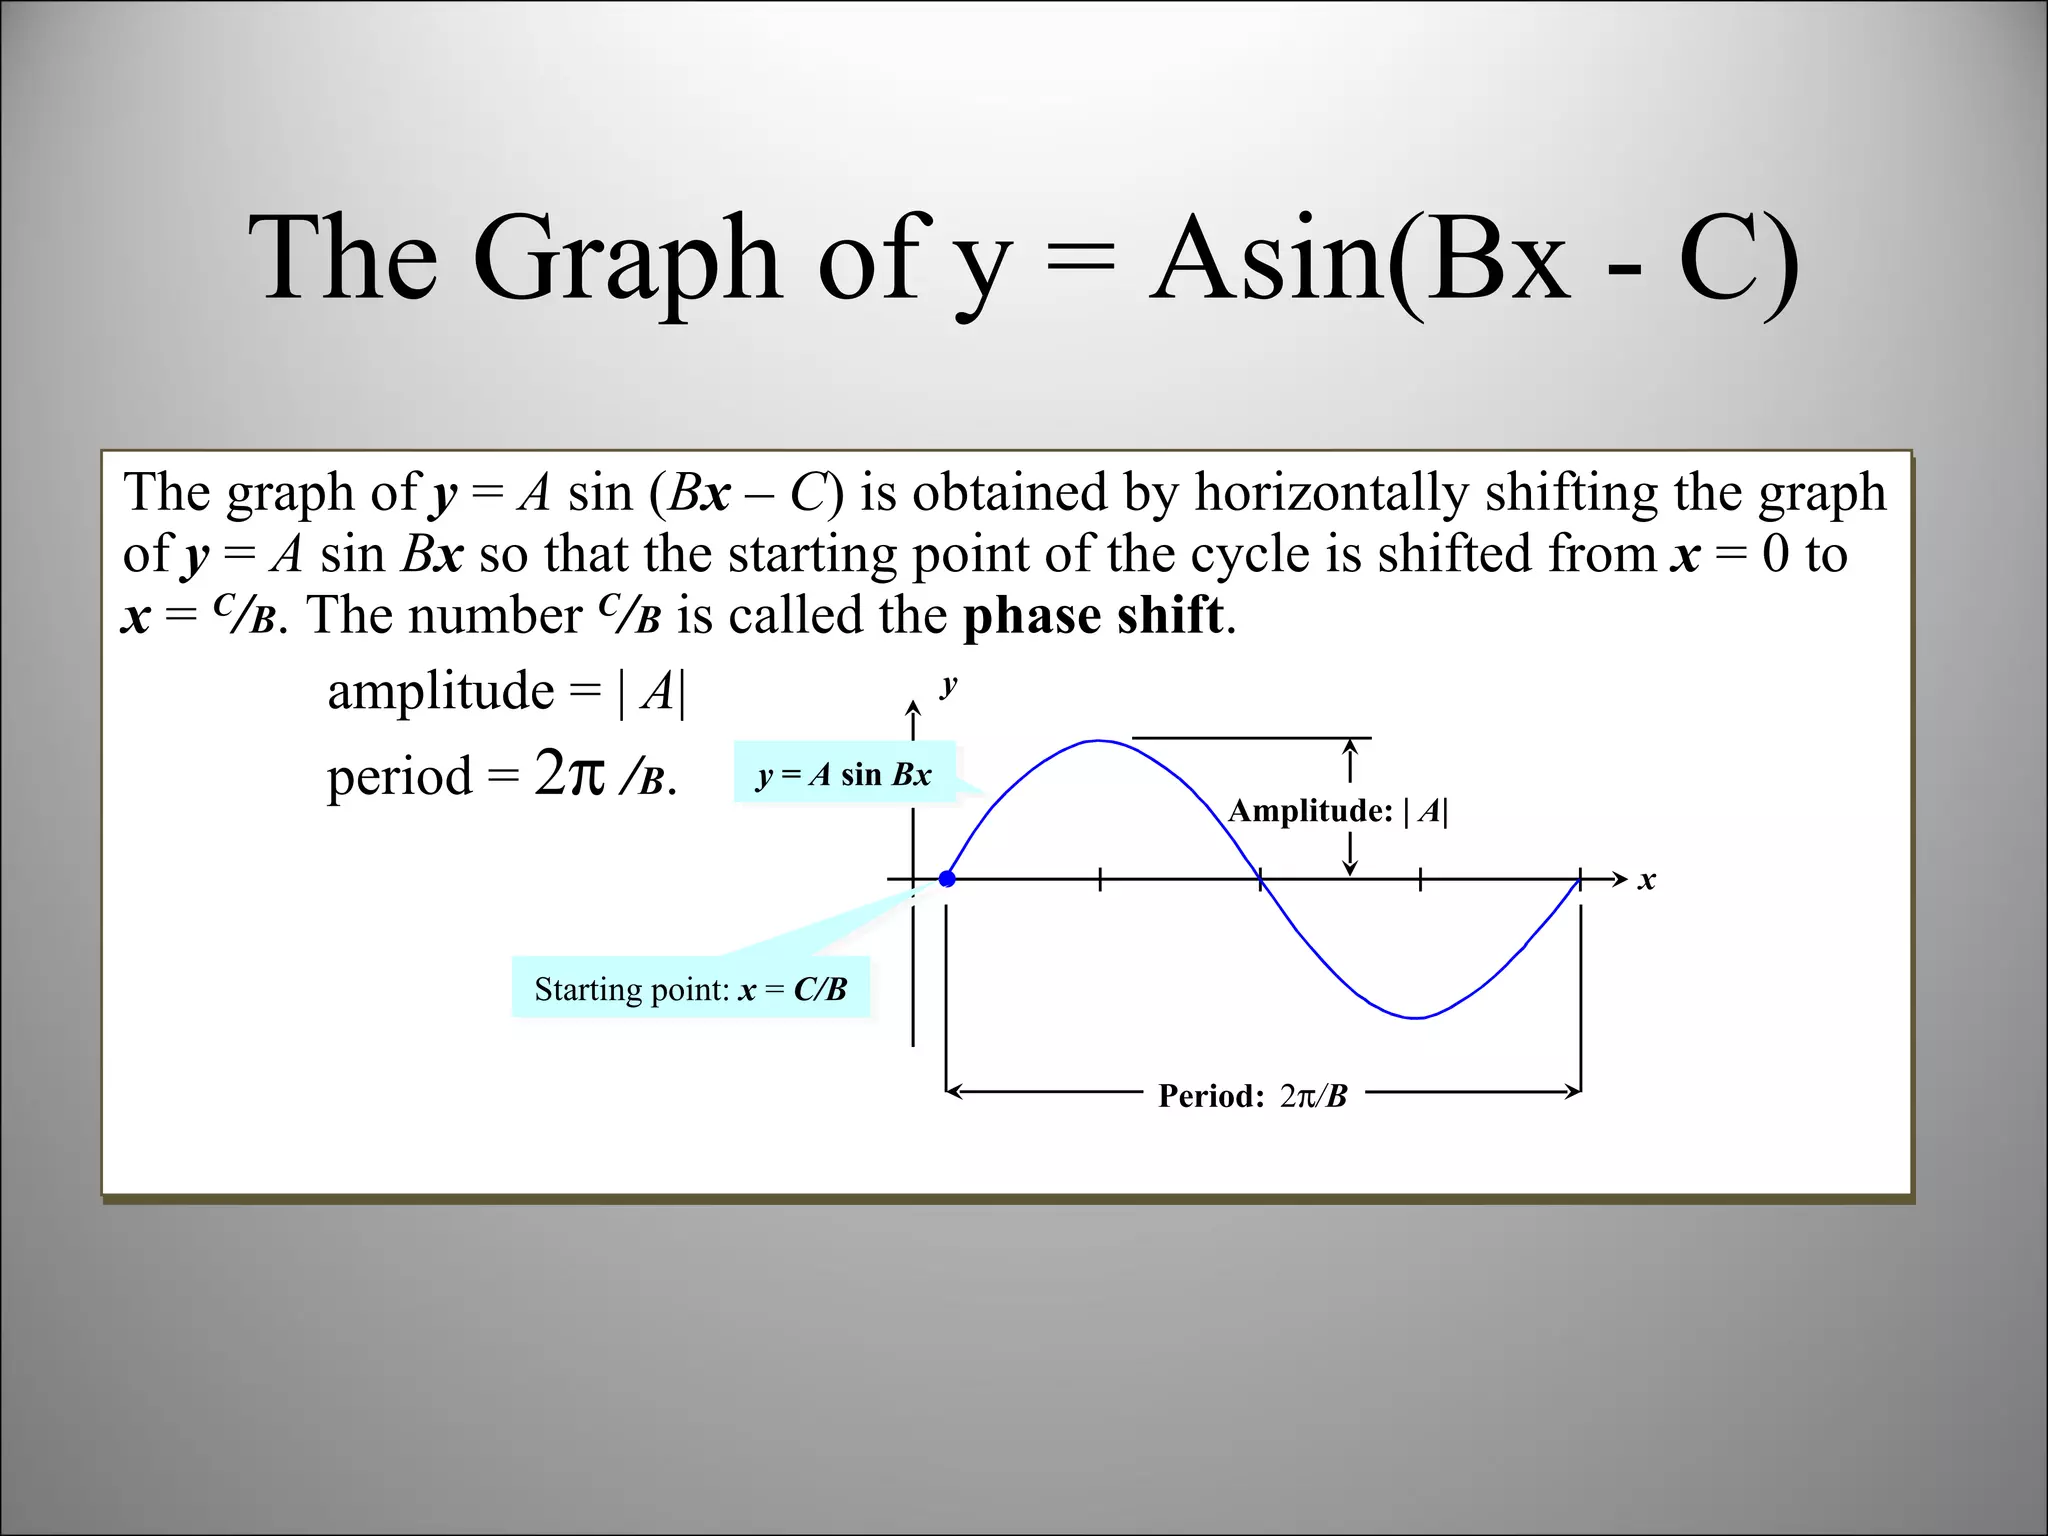
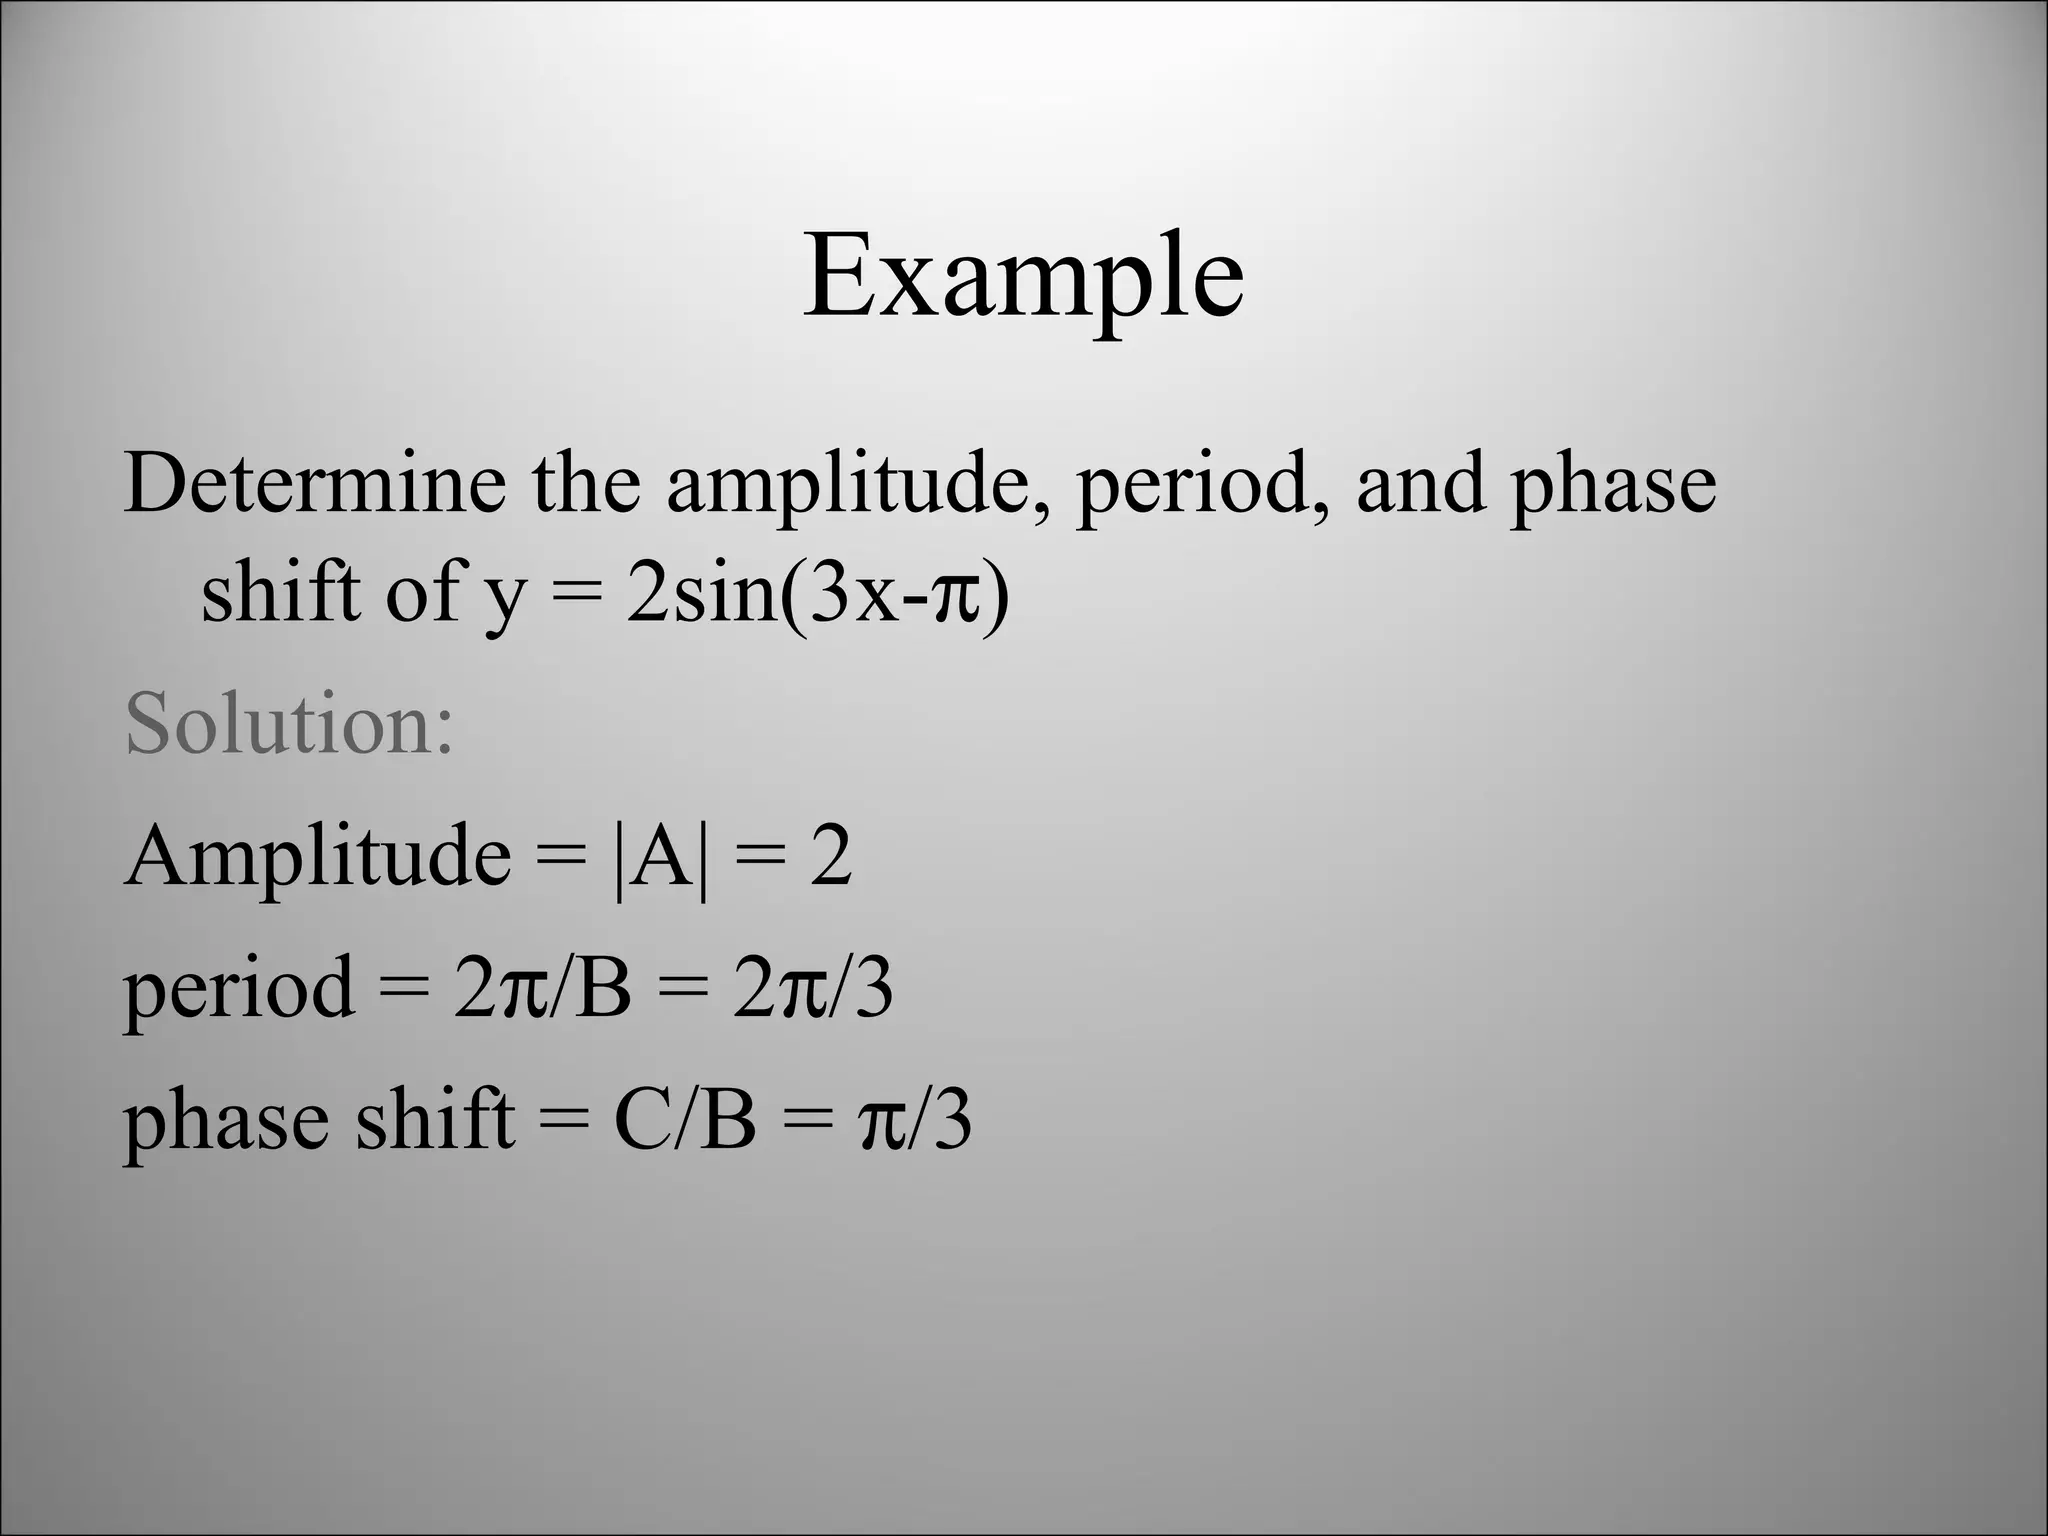
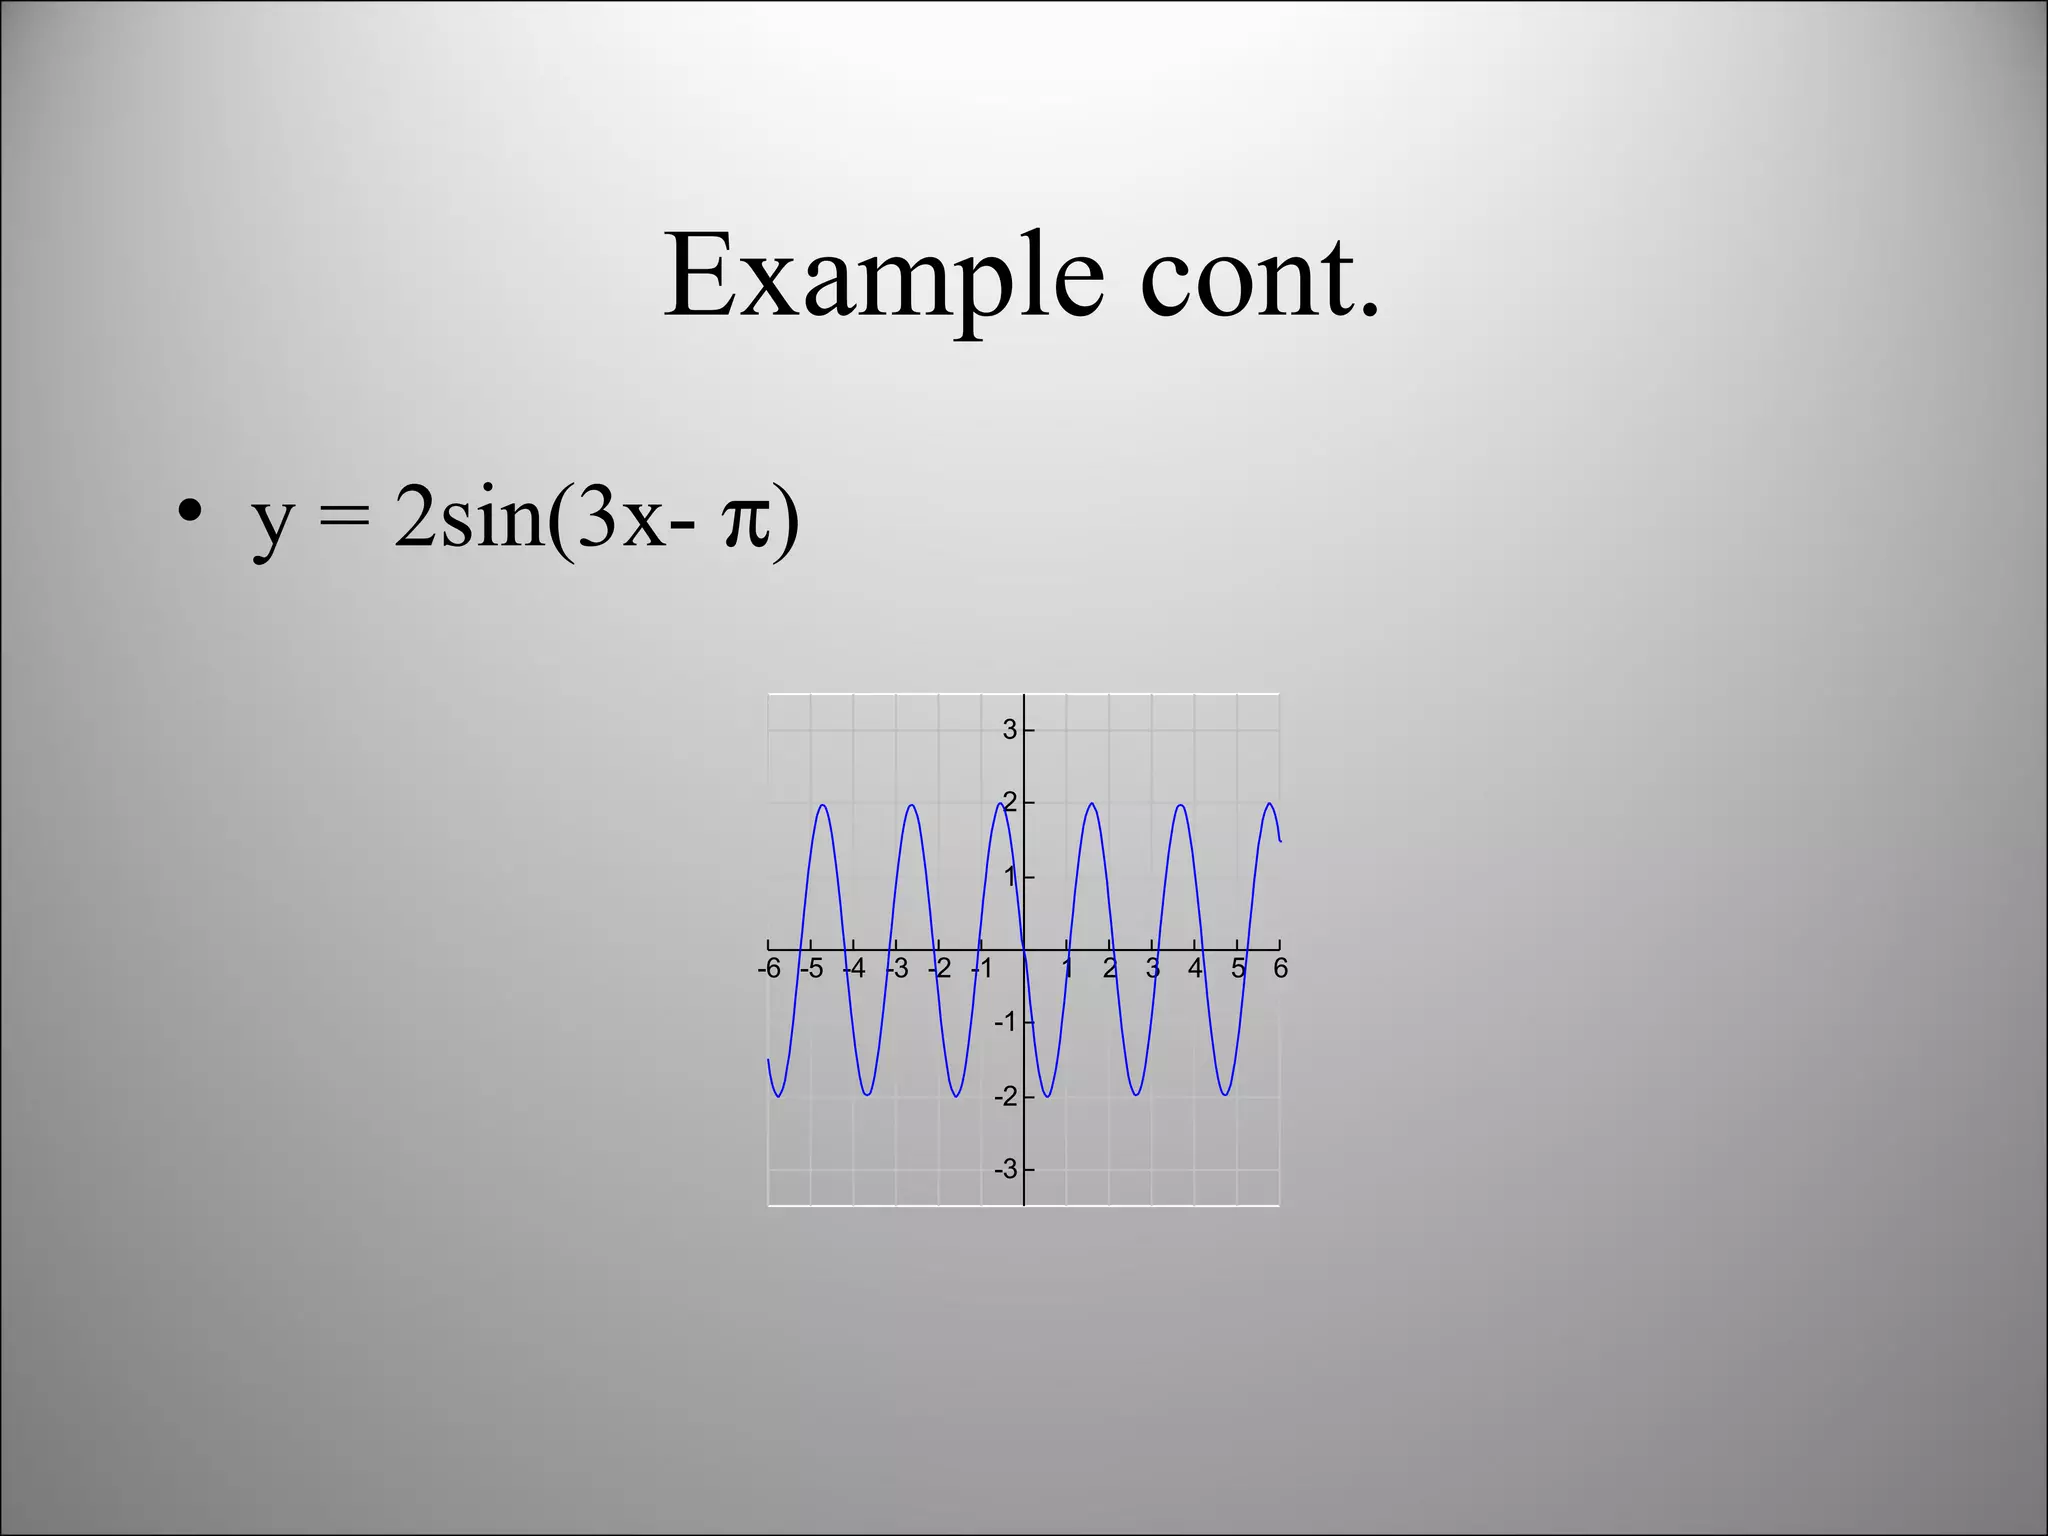
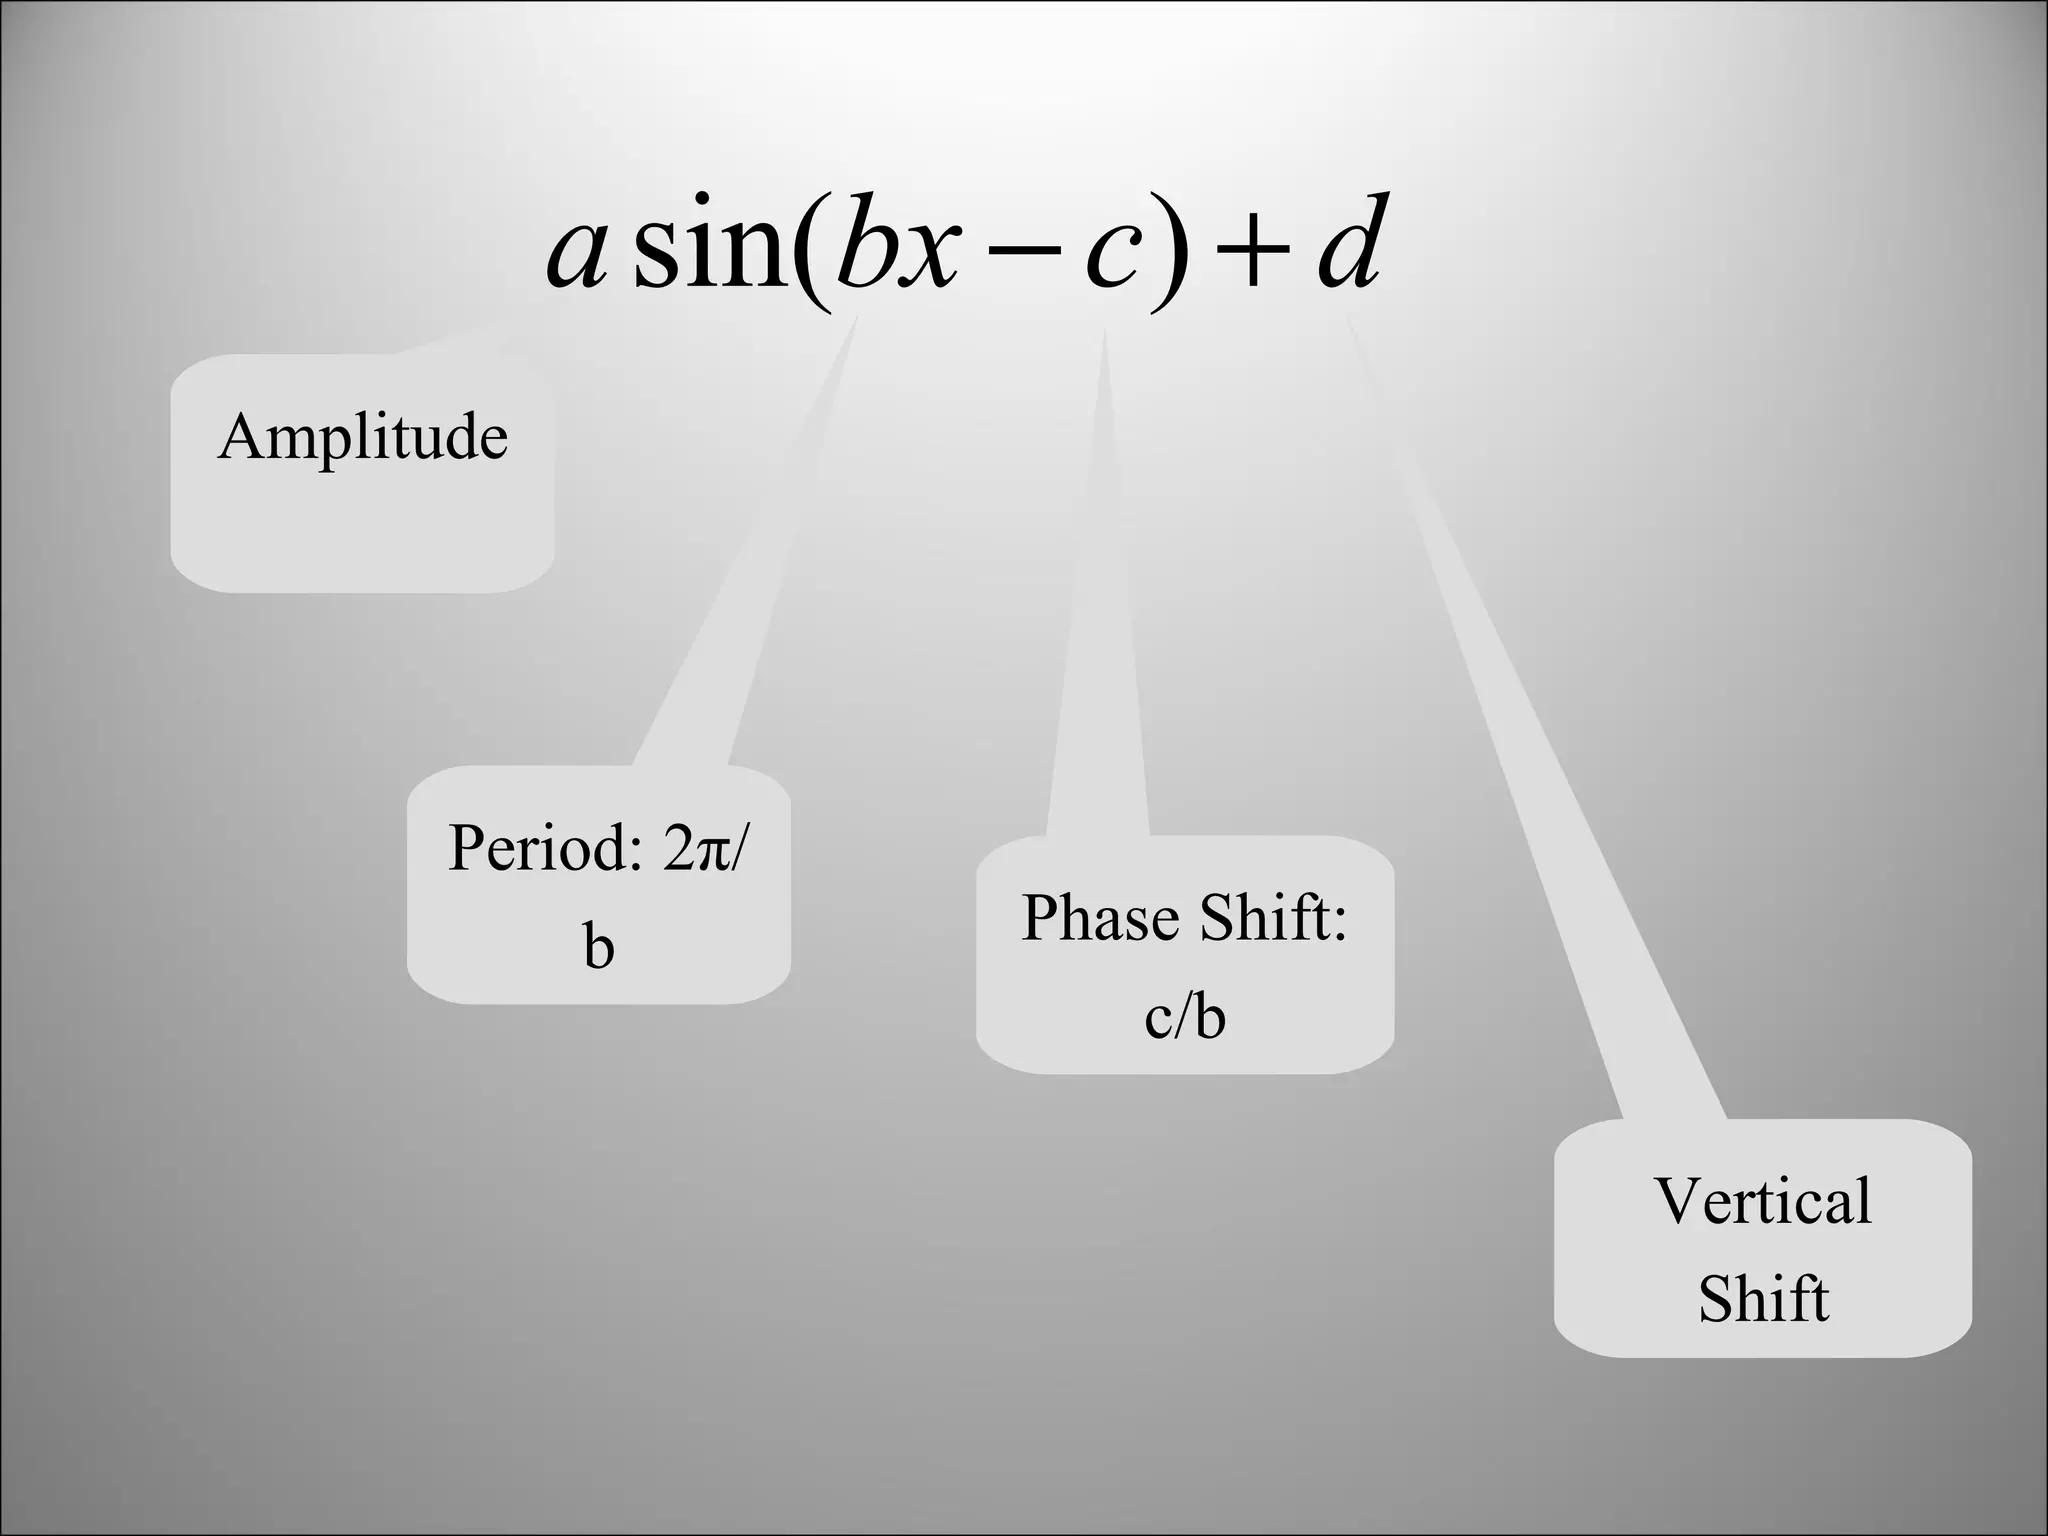
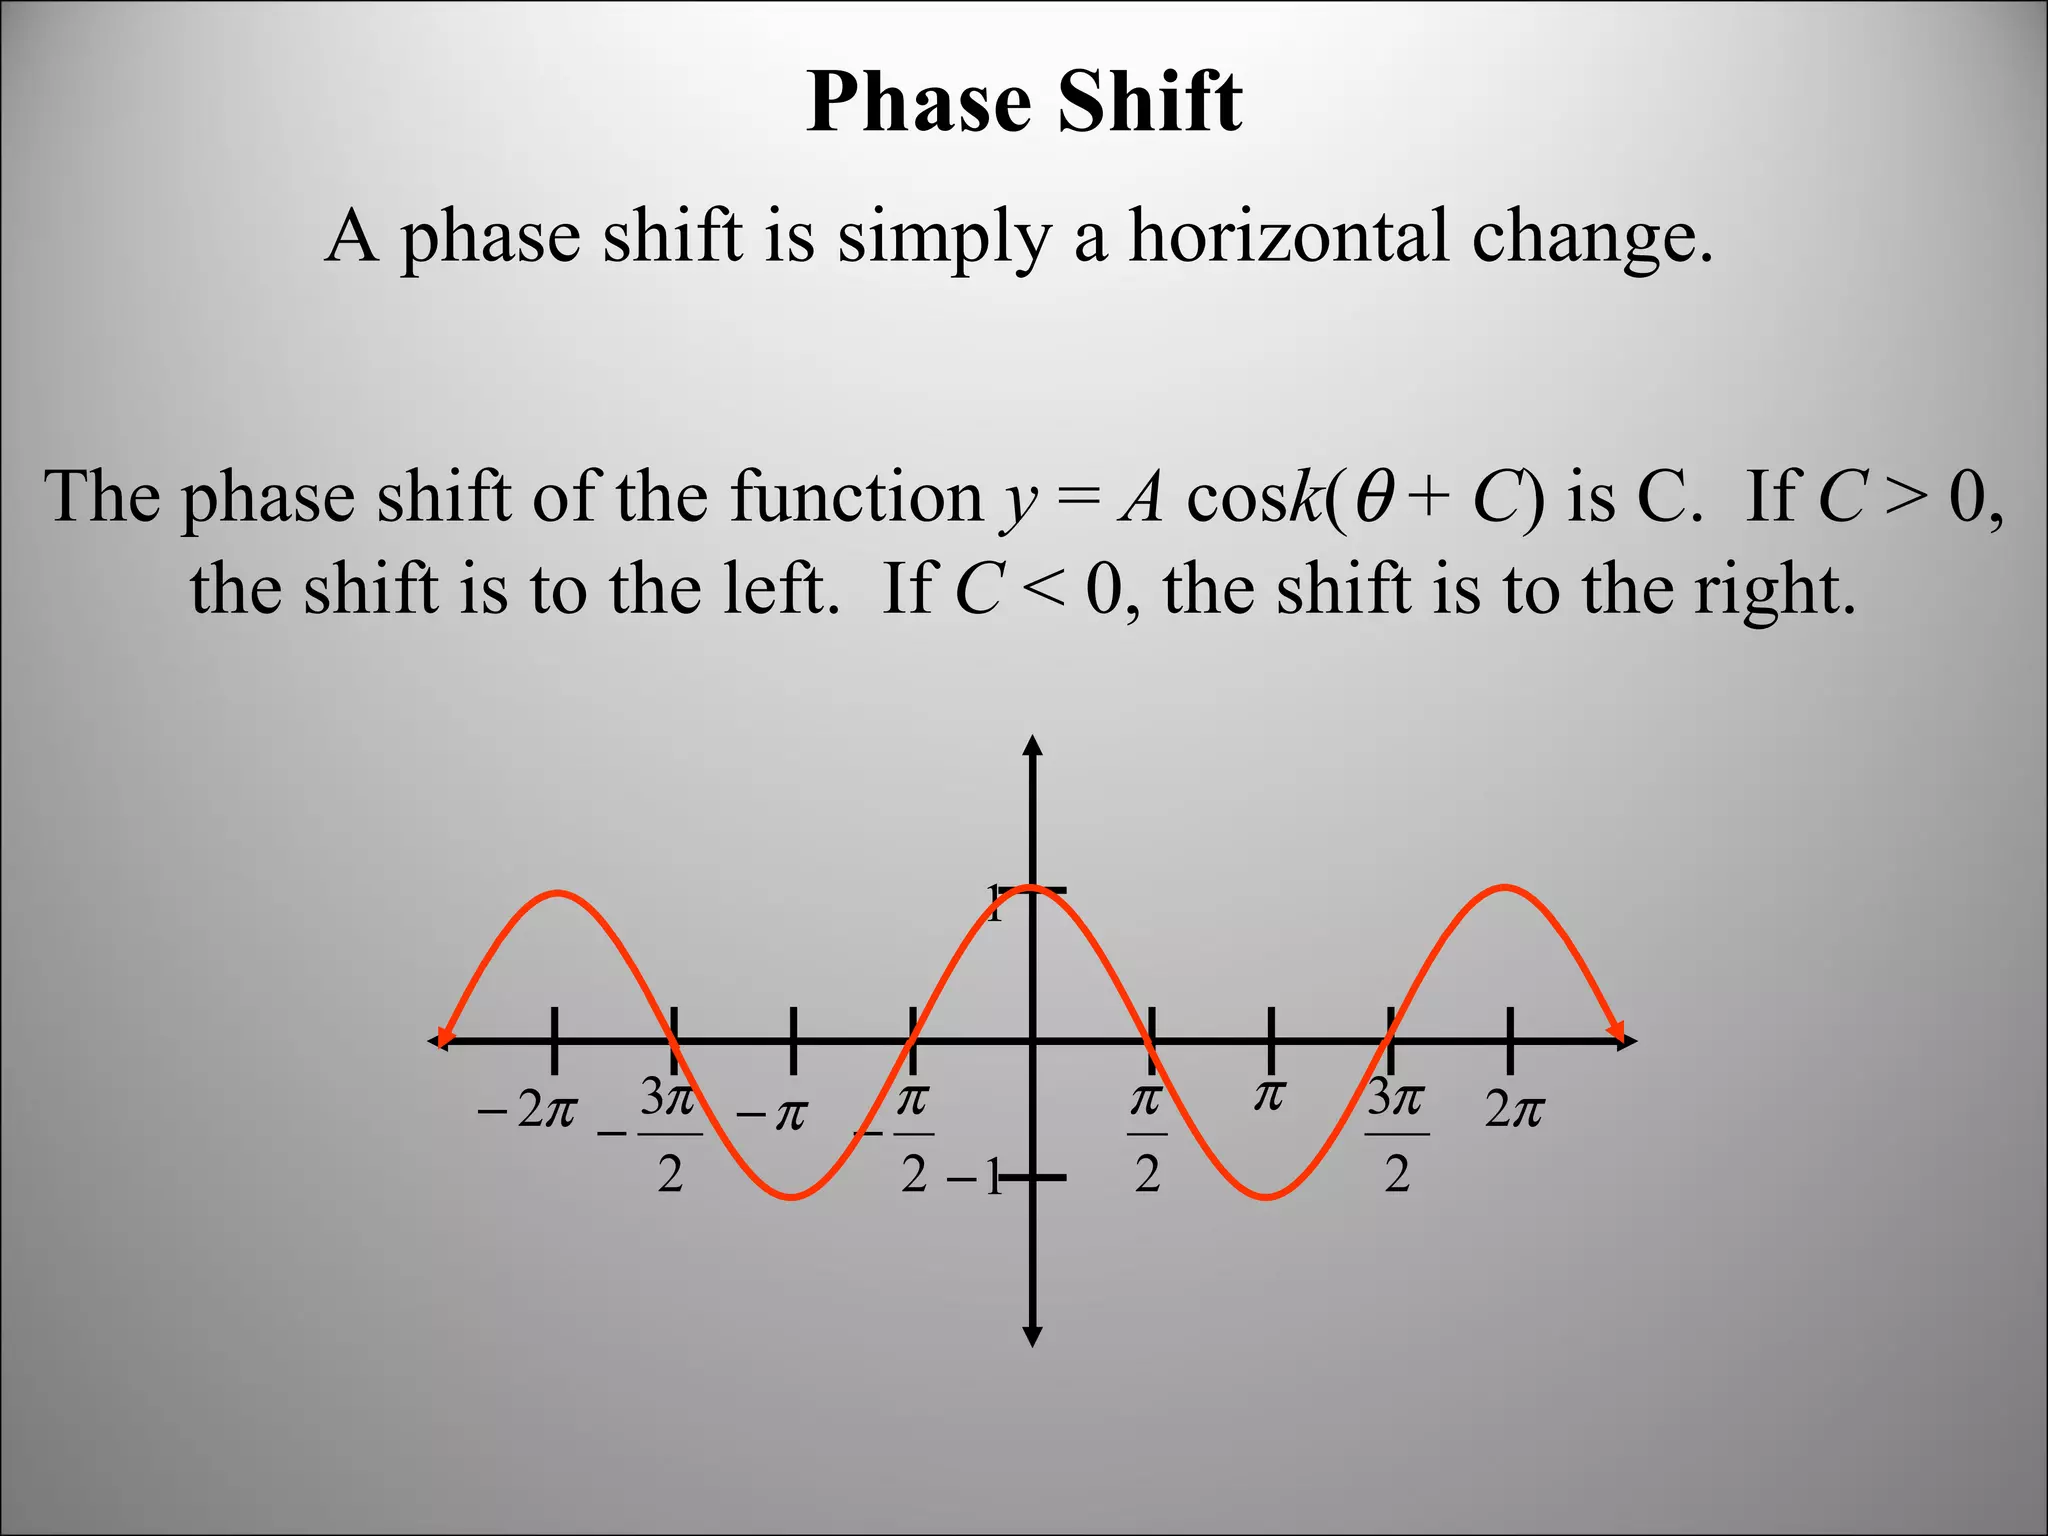
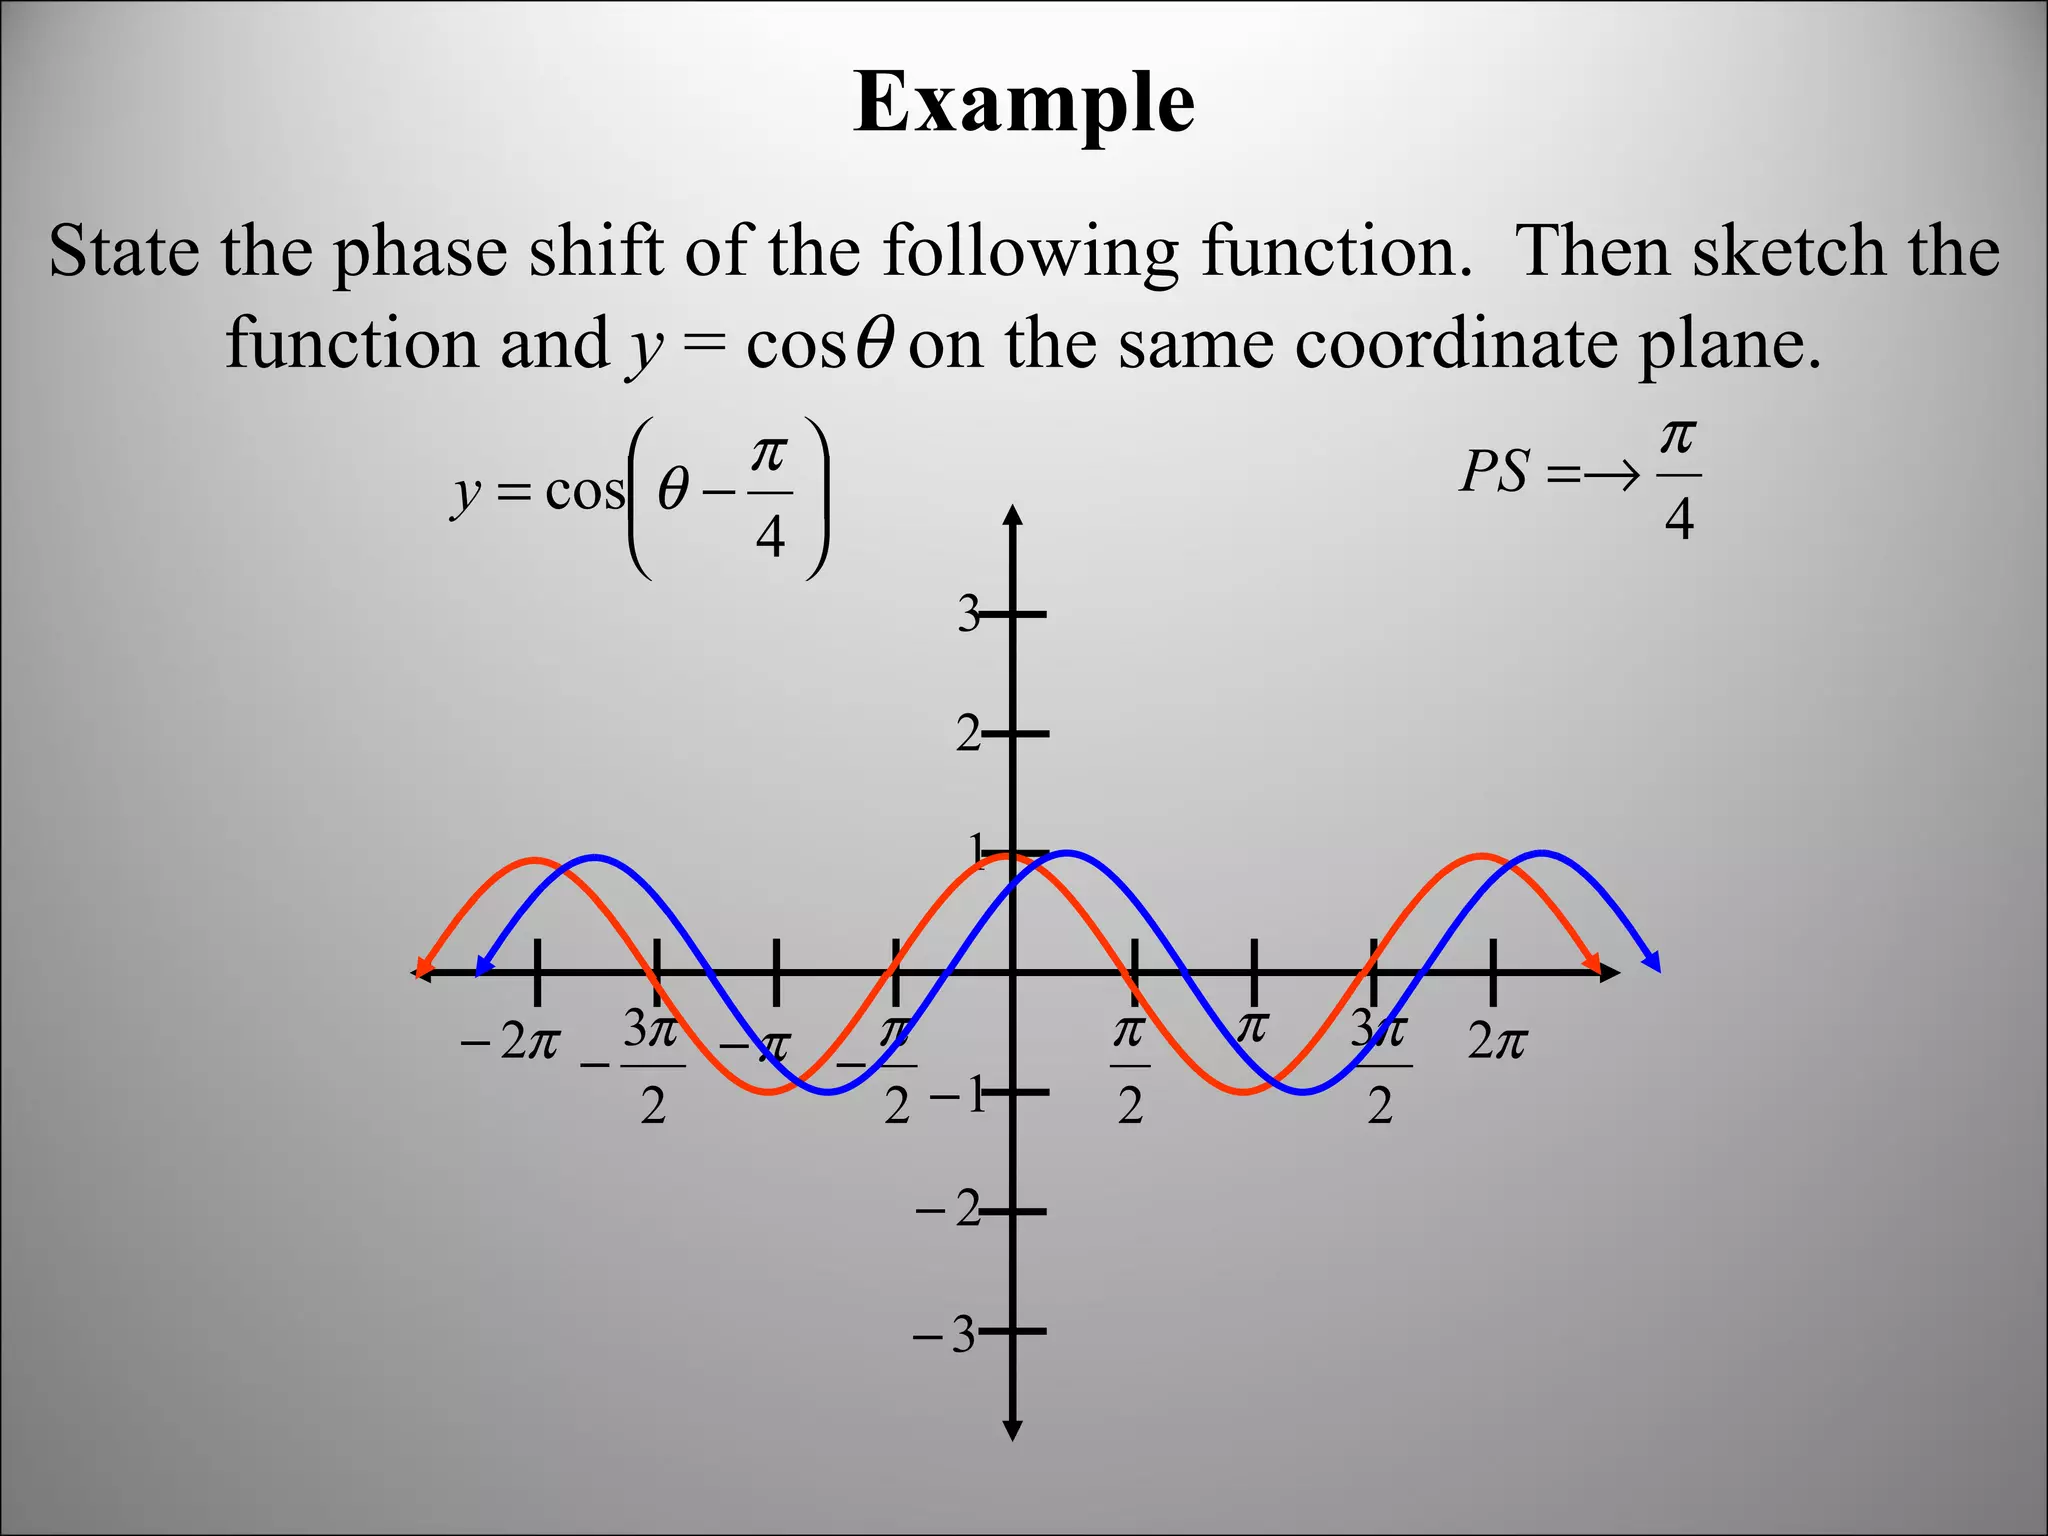
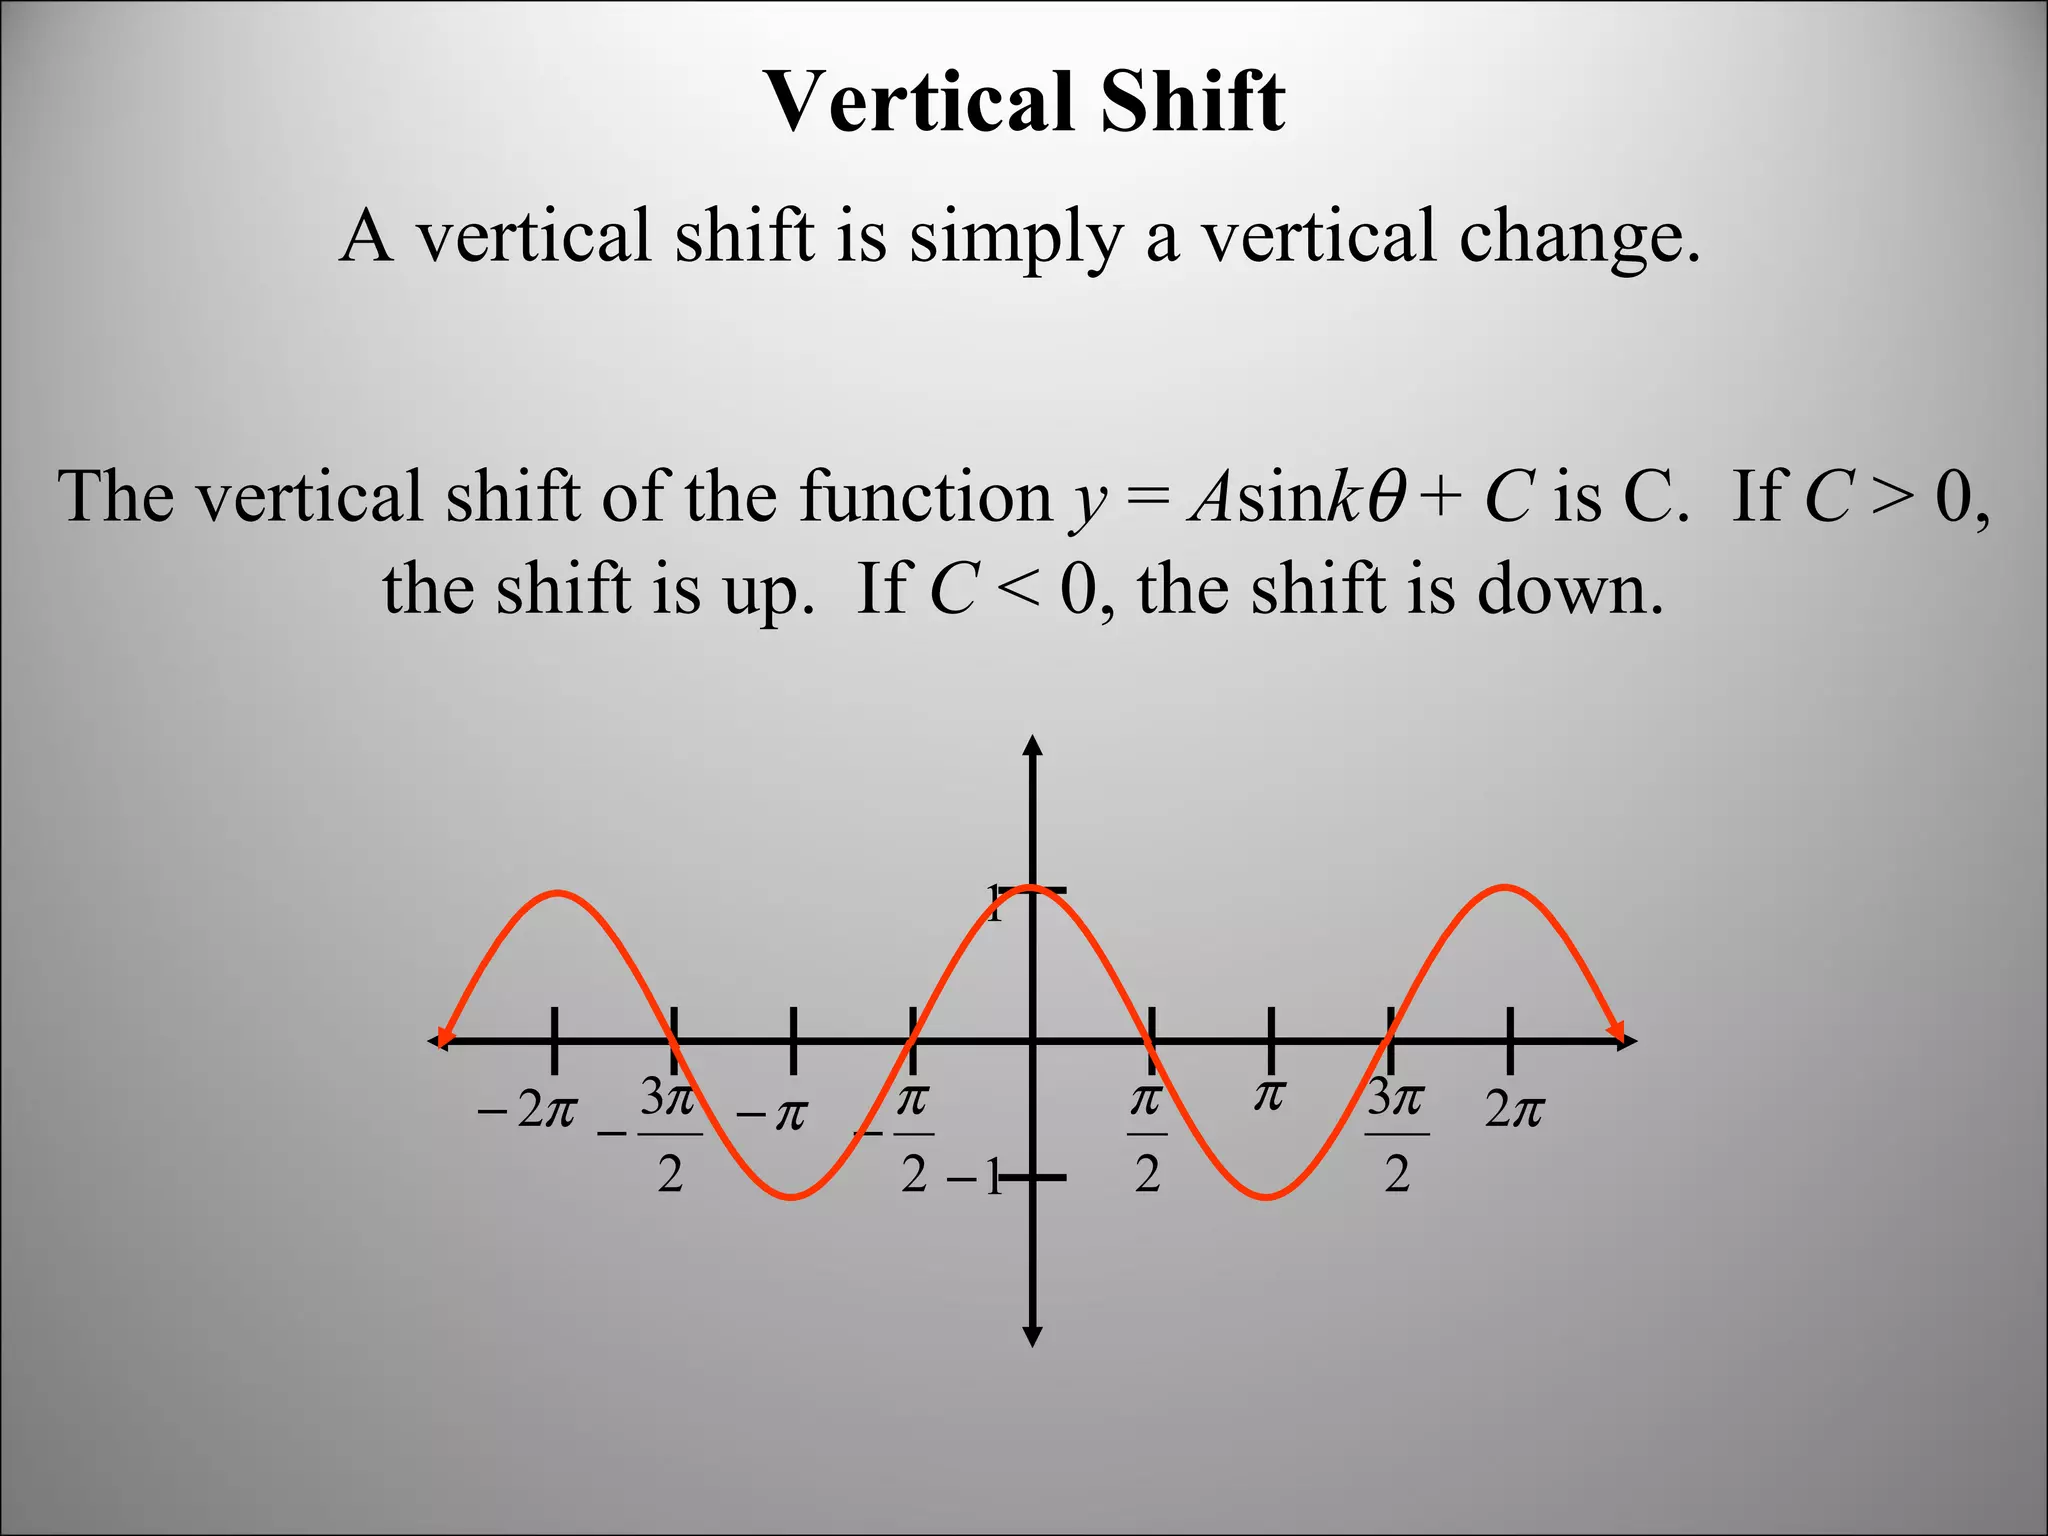
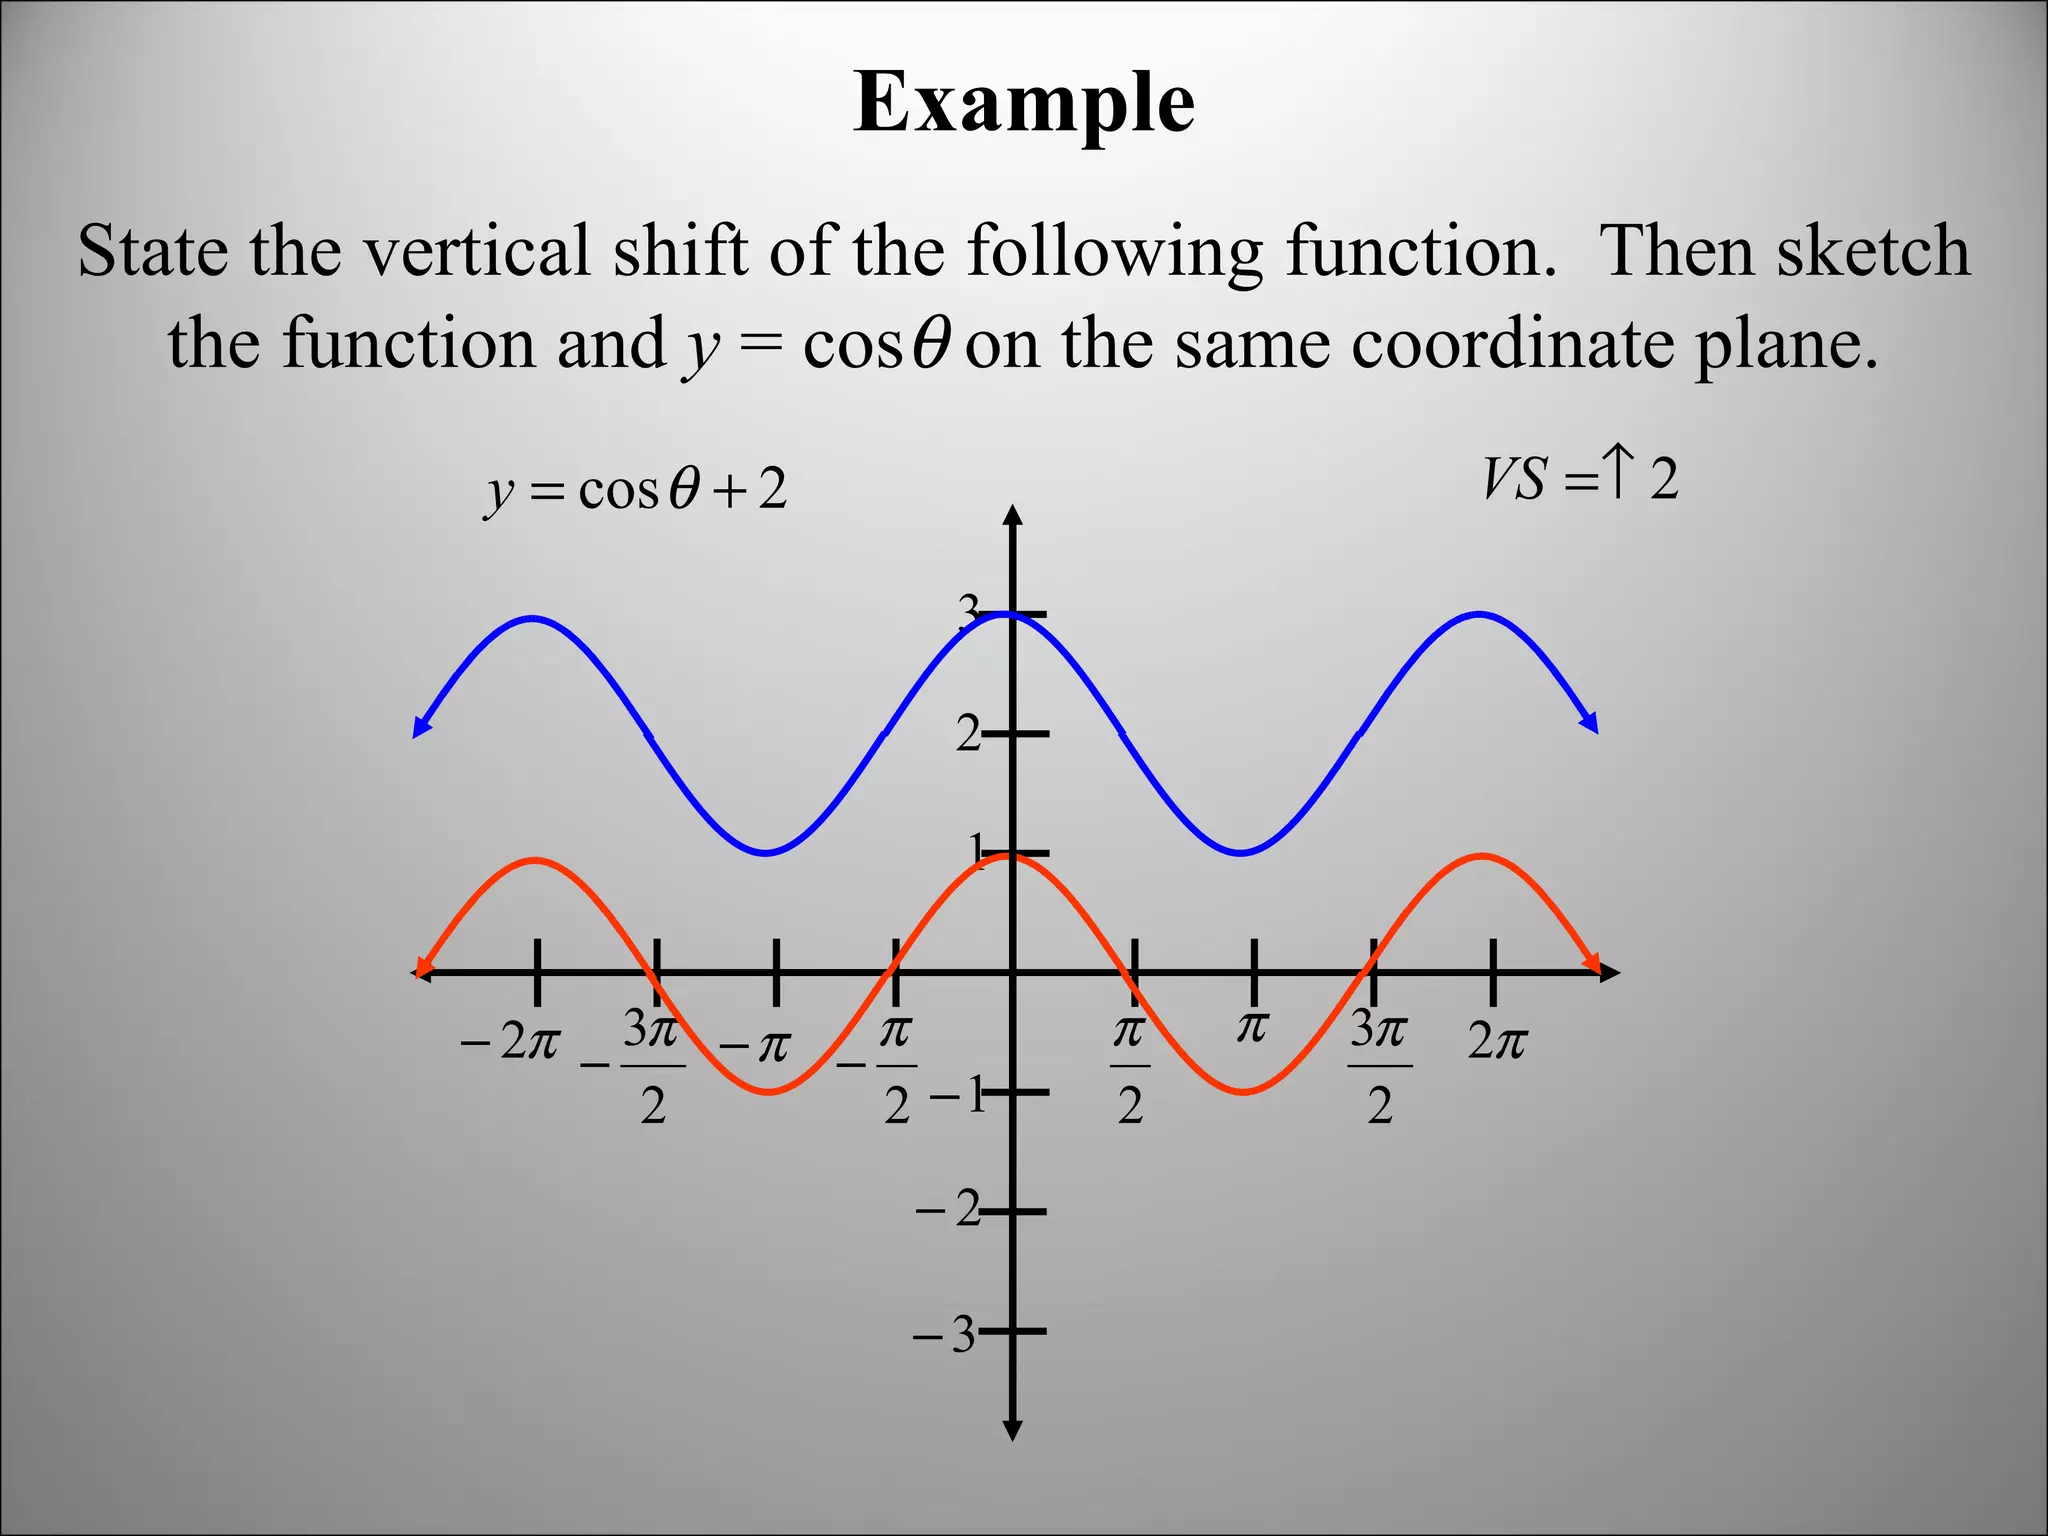
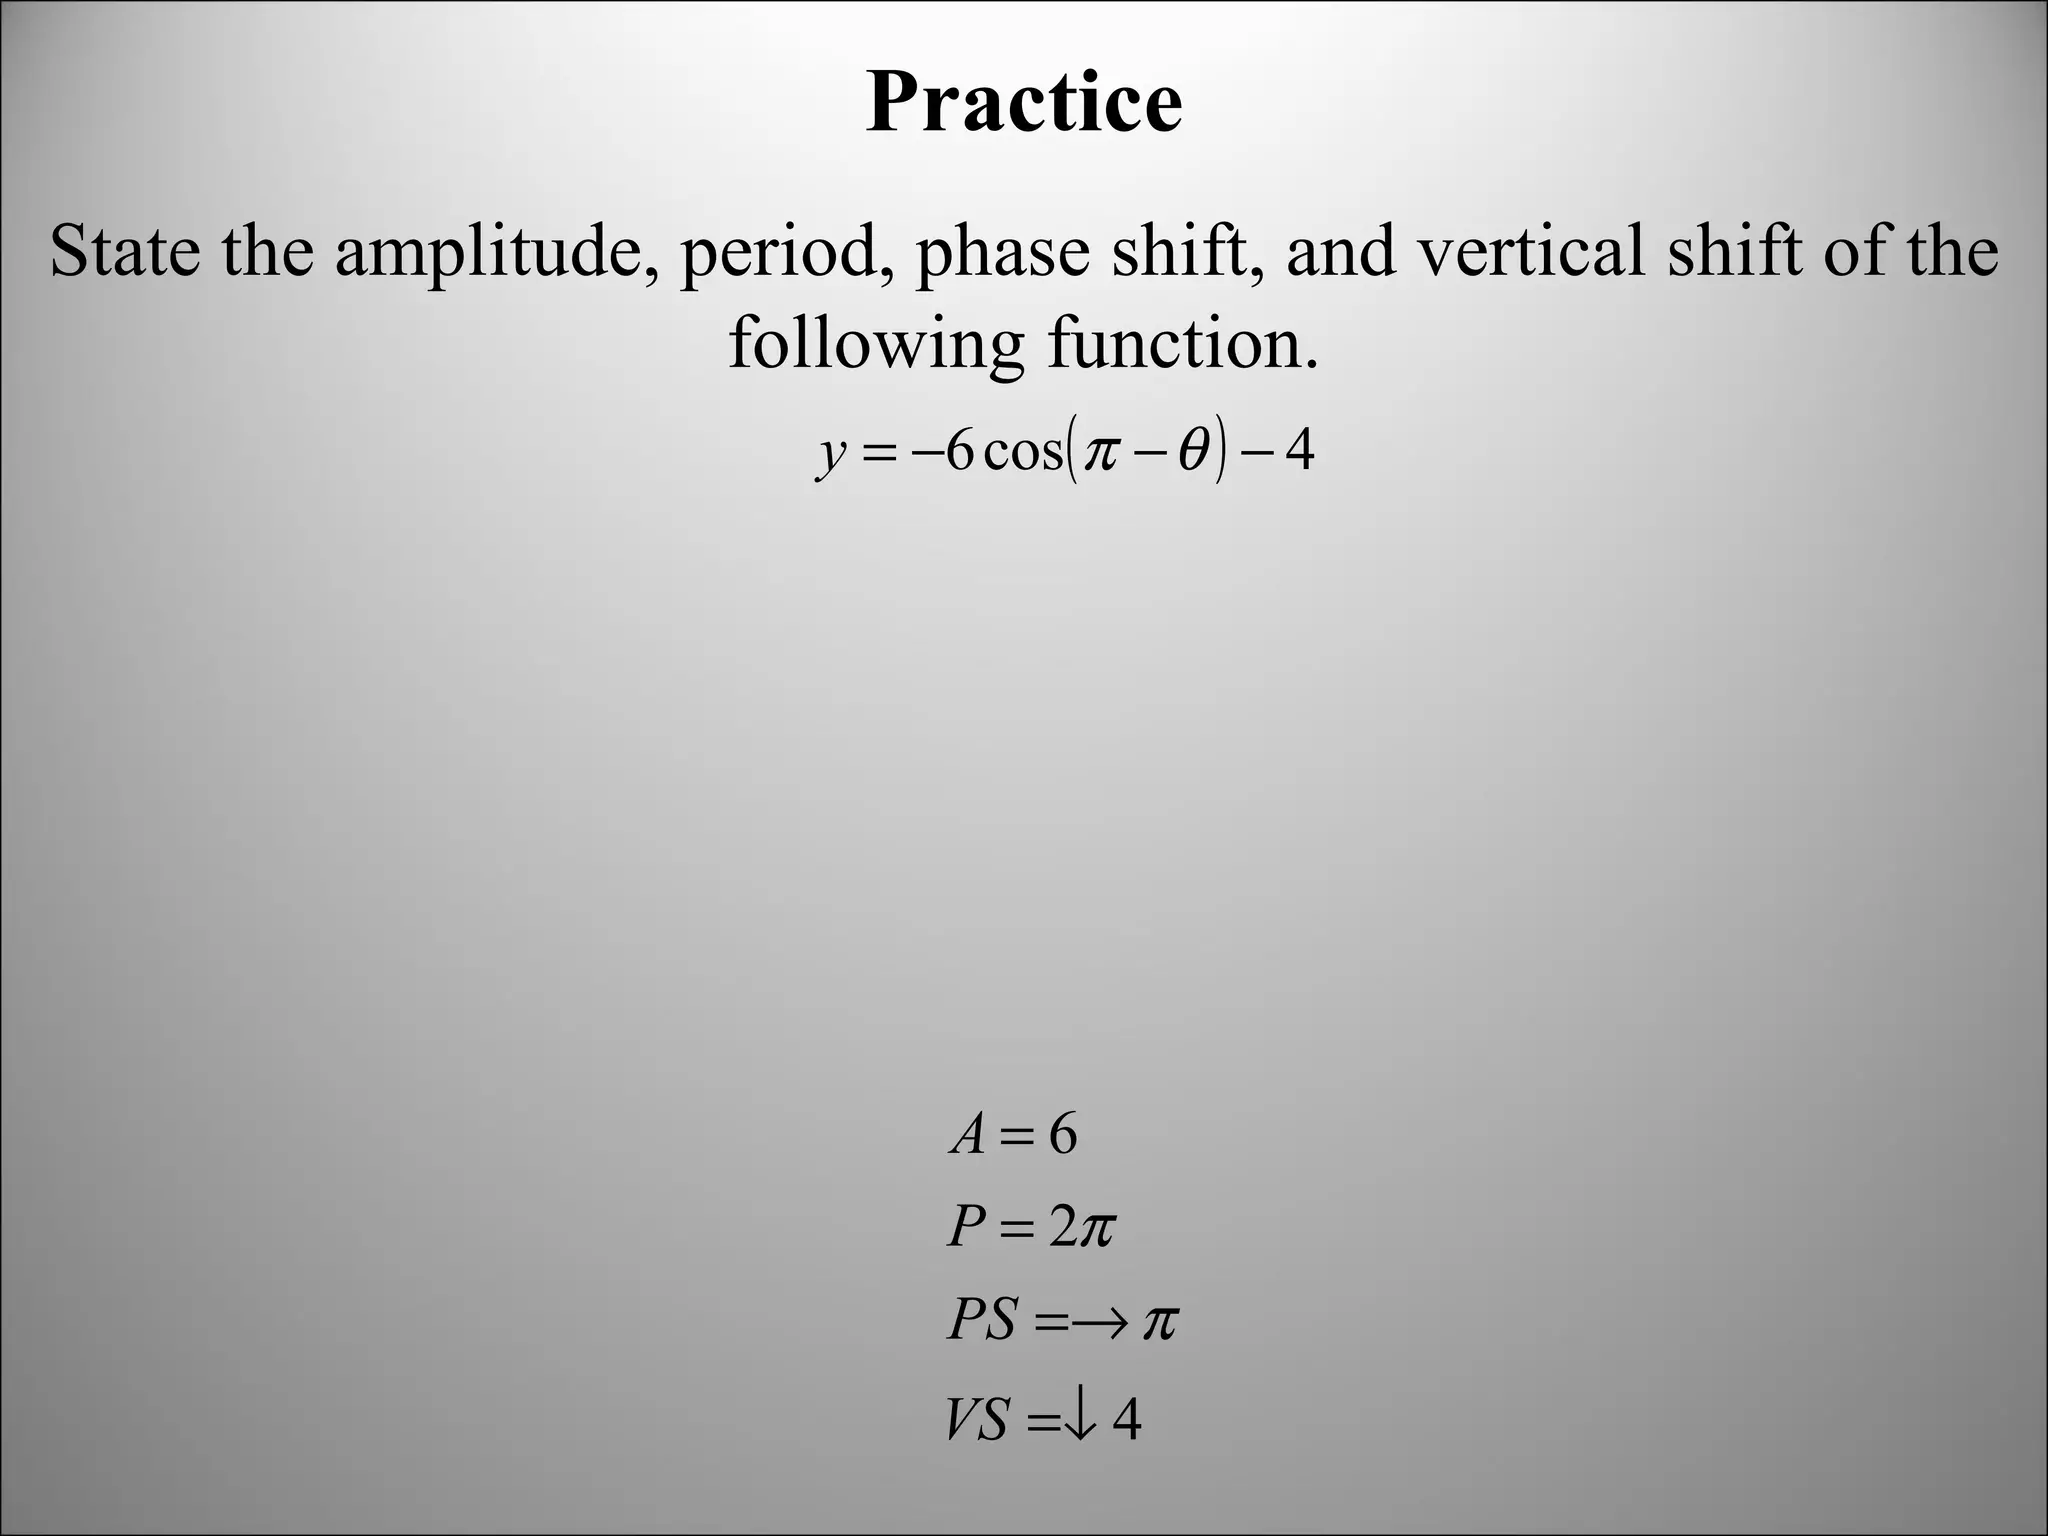
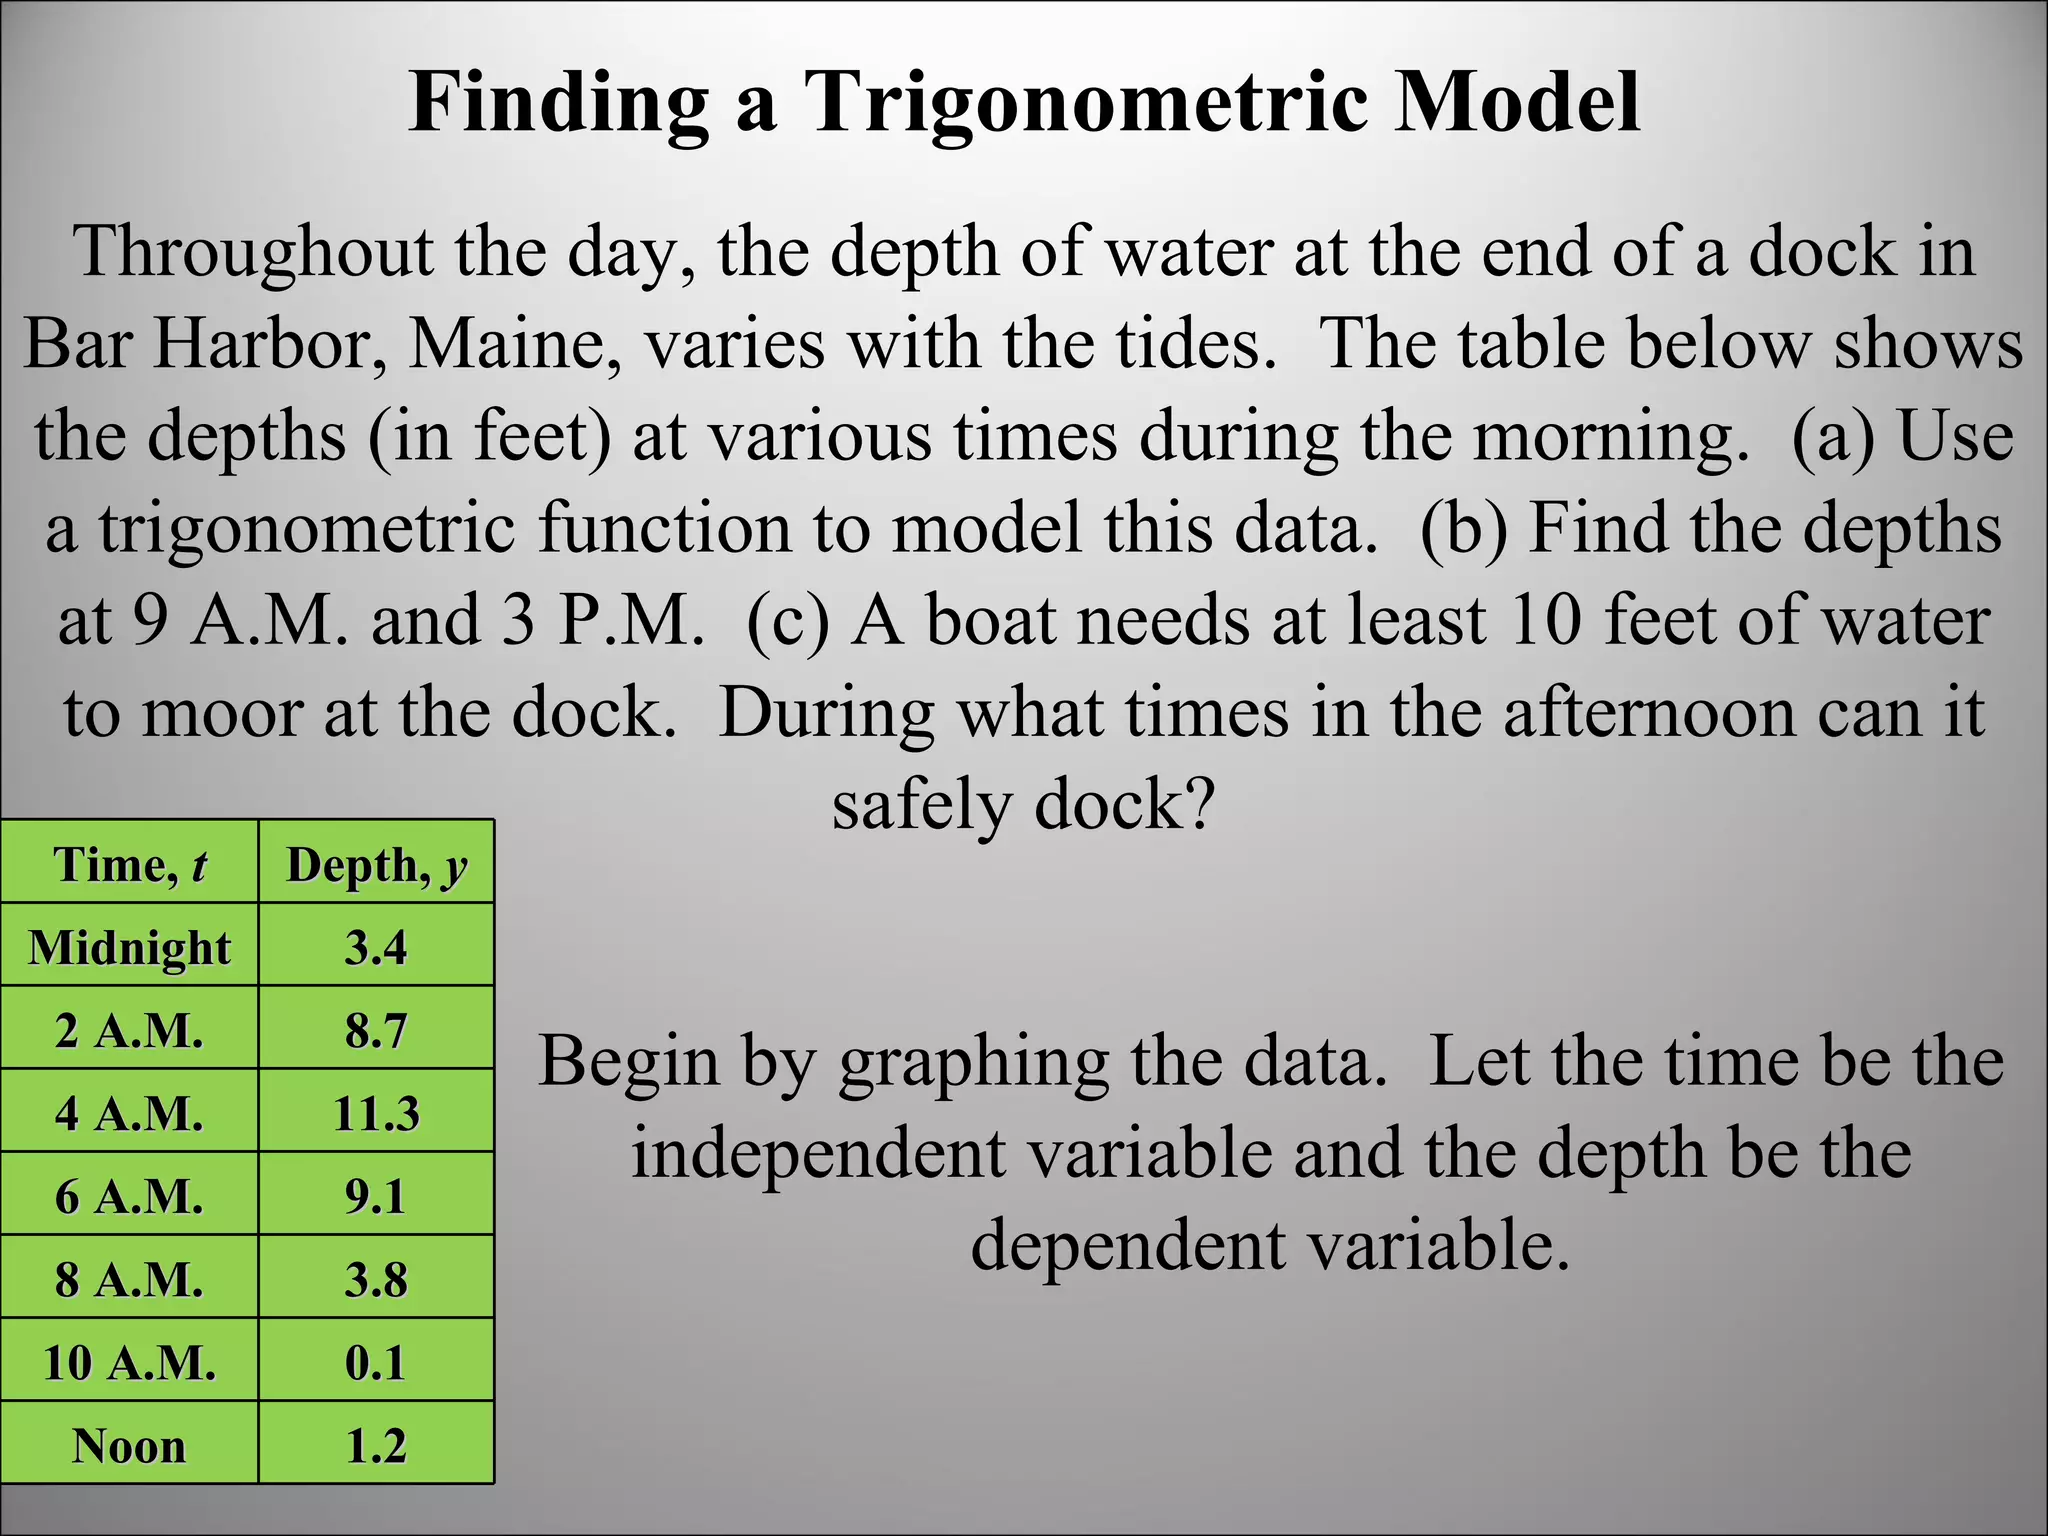
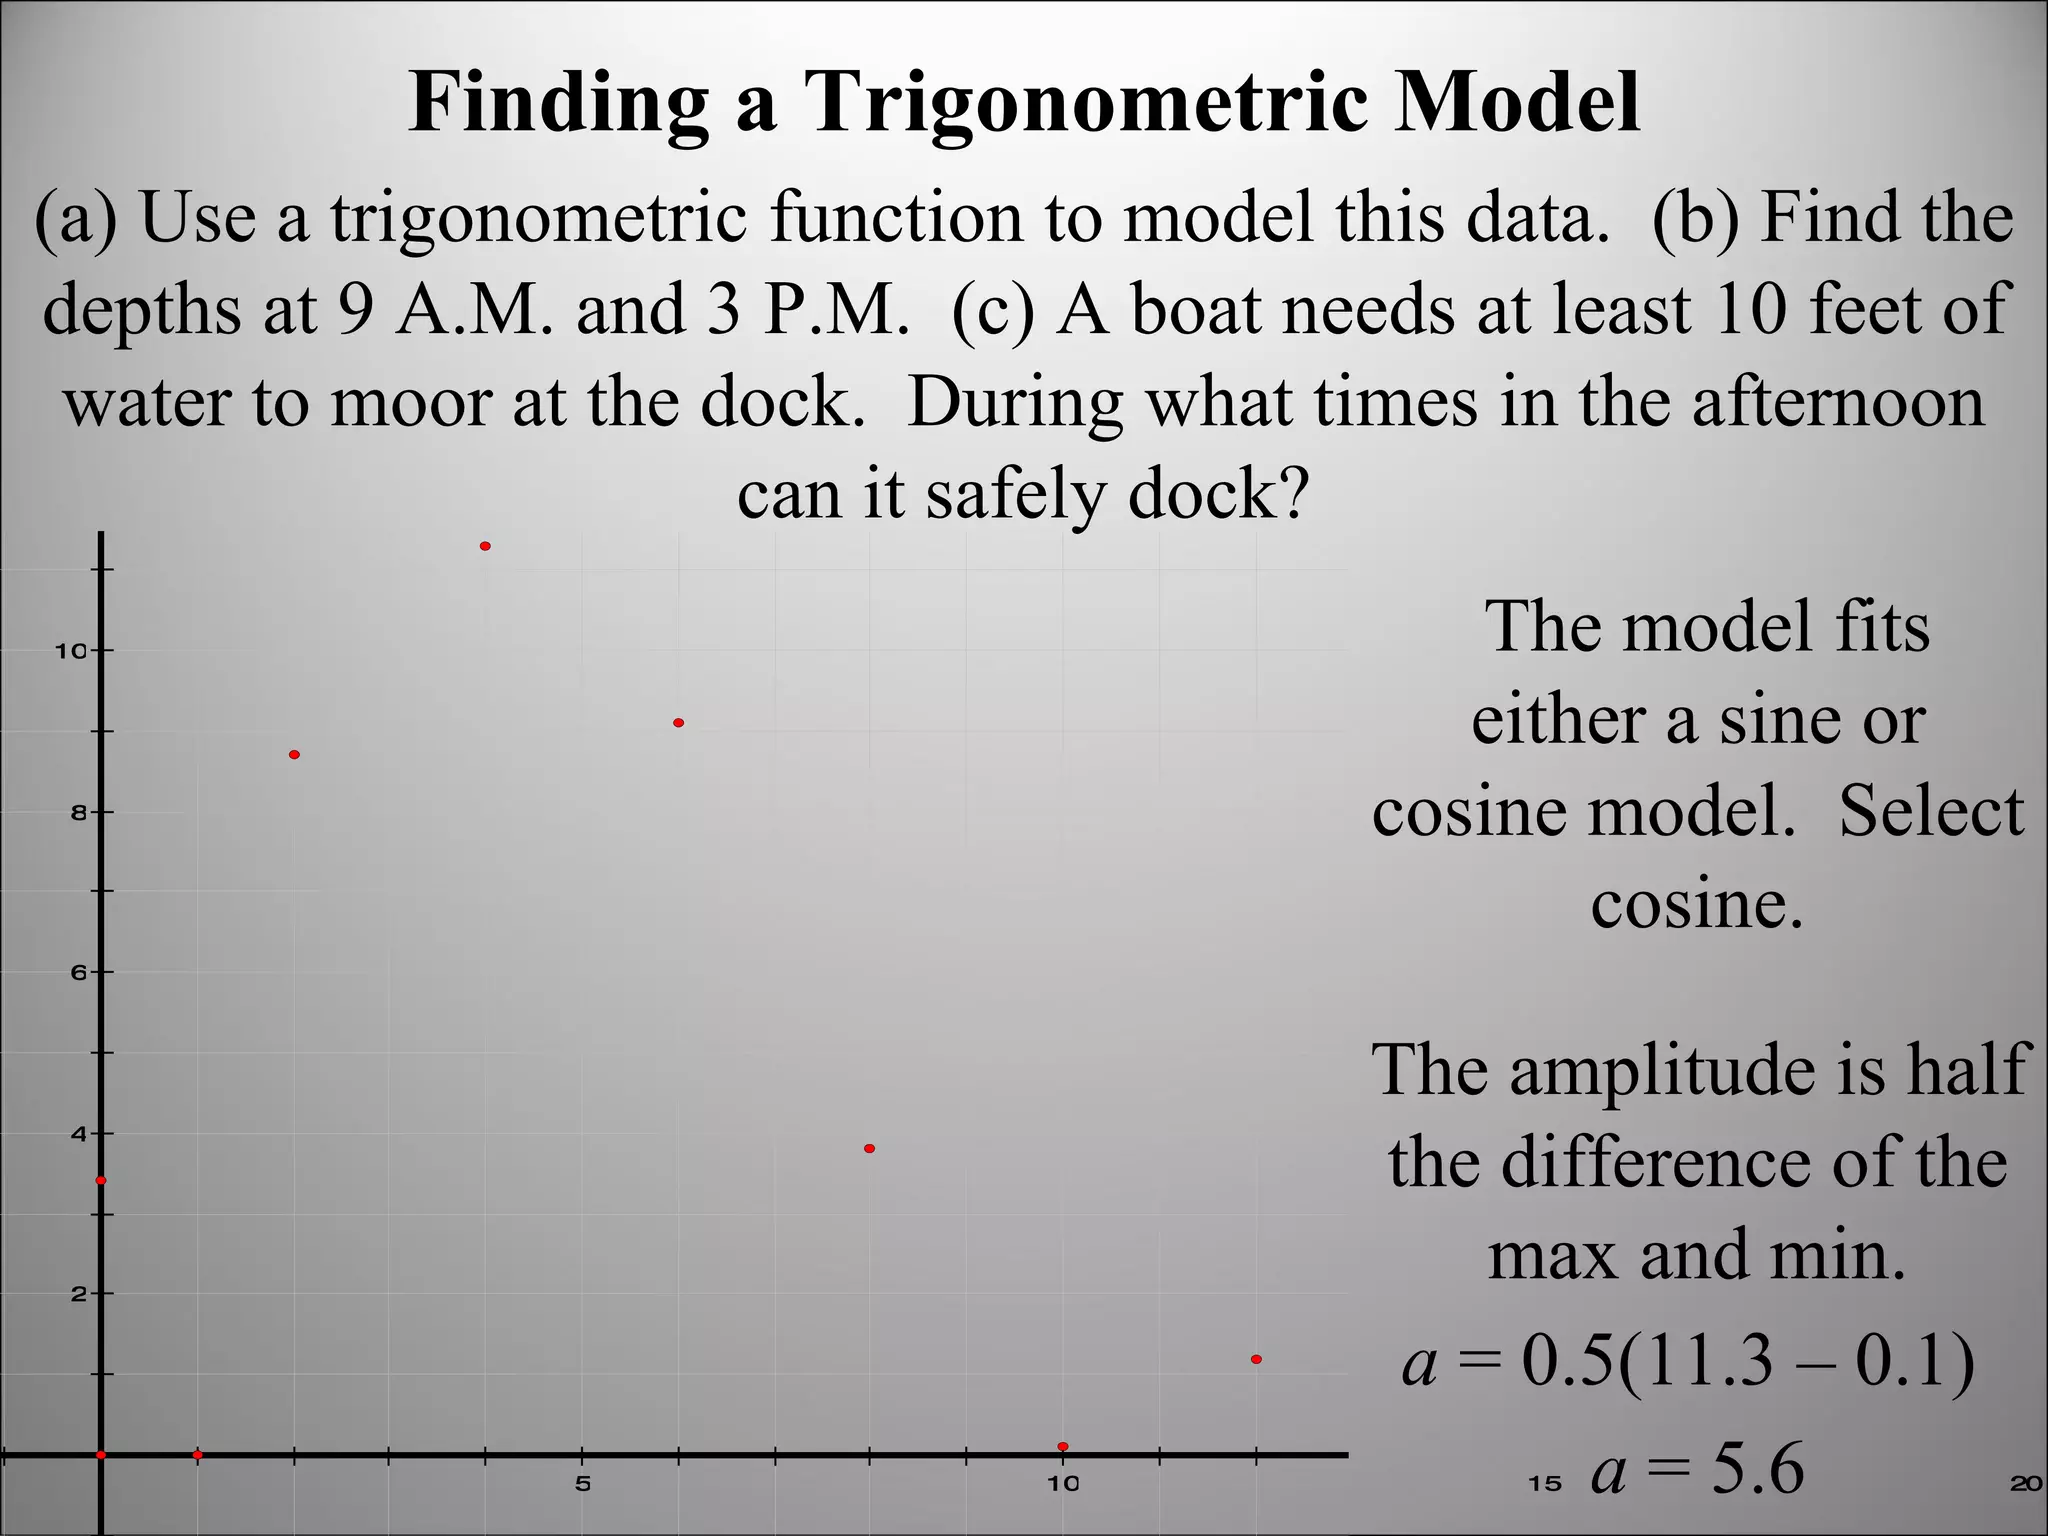
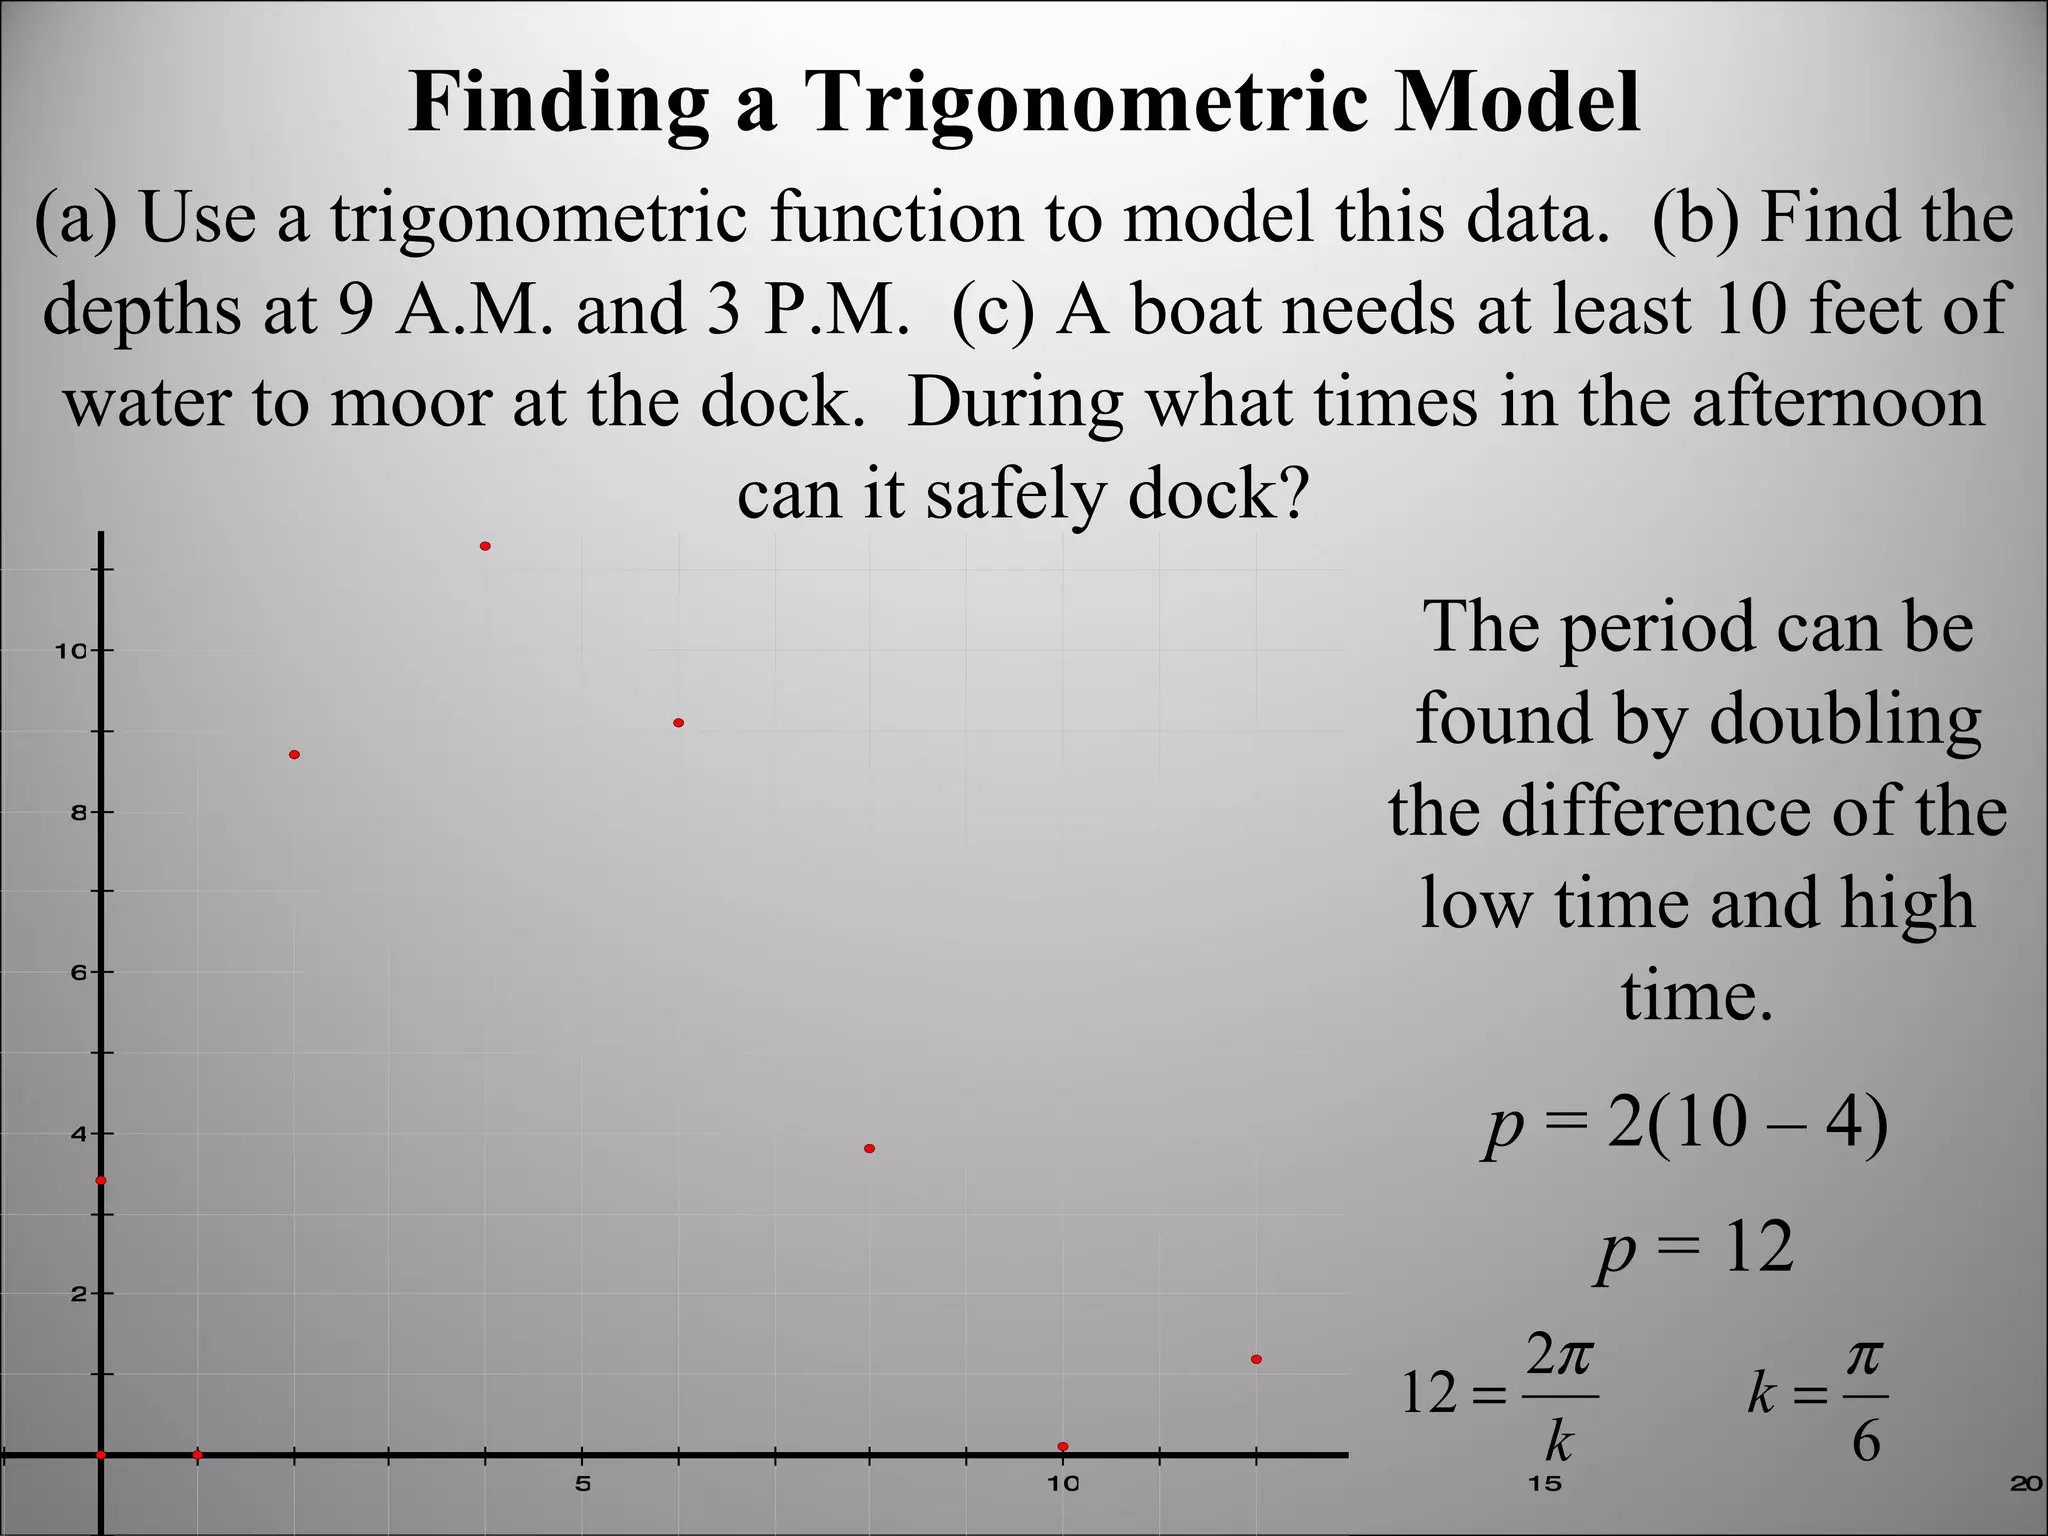
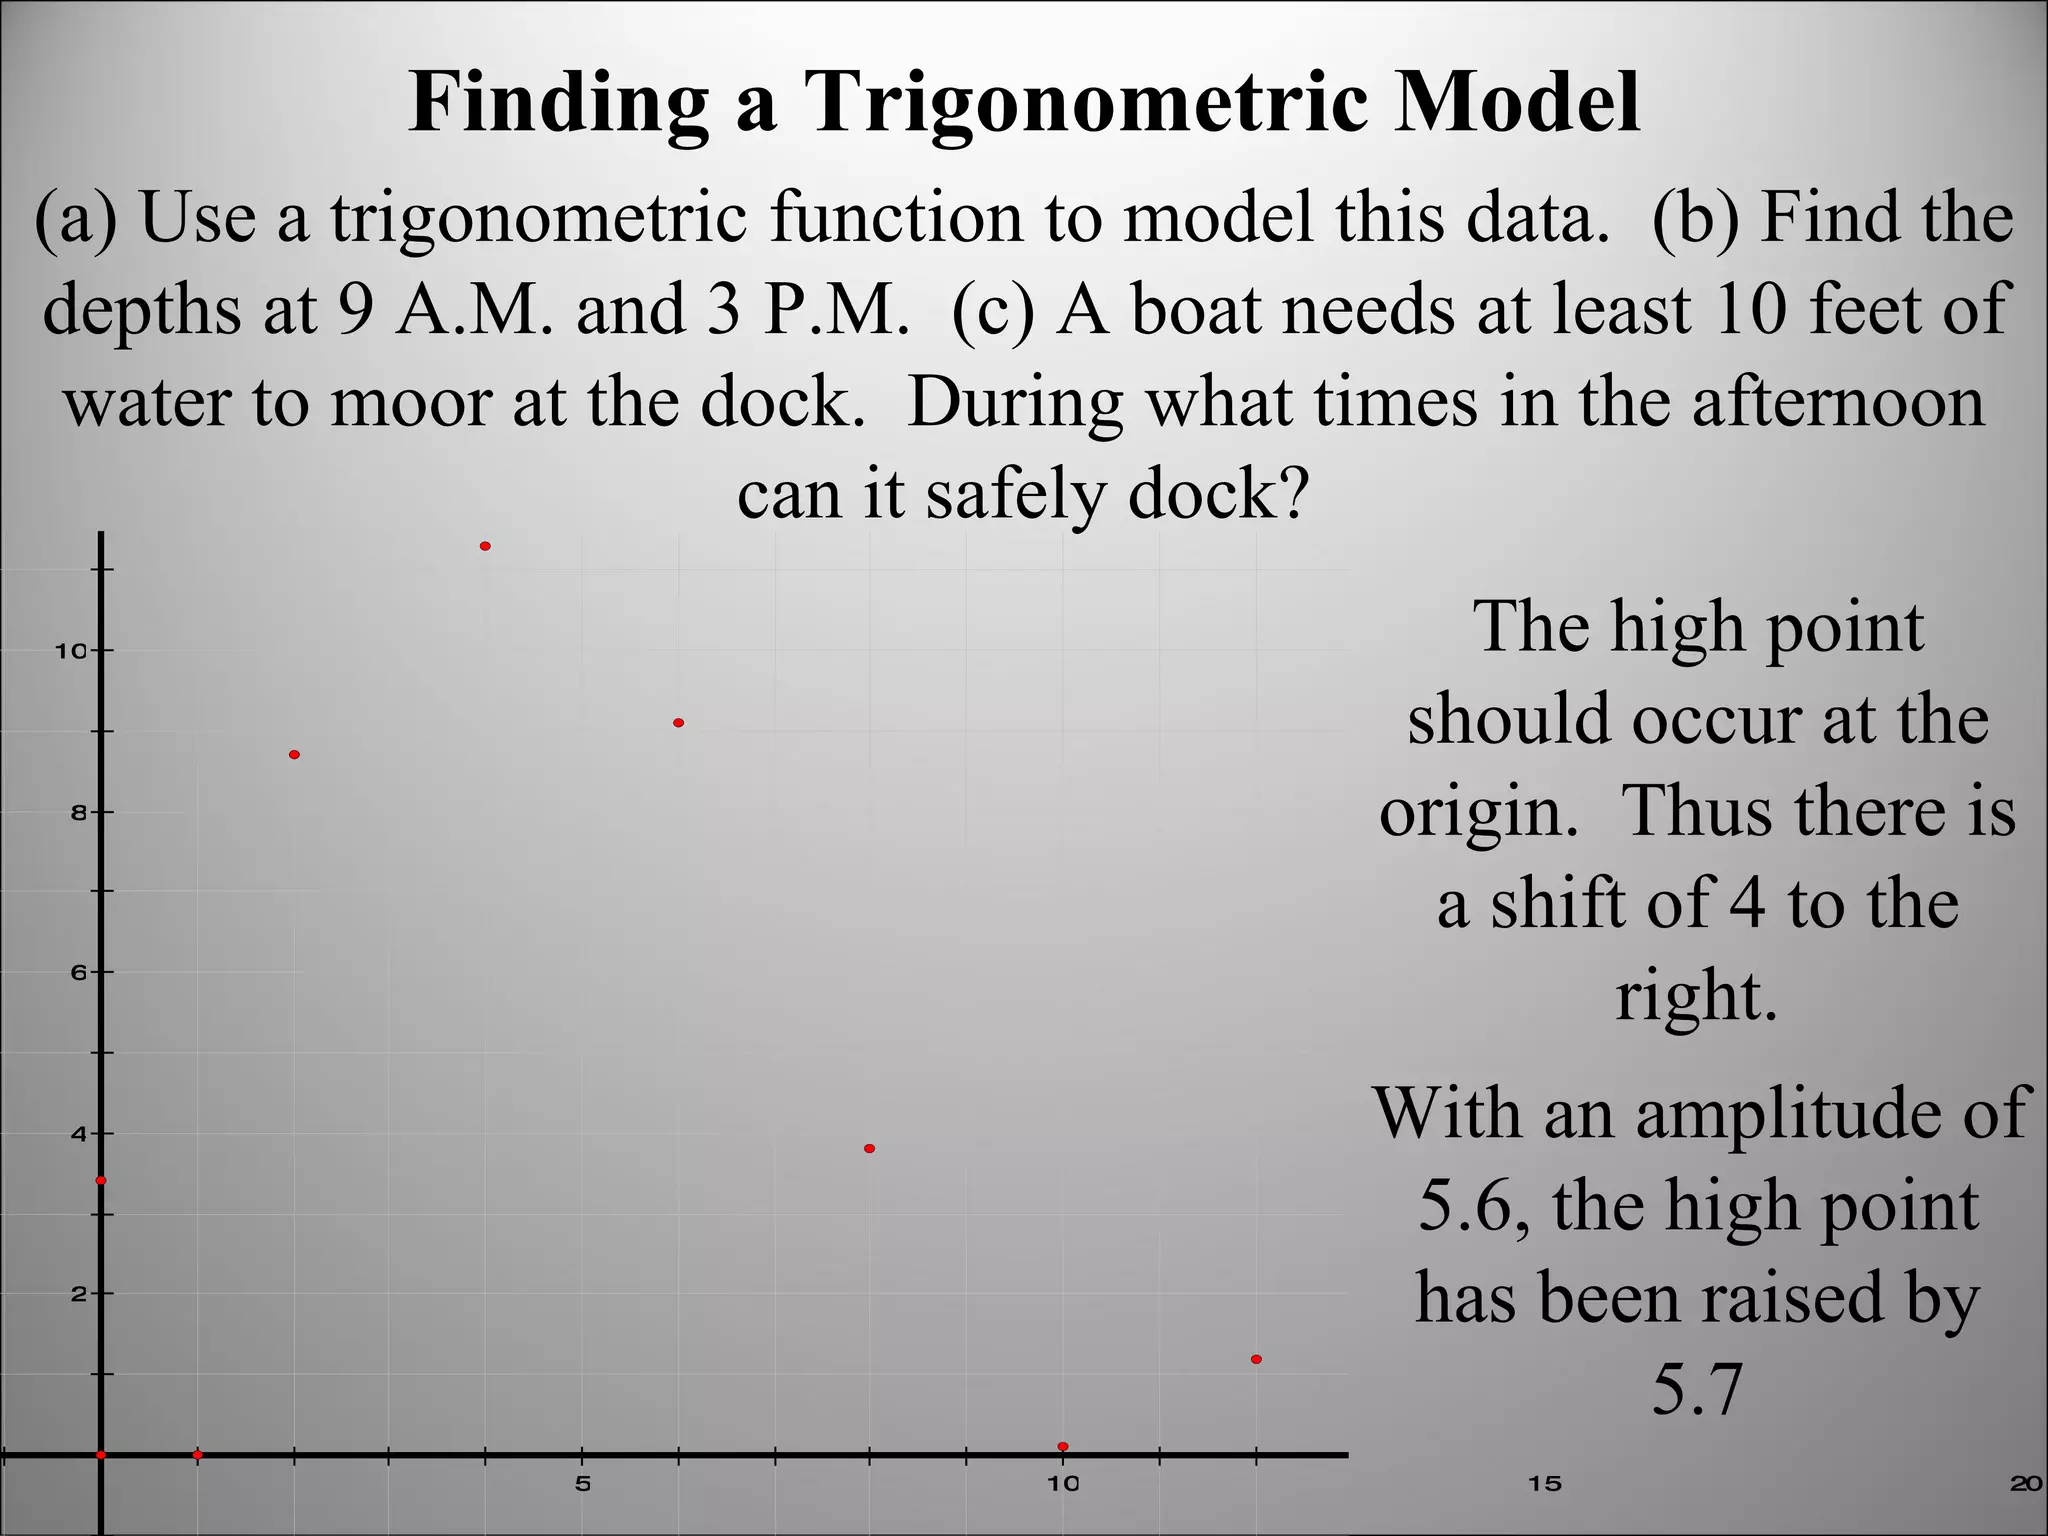
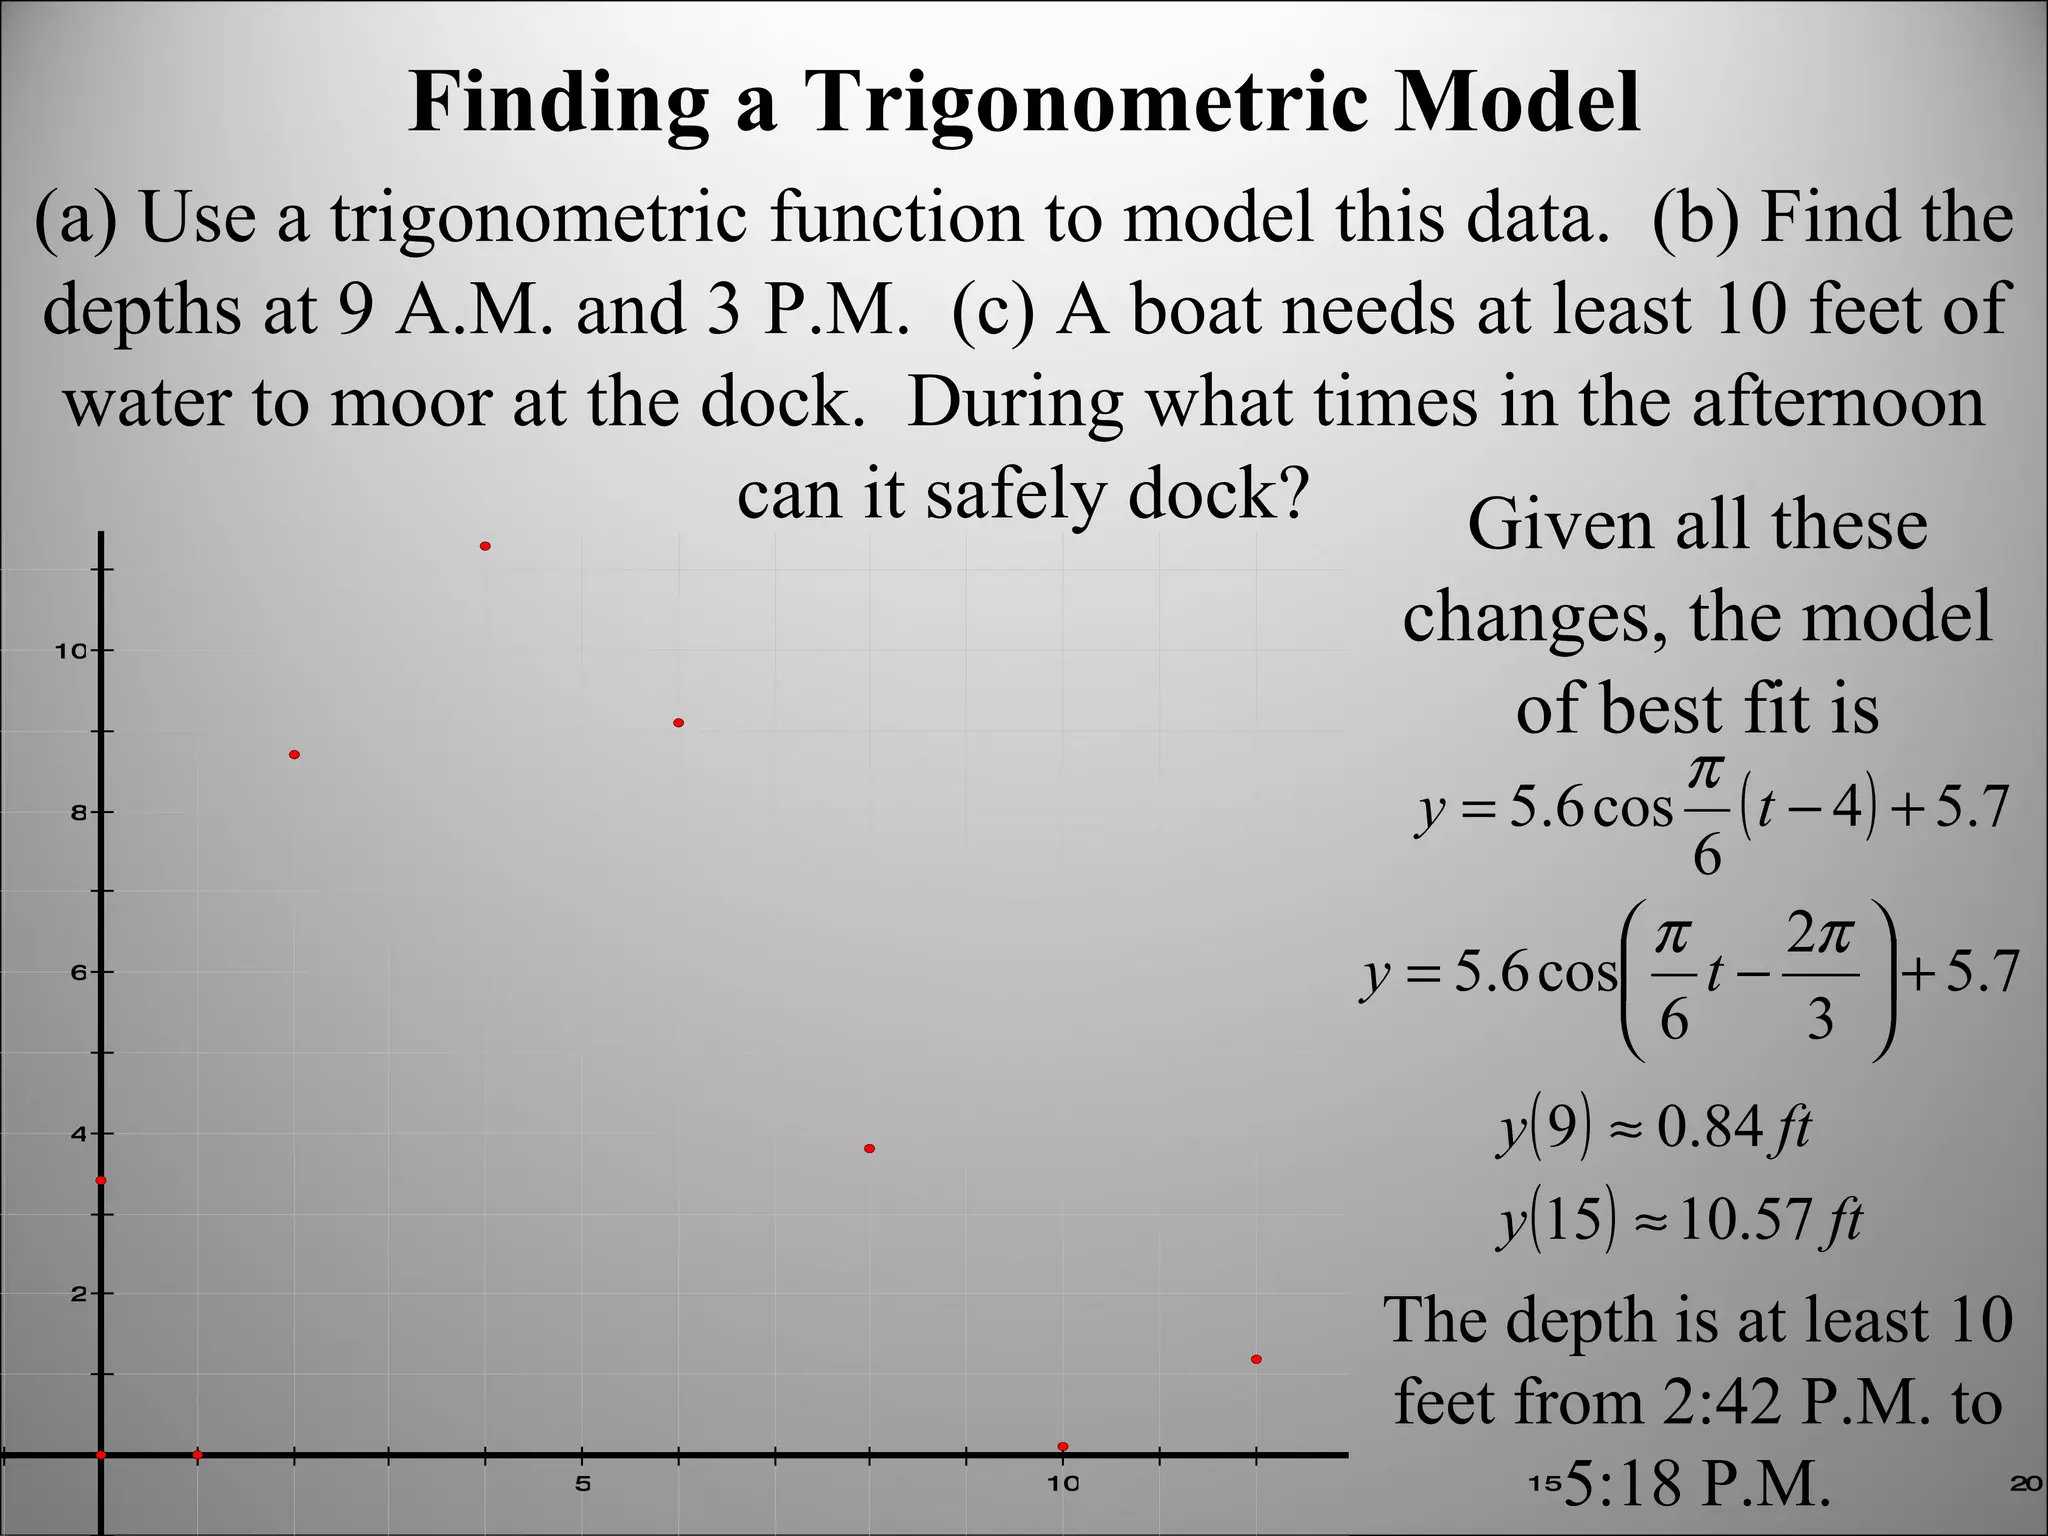

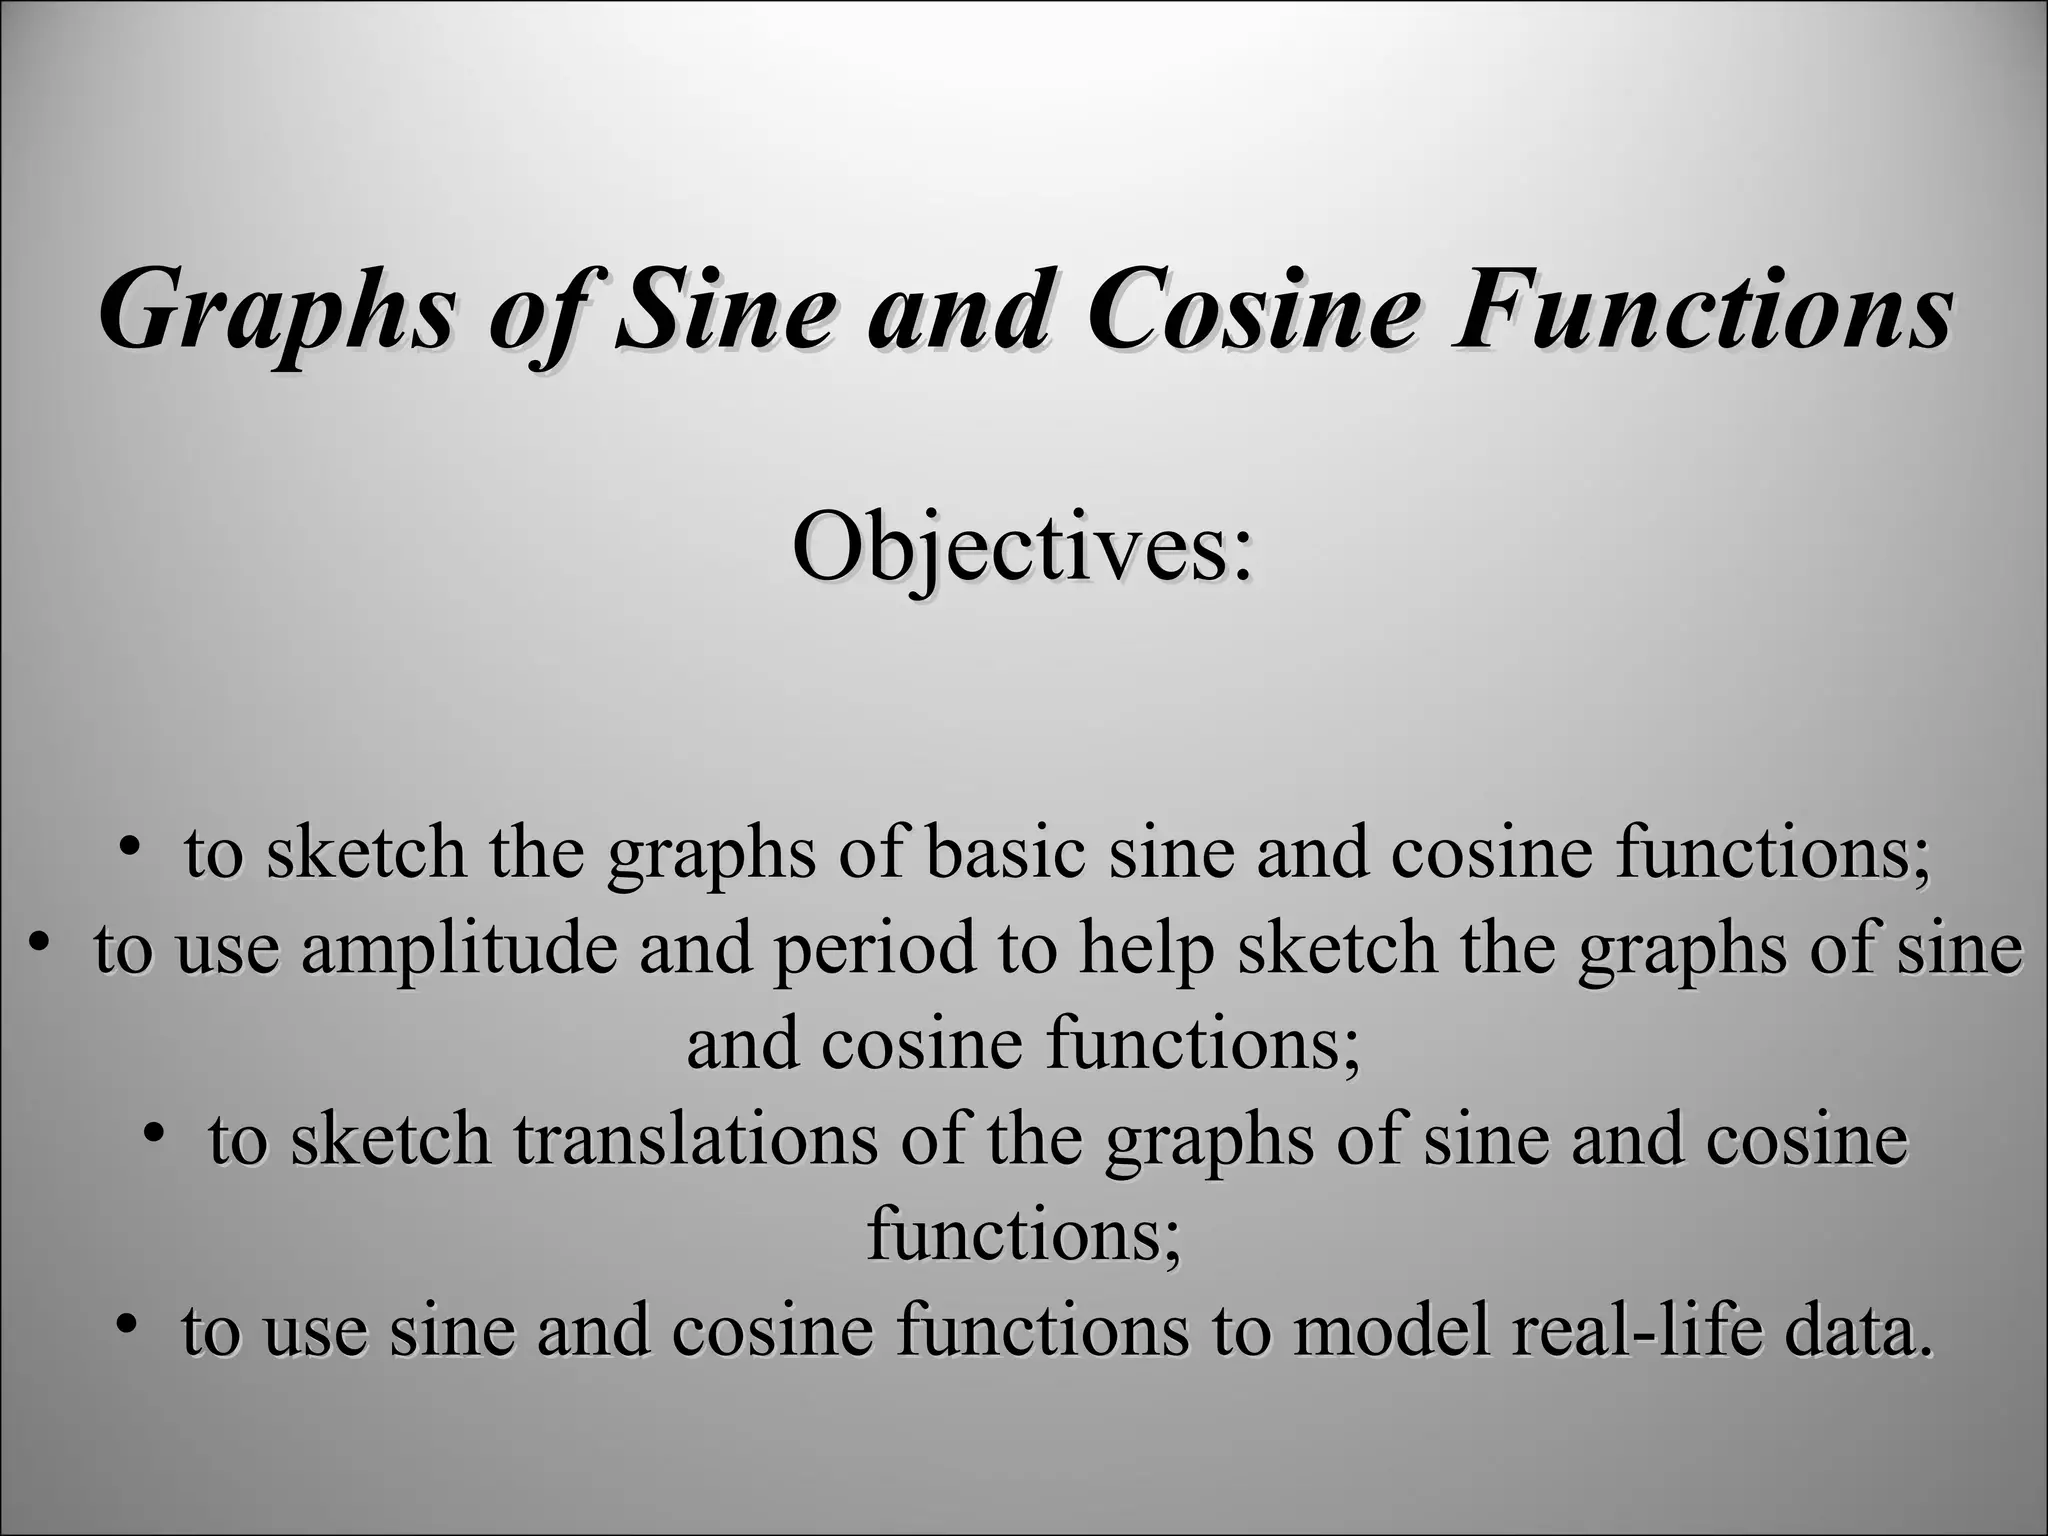
The document discusses trigonometric graphs and identities. It covers graphing sine and cosine functions including amplitude, period, translations involving phase shift and vertical shift. It also provides an example of using trigonometric functions to model real-life tidal data and finds the depth at specific times as well as time periods when a boat can safely dock.