Graph of TangentFunction: Periodic
θ tan θ
−π/2 −∞
−π/4 −1
0 0
π/4 1
π/2 ∞
0 θ
tan θ
−π/2 π/2
One period: π
3π/2
−3π/2
Vertical asymptotes
where cos θ = 0
cos
sin
tan
5.
Graph of CotangentFunction: Periodic
θ tan θ
0 ∞
π/4 1
π/2 0
3π/4 −1
π −∞
3π/2
−3π/2
Vertical asymptotes
where sin θ = 0
sin
cos
cot
π
-π −π/2 π/2
cot θ
6.
Cosecant is thereciprocal of sine
One period: 2π
π 2π 3π
0
−π
−2π
−3π
Vertical asymptotes
where sin θ = 0
θ
csc θ
sin θ
7.
Secant is thereciprocal of cosine
One period: 2π
π 3π
−2π 2π
−π
−3π 0
θ
sec θ
cos θ
Vertical asymptotes
where cos θ = 0
18
State the phaseshift of each function:
1.
2.
Right phase shift 45°
Left phase shift -90°
19.
19
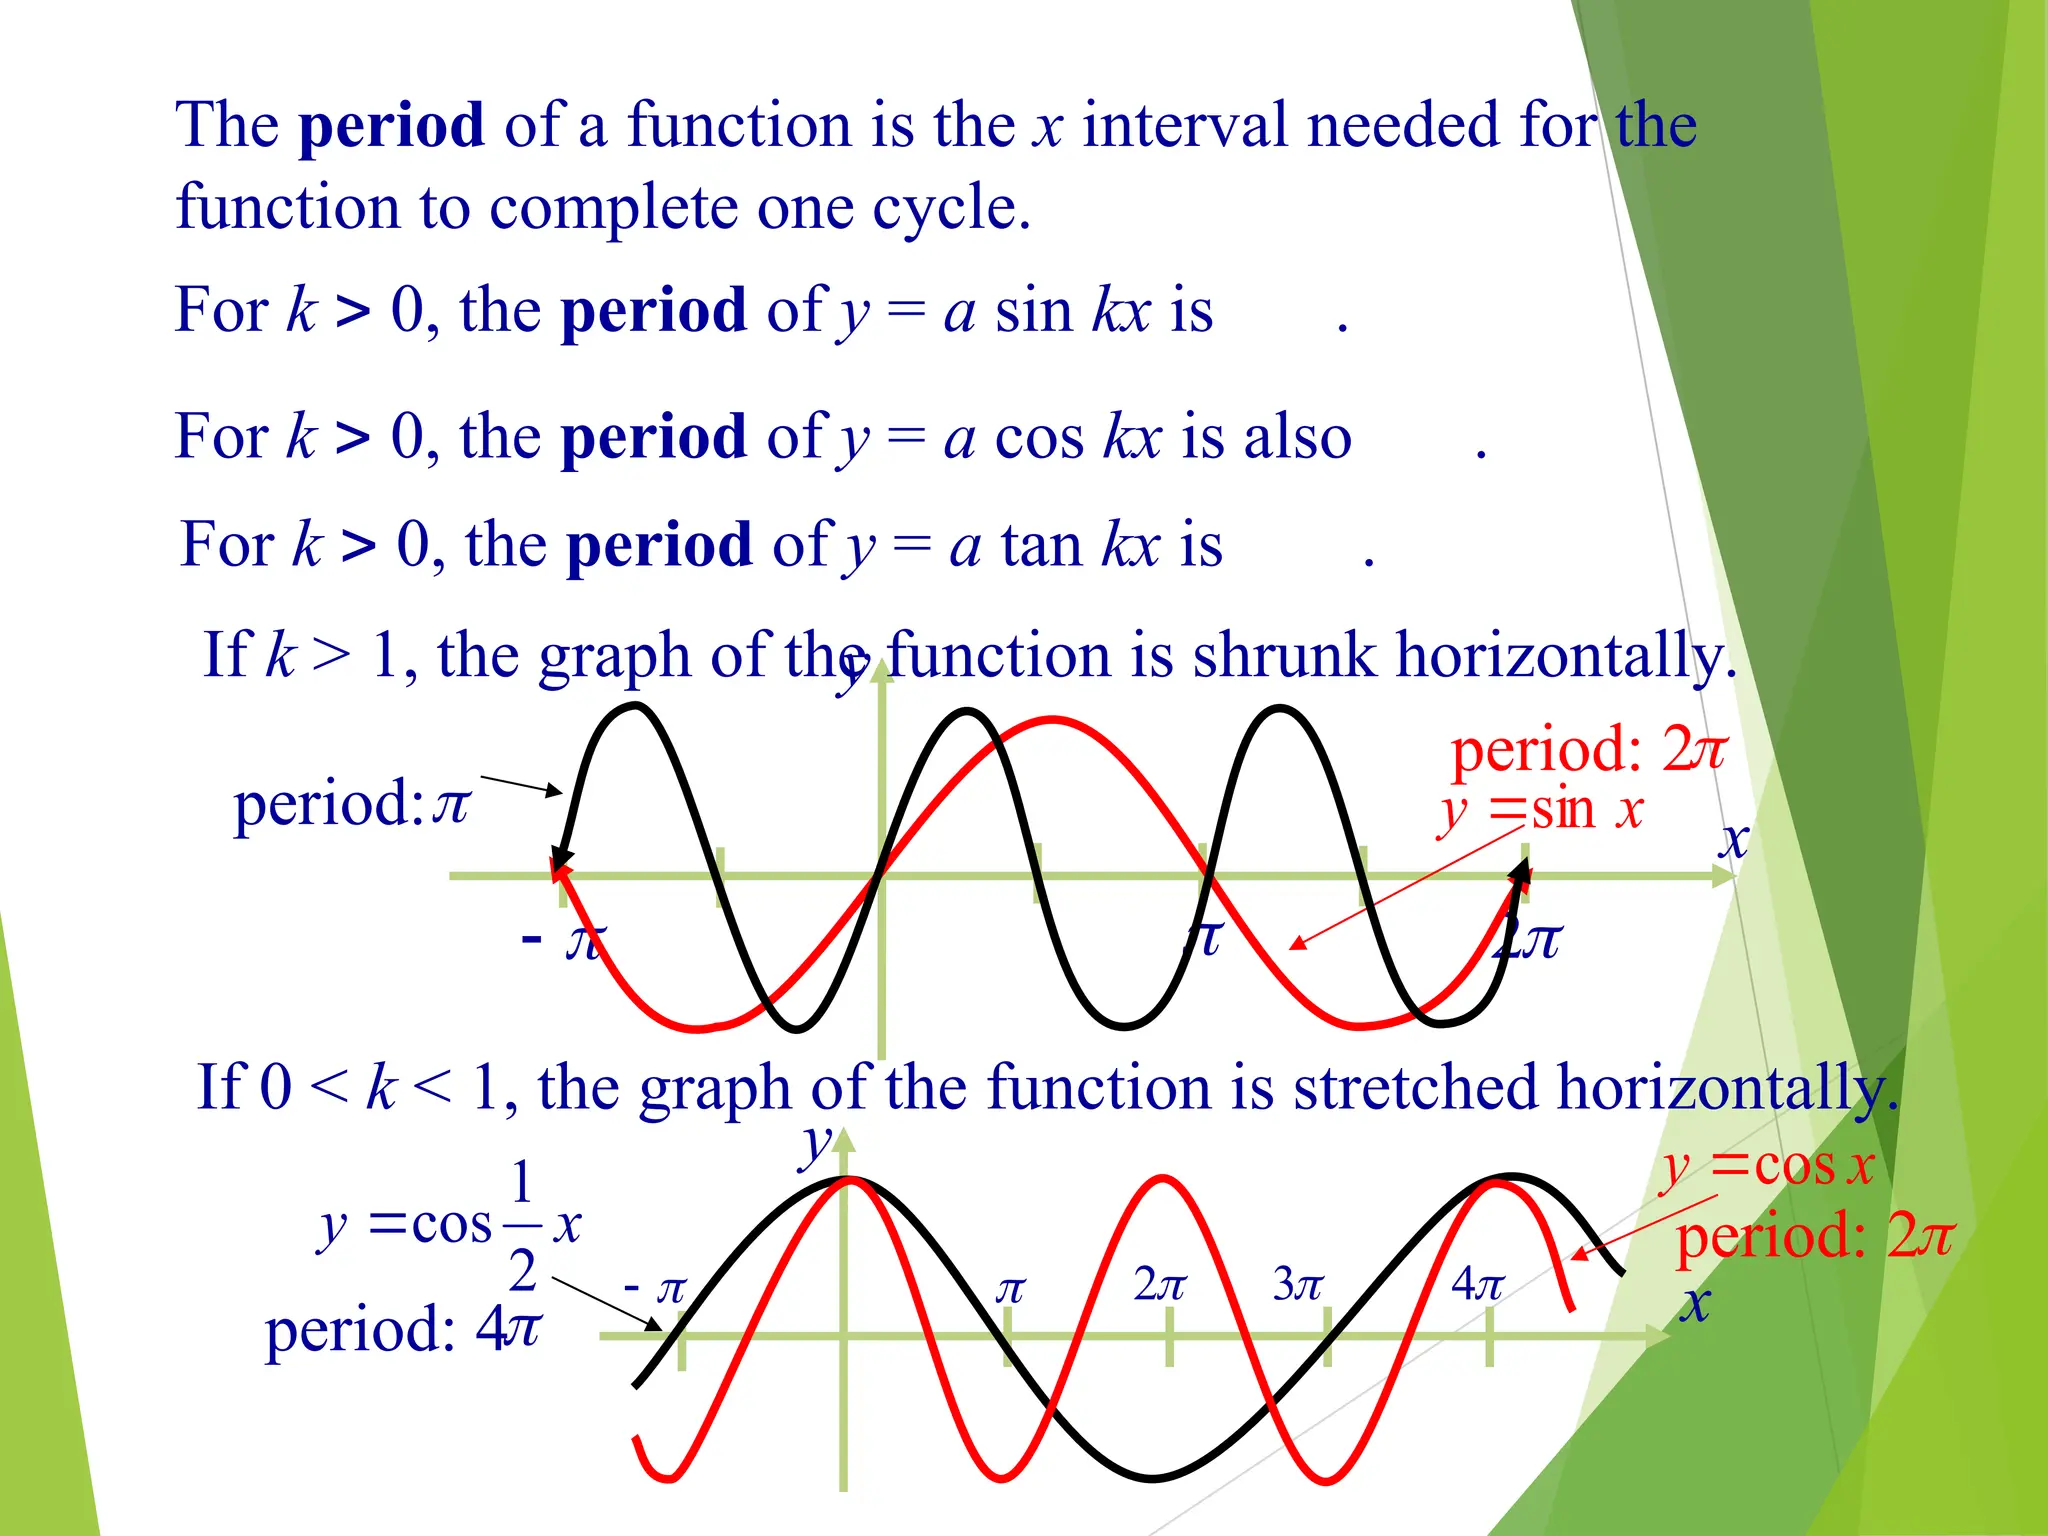
State the amplitude,period, and phase shift of each function:
1.
2.
3.
4.
5.
6.
A = 4, period = 360°,
Phase shift = 0°
A = NONE, period = 45°,
Phase shift = 0°
A = 2, period = 180°,
Phase shift = 0°
A = 4, period = 720°,
Phase shift = 0°
A = NONE, period = 90°,
Phase shift = π/2 Right
A = 3, period = 360°,
Phase shift = 90° Right
20.
20
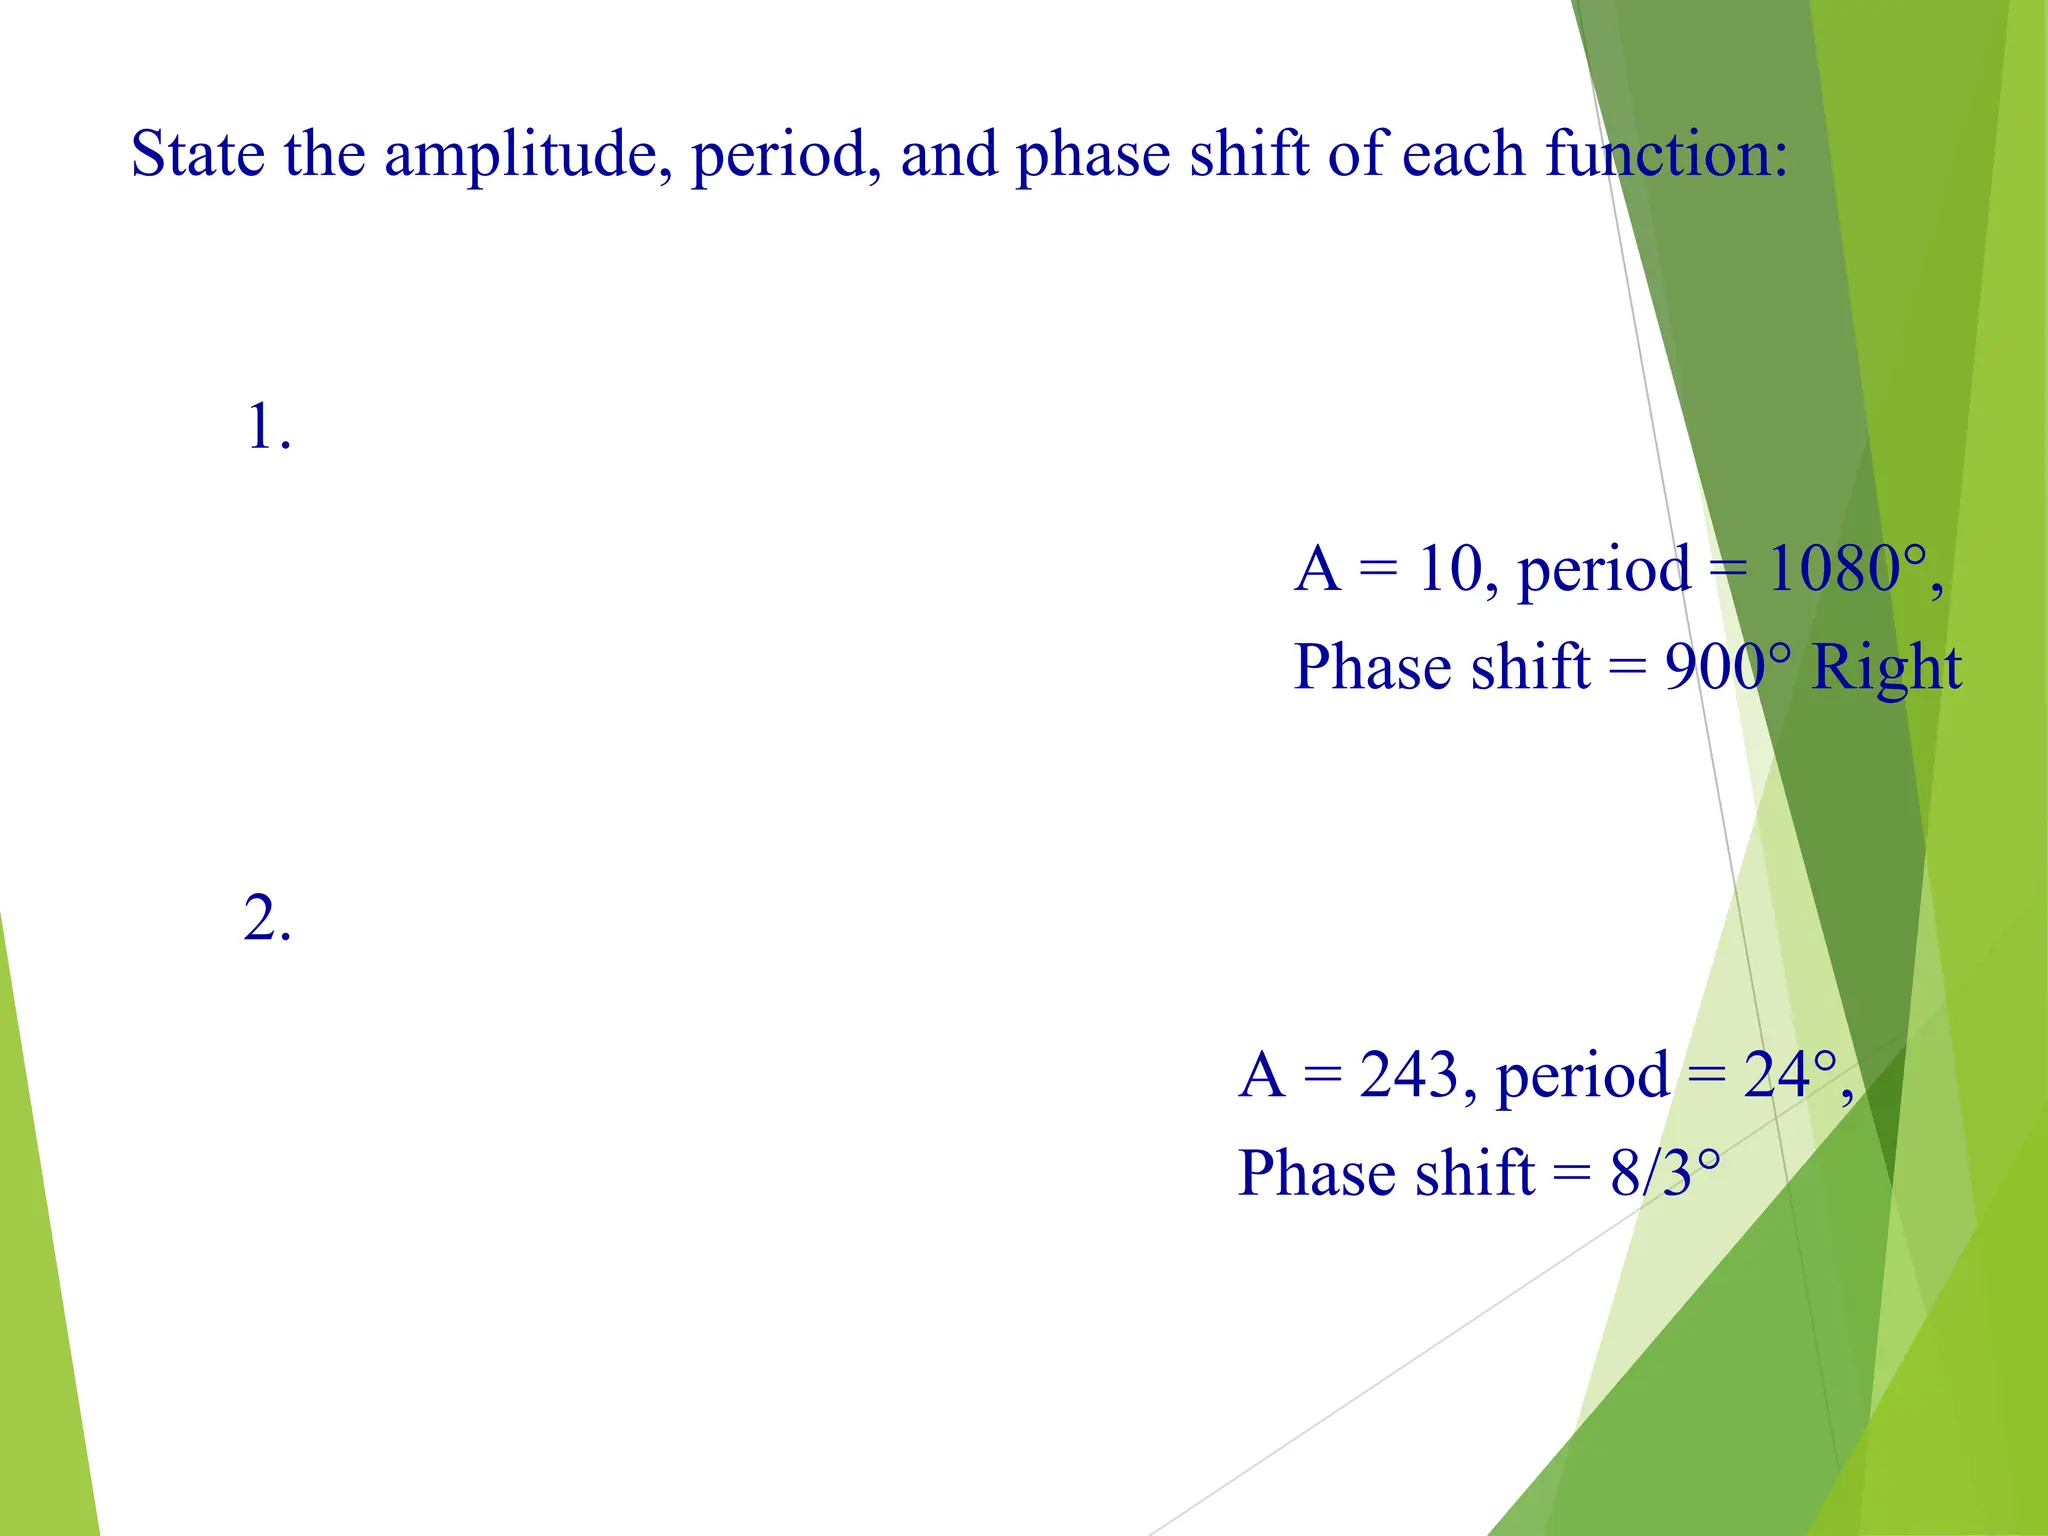
State the amplitude,period, and phase shift of each function:
1.
2.
A = 10, period = 1080°,
Phase shift = 900° Right
A = 243, period = 24°,
Phase shift = 8/3°
21.
21
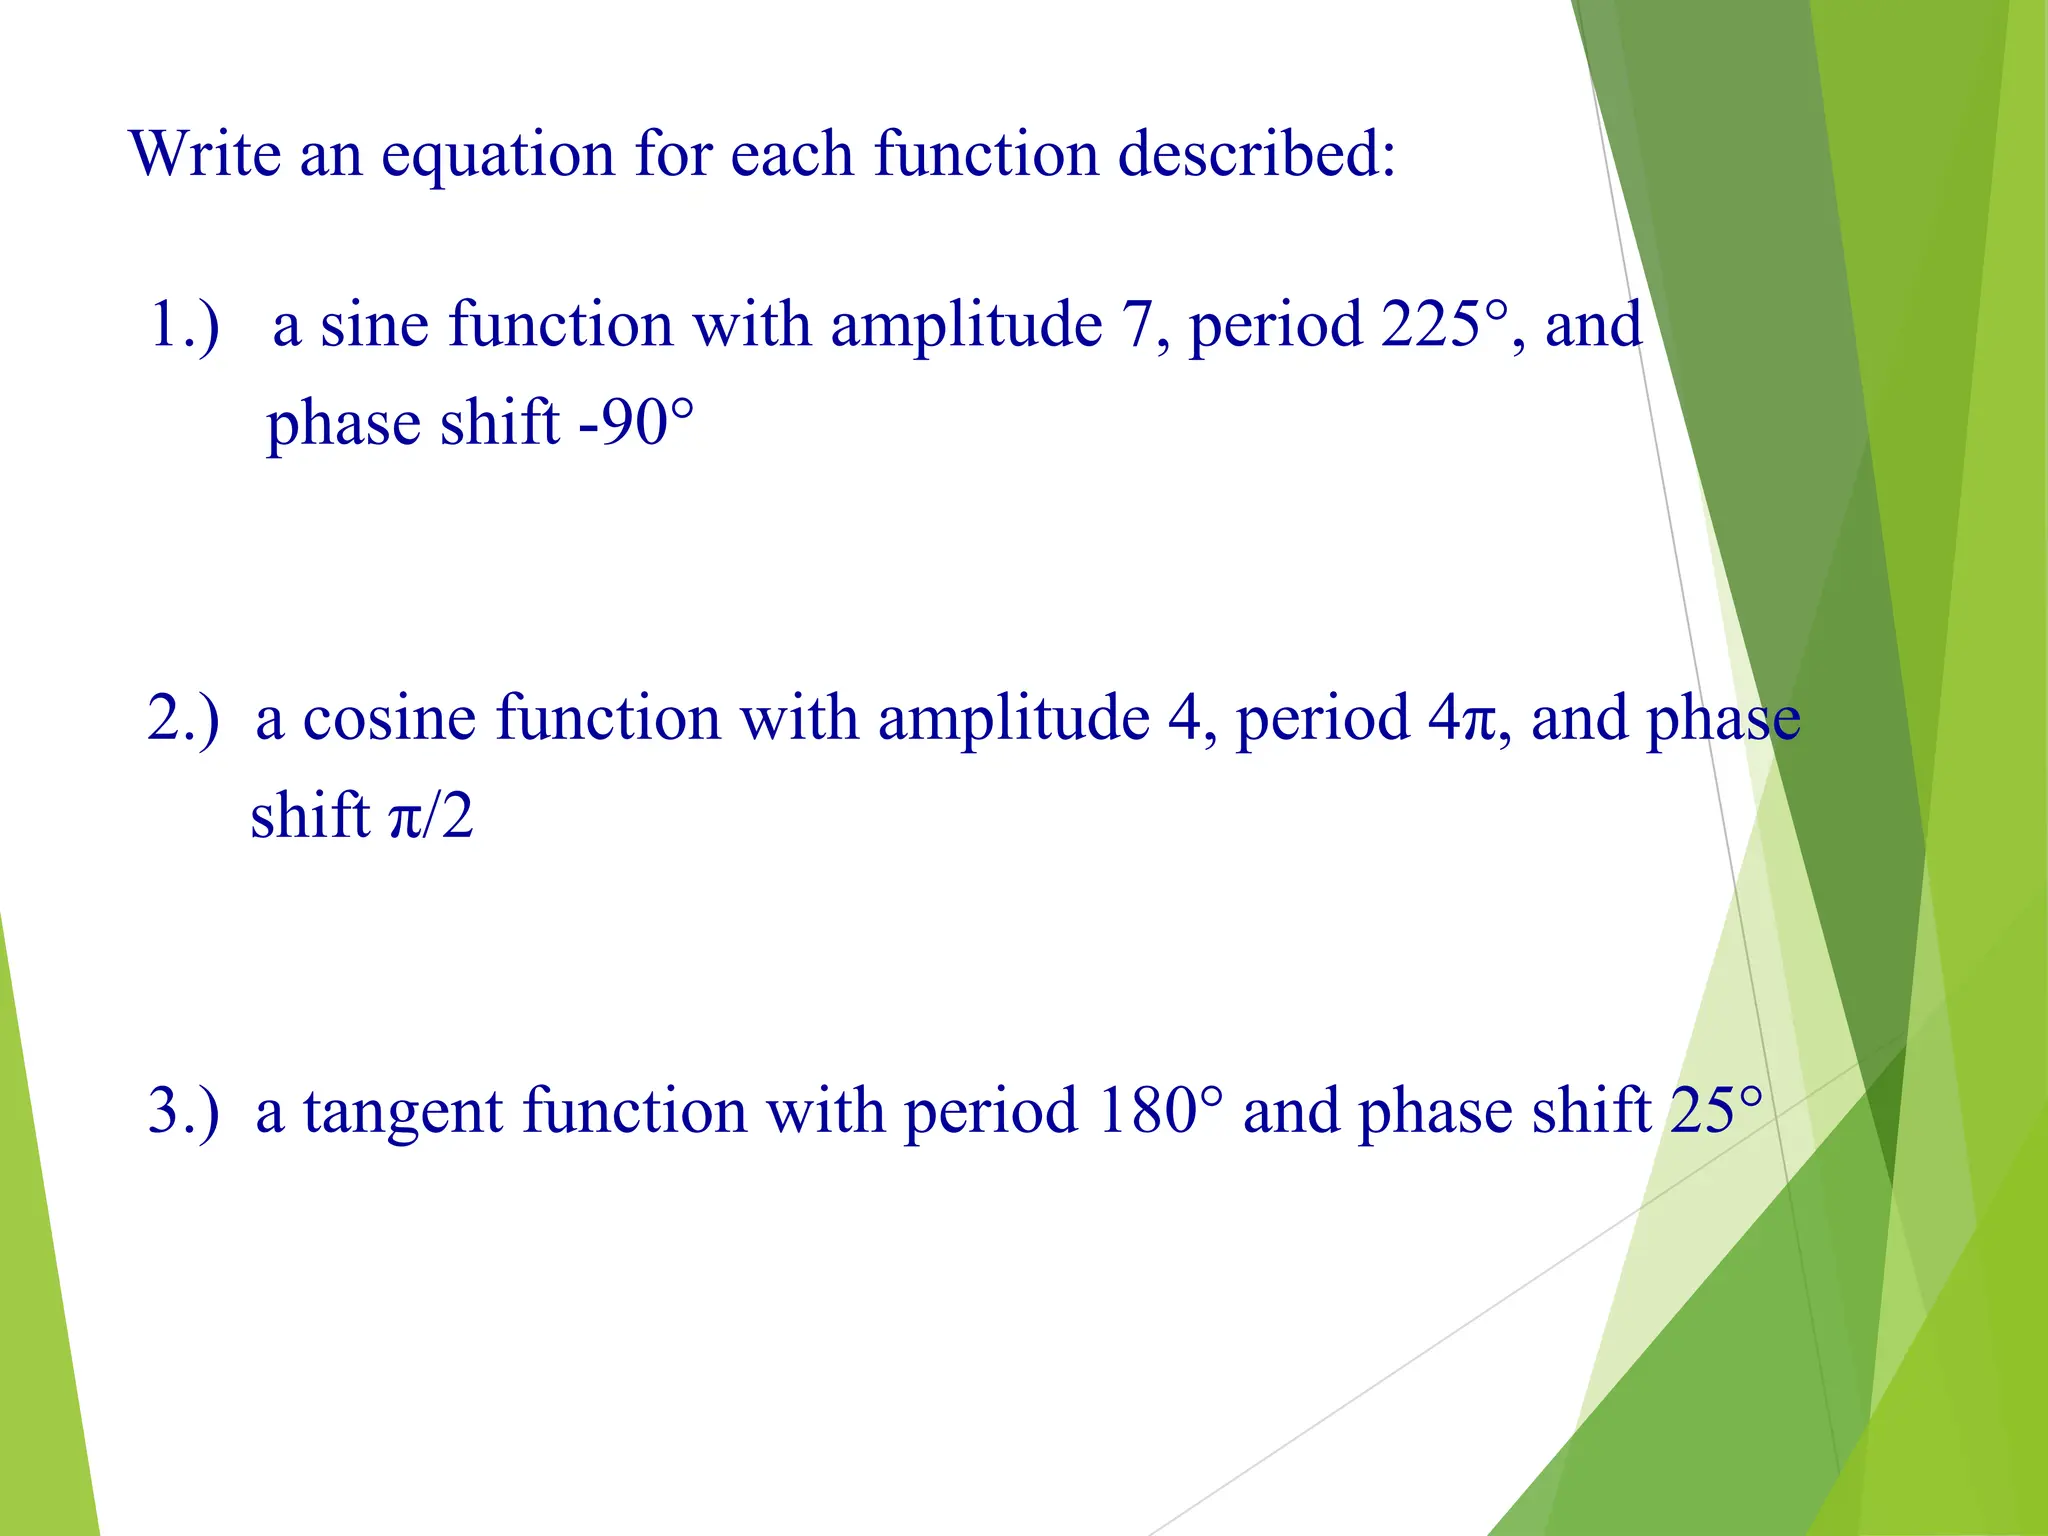
Write an equationfor each function described:
1.) a sine function with amplitude 7, period 225°, and
phase shift -90°
2.) a cosine function with amplitude 4, period 4π, and phase
shift π/2
3.) a tangent function with period 180° and phase shift 25°


![Copyright © by Houghton Mifflin Company, Inc. All rights reserved. 8
y
1
1
2
3
2
x
3
2
4
Example: Sketch the graph of y = 3 cos x on the interval [–, 4].
Partition the interval [-π,4] on your x-axis
max
x-int
min
x-int
max
3
0
-3
0
3
y = 3 cos x
2
0
x 2
2
3
(0, 3)
2
3
( , 0)
( , 0)
2
2
( , 3)
( , –3)](https://image.slidesharecdn.com/erq-250527173134-96945bbb/75/Phase-shift-and-amplitude-of-trigonometric-8-2048.jpg)