The document provides instructions on graphing sine and cosine functions by identifying key points, describing how amplitude, period, and phase shift affect the graph, and giving examples of constructing sinusoidal models from data. It explains how to find the amplitude, period, phase shift, and vertical shift from maximum and minimum values of a periodic function and choose between sine and cosine based on the behavior at a given time. Examples demonstrate modeling tide depth from high and low tide times and depths.
One of the best known mathematical formulas is Pythagorean Theorem,Over 2000 years ago there was an amazing discovery about triangles:
When a triangle has a right angle (90°) and squares are made on each of the three sides,then the biggest square has the exact same area as the other two squares put together! Maths is Fun
Growth in a Finite World - Sustainability and the Exponential FunctionToni Menninger
This presentation, accessible to the general public and specifically designed for students of sustainability, explores the dramatic growth of the human sphere on planet Earth with its limited resources, and presents the mathematical tools for understanding the exponential function.
The lecture is accompanied by the article "Exponential Growth, Doubling Time, and the Rule of 70" (http://www.slideshare.net/amenning/exponential-growthmath) and a collection of practice problems and case studies (http://www.slideshare.net/amenning/exponential-growth-casestudies).
The presentation "The Human Population Challenge" is suitable as a follow-up lecture.
This project work contains all the necessary information for class 12 accountancy project
This Project Contains two part. They are as follows.
1. Principles of Management (Henri Fayol)
2. Marketing Management (On Pickles)
Read| The latest issue of The Challenger is here! We are thrilled to announce that our school paper has qualified for the NATIONAL SCHOOLS PRESS CONFERENCE (NSPC) 2024. Thank you for your unwavering support and trust. Dive into the stories that made us stand out!
Biological screening of herbal drugs: Introduction and Need for
Phyto-Pharmacological Screening, New Strategies for evaluating
Natural Products, In vitro evaluation techniques for Antioxidants, Antimicrobial and Anticancer drugs. In vivo evaluation techniques
for Anti-inflammatory, Antiulcer, Anticancer, Wound healing, Antidiabetic, Hepatoprotective, Cardio protective, Diuretics and
Antifertility, Toxicity studies as per OECD guidelines
Francesca Gottschalk - How can education support child empowerment.pptxEduSkills OECD
Francesca Gottschalk from the OECD’s Centre for Educational Research and Innovation presents at the Ask an Expert Webinar: How can education support child empowerment?
The French Revolution, which began in 1789, was a period of radical social and political upheaval in France. It marked the decline of absolute monarchies, the rise of secular and democratic republics, and the eventual rise of Napoleon Bonaparte. This revolutionary period is crucial in understanding the transition from feudalism to modernity in Europe.
For more information, visit-www.vavaclasses.com
A Strategic Approach: GenAI in EducationPeter Windle
Artificial Intelligence (AI) technologies such as Generative AI, Image Generators and Large Language Models have had a dramatic impact on teaching, learning and assessment over the past 18 months. The most immediate threat AI posed was to Academic Integrity with Higher Education Institutes (HEIs) focusing their efforts on combating the use of GenAI in assessment. Guidelines were developed for staff and students, policies put in place too. Innovative educators have forged paths in the use of Generative AI for teaching, learning and assessments leading to pockets of transformation springing up across HEIs, often with little or no top-down guidance, support or direction.
This Gasta posits a strategic approach to integrating AI into HEIs to prepare staff, students and the curriculum for an evolving world and workplace. We will highlight the advantages of working with these technologies beyond the realm of teaching, learning and assessment by considering prompt engineering skills, industry impact, curriculum changes, and the need for staff upskilling. In contrast, not engaging strategically with Generative AI poses risks, including falling behind peers, missed opportunities and failing to ensure our graduates remain employable. The rapid evolution of AI technologies necessitates a proactive and strategic approach if we are to remain relevant.
How to Make a Field invisible in Odoo 17Celine George
It is possible to hide or invisible some fields in odoo. Commonly using “invisible” attribute in the field definition to invisible the fields. This slide will show how to make a field invisible in odoo 17.
Acetabularia Information For Class 9 .docxvaibhavrinwa19
Acetabularia acetabulum is a single-celled green alga that in its vegetative state is morphologically differentiated into a basal rhizoid and an axially elongated stalk, which bears whorls of branching hairs. The single diploid nucleus resides in the rhizoid.
Overview on Edible Vaccine: Pros & Cons with Mechanism
Precalculus 4 4 graphs pf sine and cosine v2
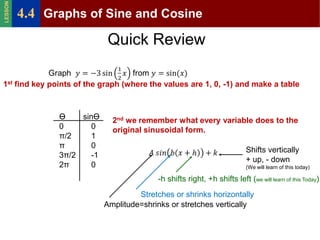
1. LESSON
4.4 Graphs of Sine and Cosine
Quick Review
1st find key points of the graph (where the values are 1, 0, -1) and make a table
Ө sinӨ 2nd we remember what every variable does to the
0 0 original sinusoidal form.
π/2 1
π 0
Shifts vertically
3π/2 -1
+ up, - down
2π 0 (We will learn of this today)
-h shifts right, +h shifts left (we will learn of this Today)
Stretches or shrinks horizontally
Amplitude=shrinks or stretches vertically
2. LESSON
4.4 Graphs of Sine and Cosine
Quick Review
3rd the -3 in amplitude is a vertical stretch and a reflection across the x-axis, o all
we do is multiply our y-values by -3
Ө(x-values) sinӨ (y-values)
Ө 3
00 0 -3π
ππ/2 -3
2ππ 0
3π3π/2 3 -3
3π
4π2π 0
5th now we graph
3. LESSON
4.4 Graphs of Sine and Cosine
Graphs of Sinusoids
The graphs of y a sin(b( x h)) k and y a cos(b( x h)) k
(where a 0 and b 0) have the following characteristics:
amplitude = |a | ;
2
period = ;
|b|
|b|
frequency = .
2
When complared to the graphs of y a sin bx and y a cos bx,
respectively, they also have the following characteristics:
a phase shift of h;
a vertical translation of k .
To the web
4. LESSON
4.4 Graphs of Sine and Cosine
Example Combining a Phase Shift with a
Period Change
Construct a sinusoid with period /3 and amplitude 4
that goes through (2,0).
A= 4
5. LESSON
4.4 Graphs of Sine and Cosine
Example Give the equation for the Graph
1. Recognize type of function
2. Determine known values
3. Solve
(2π, -3)
6. LESSON
4.4 Graphs of Sine and Cosine
Constructing a Sinusoidal Model using Time
1. Determine the maximum value M and minimum value m.
M m
The amplitude A of the sinusoid will be A , and
2
M m
the vertical shift will be C .
2
2. Determine the period p, the time interval of a single cycle
of the periodic function. The horizontal shrink (or stretch)
2
will be B .
p
Slide 4- 6
8. LESSON
4.4 Graphs of Sine and Cosine
Constructing a Sinusoidal Model using Time
3. Choose an appropriate sinusoid based on behavior
at some given time T . For example, at time T :
f (t ) A cos( B(t T )) C attains a maximum value;
f (t ) A cos( B(t T )) C attains a minimum value;
f (t ) A sin( B(t T )) C is halfway between a minimum
and a maximum value;
f (t ) A sin( B (t T )) C is halfway between a maximum
and a minimum value.
9. LESSON
4.4 Graphs of Sine and Cosine
Pedro records the water level in Lacharca Bay every 2 hours
starting at midnight. Plot the data and find the equation that
models it.
T (hours) 0 2 4 6 8 10 12 14 16 18 20 22 24
Depth (m) 8 10 8 4 2 4 8 10 8 4 2 4 8
10. LESSON
4.4 Graphs of Sine and Cosine
Example Constructing a Sinusoidal Model
On a certain day, high tide occurs at 7:12 AM and the
water depth is measured at 15 ft. On the same day, low
tide occurs at 1:24 and the water depth measures 8 ft.
(a) Write a sinusoidal function modeling the tide.
(b) What is the approximate depth of water at 11:00 AM?
At 3:00 PM?
11. LESSON
4.4 Graphs of Sine and Cosine
Example Constructing a
Sinusoidal Model
(c) At what time did the first low tide occur? The second
high tide?
12. LESSON
4.4 Graphs of Sine and Cosine
Homework exercises 35---77 (every other odd)
Bonus74 and 76
Pages 392---394