2
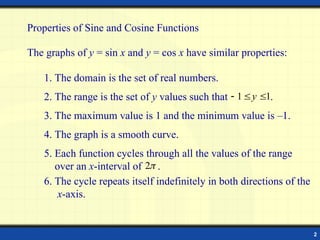
6. The cyclerepeats itself indefinitely in both directions of the
x-axis.
Properties of Sine and Cosine Functions
The graphs of y = sin x and y = cos x have similar properties:
3. The maximum value is 1 and the minimum value is –1.
4. The graph is a smooth curve.
1. The domain is the set of real numbers.
5. Each function cycles through all the values of the range
over an x-interval of .
2
2. The range is the set of y values such that .
1
1
y
3.
3
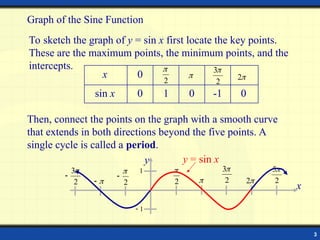
Graph of theSine Function
To sketch the graph of y = sin x first locate the key points.
These are the maximum points, the minimum points, and the
intercepts.
0
-1
0
1
0
sin x
0
x
2
2
3
2
Then, connect the points on the graph with a smooth curve
that extends in both directions beyond the five points. A
single cycle is called a period.
y
2
3
2
2
2
3
2
2
5
1
1
x
y = sin x
4.
4
y
1
1
2
3
2
x
3
2
4
Example:Sketch the graph of y = 3 cos x on the interval [–, 4].
Partition the interval [0, 2] into four equal parts. Find the five key
points; graph one cycle; then repeat the cycle over the interval.
max
x-int
min
x-int
max
3
0
-3
0
3
y = 3 cos x
2
0
x
2
2
3
(0, 3)
2
3
( , 0)
( , 0)
2
2
( , 3)
( , –3)
5.
5
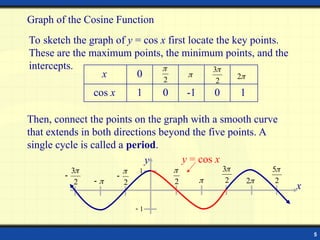
Graph of theCosine Function
To sketch the graph of y = cos x first locate the key points.
These are the maximum points, the minimum points, and the
intercepts.
1
0
-1
0
1
cos x
0
x 2
2
3
2
Then, connect the points on the graph with a smooth curve
that extends in both directions beyond the five points. A
single cycle is called a period.
y
2
3
2
2
2
3
2
2
5
1
1
x
y = cos x
6.
6
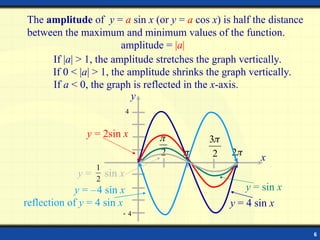
The amplitude ofy = a sin x (or y = a cos x) is half the distance
between the maximum and minimum values of the function.
amplitude = |a|
If |a| > 1, the amplitude stretches the graph vertically.
If 0 < |a| > 1, the amplitude shrinks the graph vertically.
If a < 0, the graph is reflected in the x-axis.
2
3
2
4
y
x
4
2
y = –4 sin x
reflection of y = 4 sin x y = 4 sin x
y = 2sin x
2
1
y = sin x
y = sin x
7.
7
y
x
2
sin x
y
period: 2
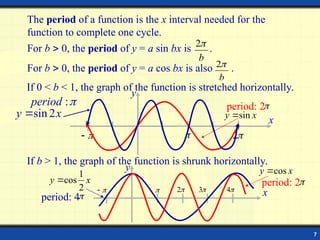
The period of a function is the x interval needed for the
function to complete one cycle.
For b 0, the period of y = a sin bx is .
b
2
For b 0, the period of y = a cos bx is also .
b
2
If 0 < b < 1, the graph of the function is stretched horizontally.
If b > 1, the graph of the function is shrunk horizontally.
y
x
2
3
4
cos x
y
period: 2
2
1
cos x
y
period: 4
sin 2
y x
:
period
8.
8
y
x
2
y = cos(–x)
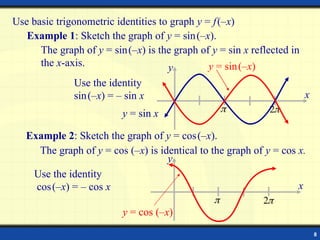
Use basic trigonometric identities to graph y = f(–x)
Example 1: Sketch the graph of y = sin(–x).
Use the identity
sin(–x) = – sin x
The graph of y = sin(–x) is the graph of y = sin x reflected in
the x-axis.
Example 2: Sketch the graph of y = cos(–x).
Use the identity
cos(–x) = – cos x
The graph of y = cos (–x) is identical to the graph of y = cos x.
y
x
2
y = sin x
y = sin(–x)
y = cos (–x)
9.
9
2
y
2
6
x
2
6
5
3
3
2
6
6
3
2
3
2
0
2
0
–2
0
y = –2sin 3x
0
x
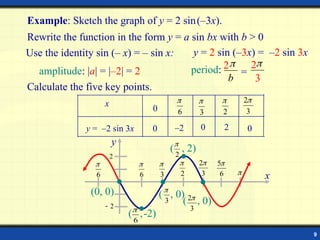
Example: Sketch the graph of y = 2 sin(–3x).
Rewrite the function in the form y = a sin bx with b > 0
amplitude: |a| = |–2| = 2
Calculate the five key points.
(0, 0) ( , 0)
3
( , 2)
2
( ,-2)
6
( , 0)
3
2
Use the identity sin (– x) = – sin x: y = 2 sin (–3x) = –2 sin 3x
period:
b
2
2
3
=
10.
10
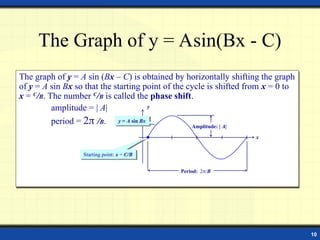
The graph ofy = A sin (Bx – C) is obtained by horizontally shifting the graph
of y = A sin Bx so that the starting point of the cycle is shifted from x = 0 to
x = C
/B. The number C
/B is called the phase shift.
amplitude = | A|
period = 2 /B.
x
y
Amplitude: | A|
Period: 2/B
y = A sin Bx
Starting point: x = C/B
The Graph of y = Asin(Bx - C)
11.
11
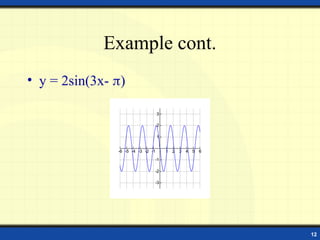
Example
Determine the amplitude,period, and phase
shift of y = 2sin(3x-)
Solution:
Amplitude = |A| = 2
period = 2/B = 2/3
phase shift = C/B = /3
13
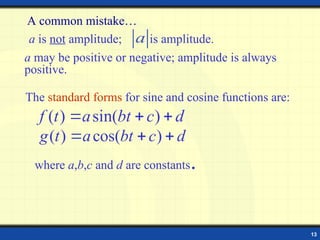
A common mistake…
ais not amplitude; is amplitude.
a may be positive or negative; amplitude is always
positive.
a
The standard forms for sine and cosine functions are:
where a,b,c and d are constants.
( ) sin( )
f t a bt c d
( ) cos( )
g t a bt c d
14.
14
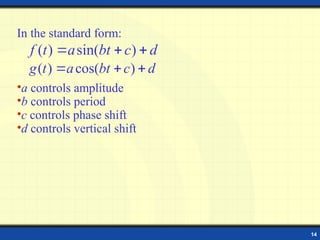
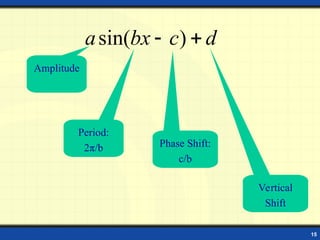
In the standardform:
•a controls amplitude
•b controls period
•c controls phase shift
•d controls vertical shift
( ) sin( )
f t a bt c d
( ) cos( )
g t a bt c d
![4
y
1
1
2
3
2
x
3
2
4
Example: Sketch the graph of y = 3 cos x on the interval [–, 4].
Partition the interval [0, 2] into four equal parts. Find the five key
points; graph one cycle; then repeat the cycle over the interval.
max
x-int
min
x-int
max
3
0
-3
0
3
y = 3 cos x
2
0
x
2
2
3
(0, 3)
2
3
( , 0)
( , 0)
2
2
( , 3)
( , –3)](https://image.slidesharecdn.com/ma1-251008112340-4285ac59/85/trigonometric-identities-inverse-trigon-4-320.jpg)