Downloaded 547 times
![Hypothesis Testing For Equal Means
The histograms below show the height of inhabitants of
countries A and B.
Both samples are of size 100, the scale is the same, and
the unit of measurement is inches.
Question: Is the population of country B, on average,
taller than that of country A?
Country A
Country B
[inch]
60.0 62.0 64.0 66.0 68.0 70.0 72.0 74.0 76.0 78.0 80.0](https://image.slidesharecdn.com/hypothesistesting-140731021136-phpapp02/75/Hypothesis-Testing-in-Six-Sigma-3-2048.jpg)
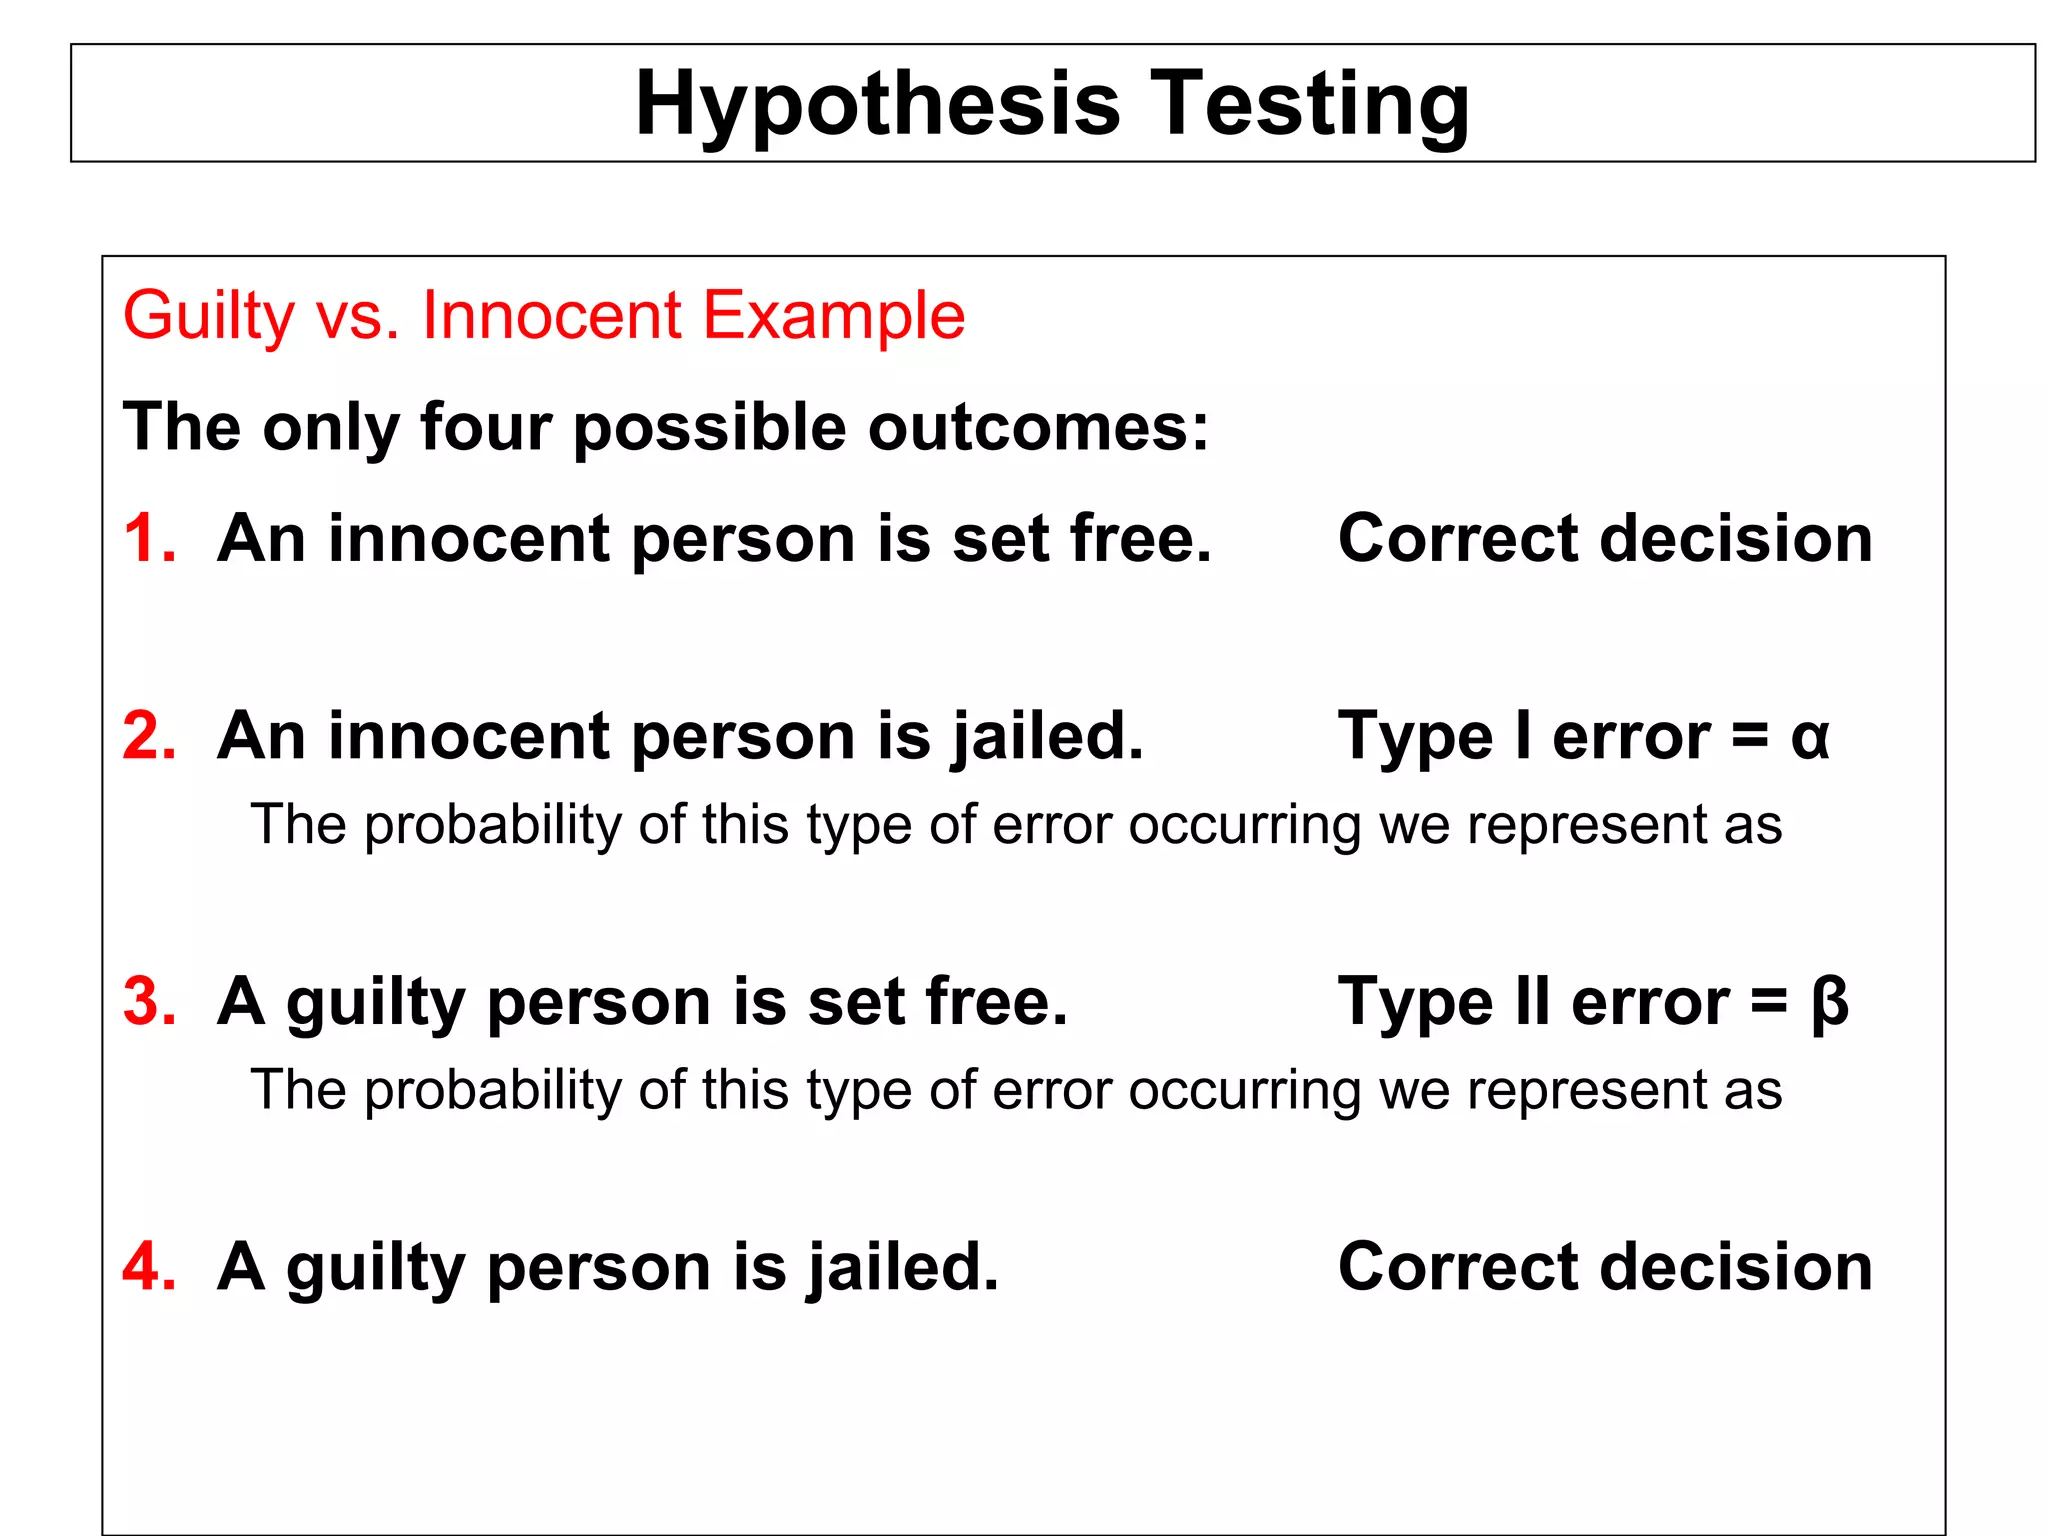
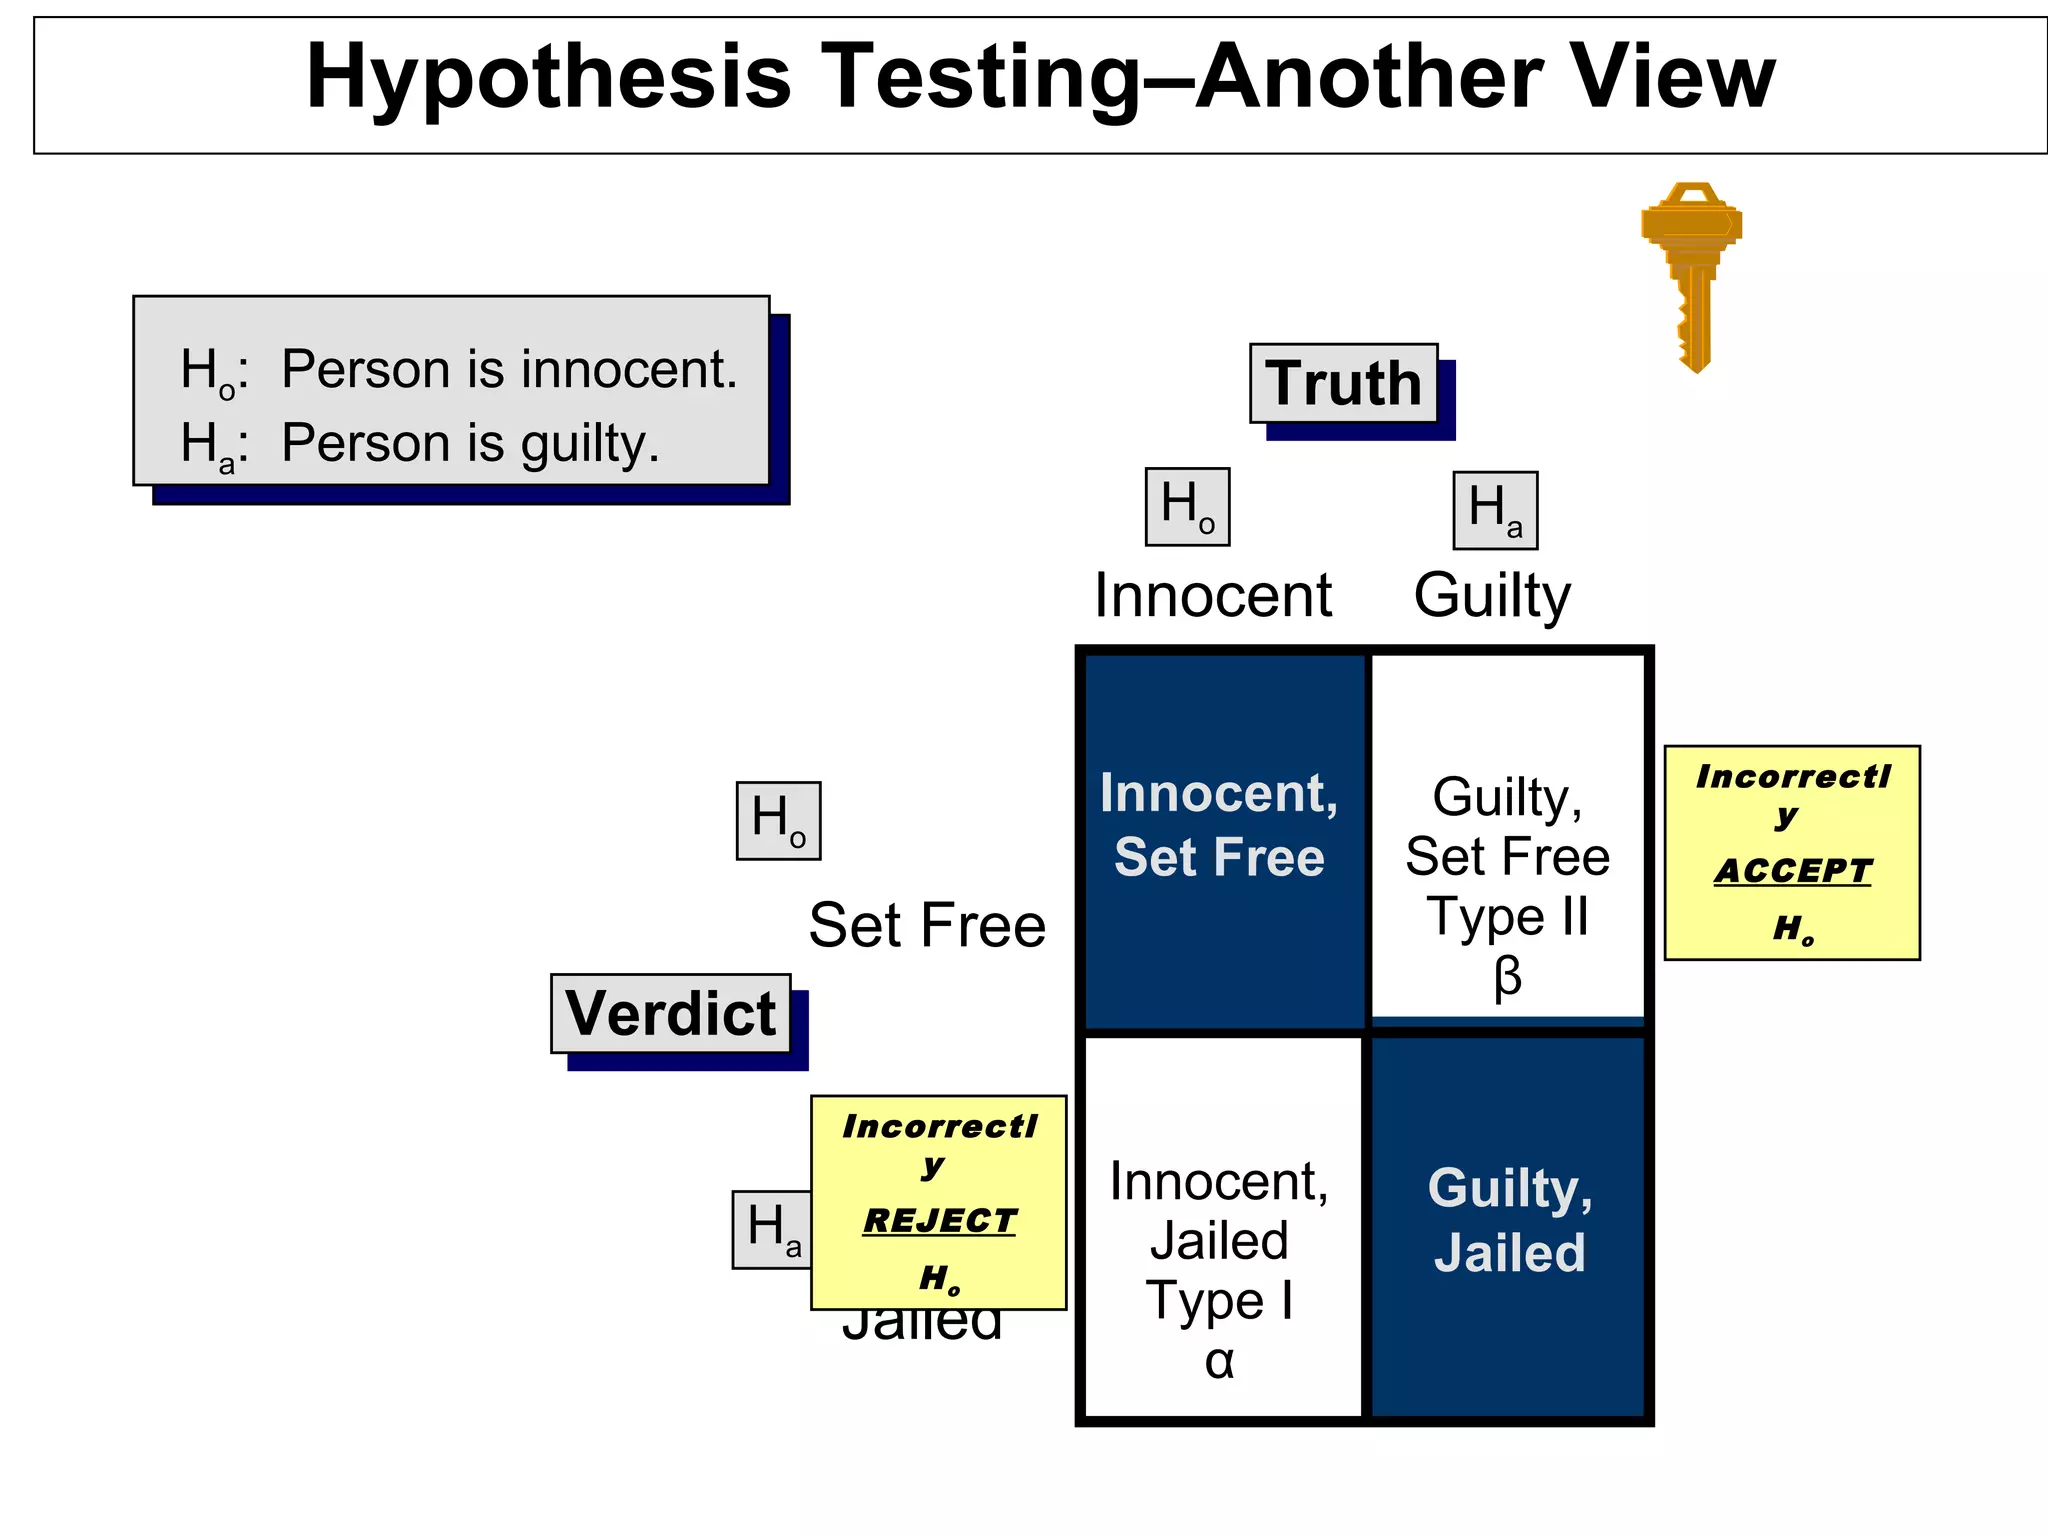
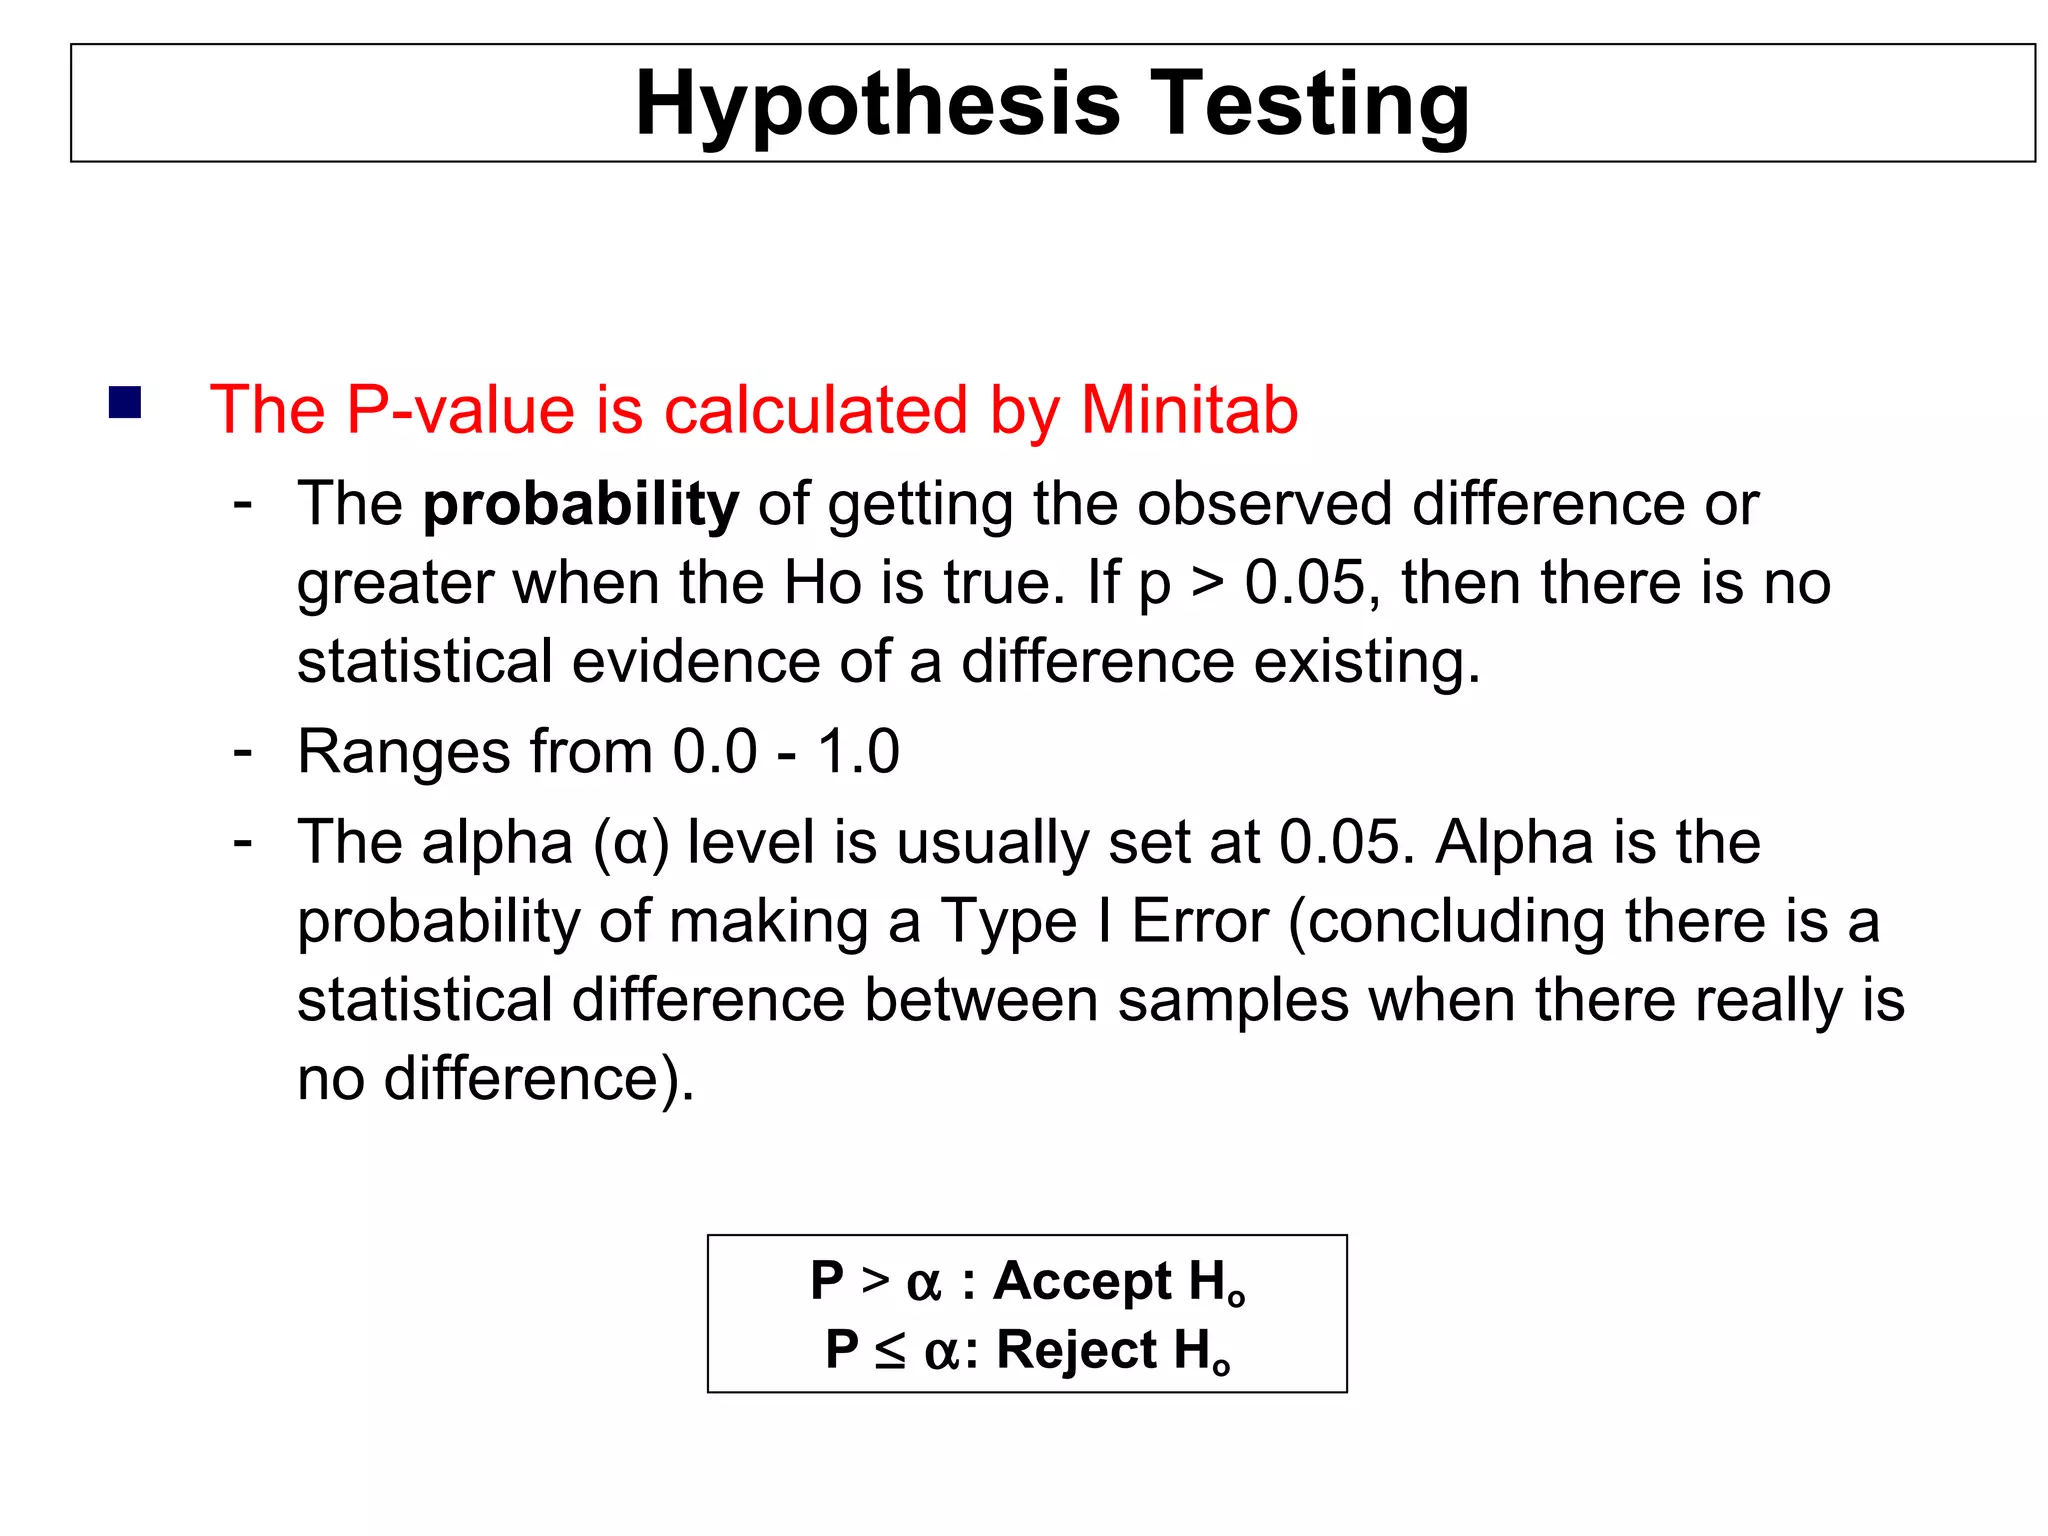
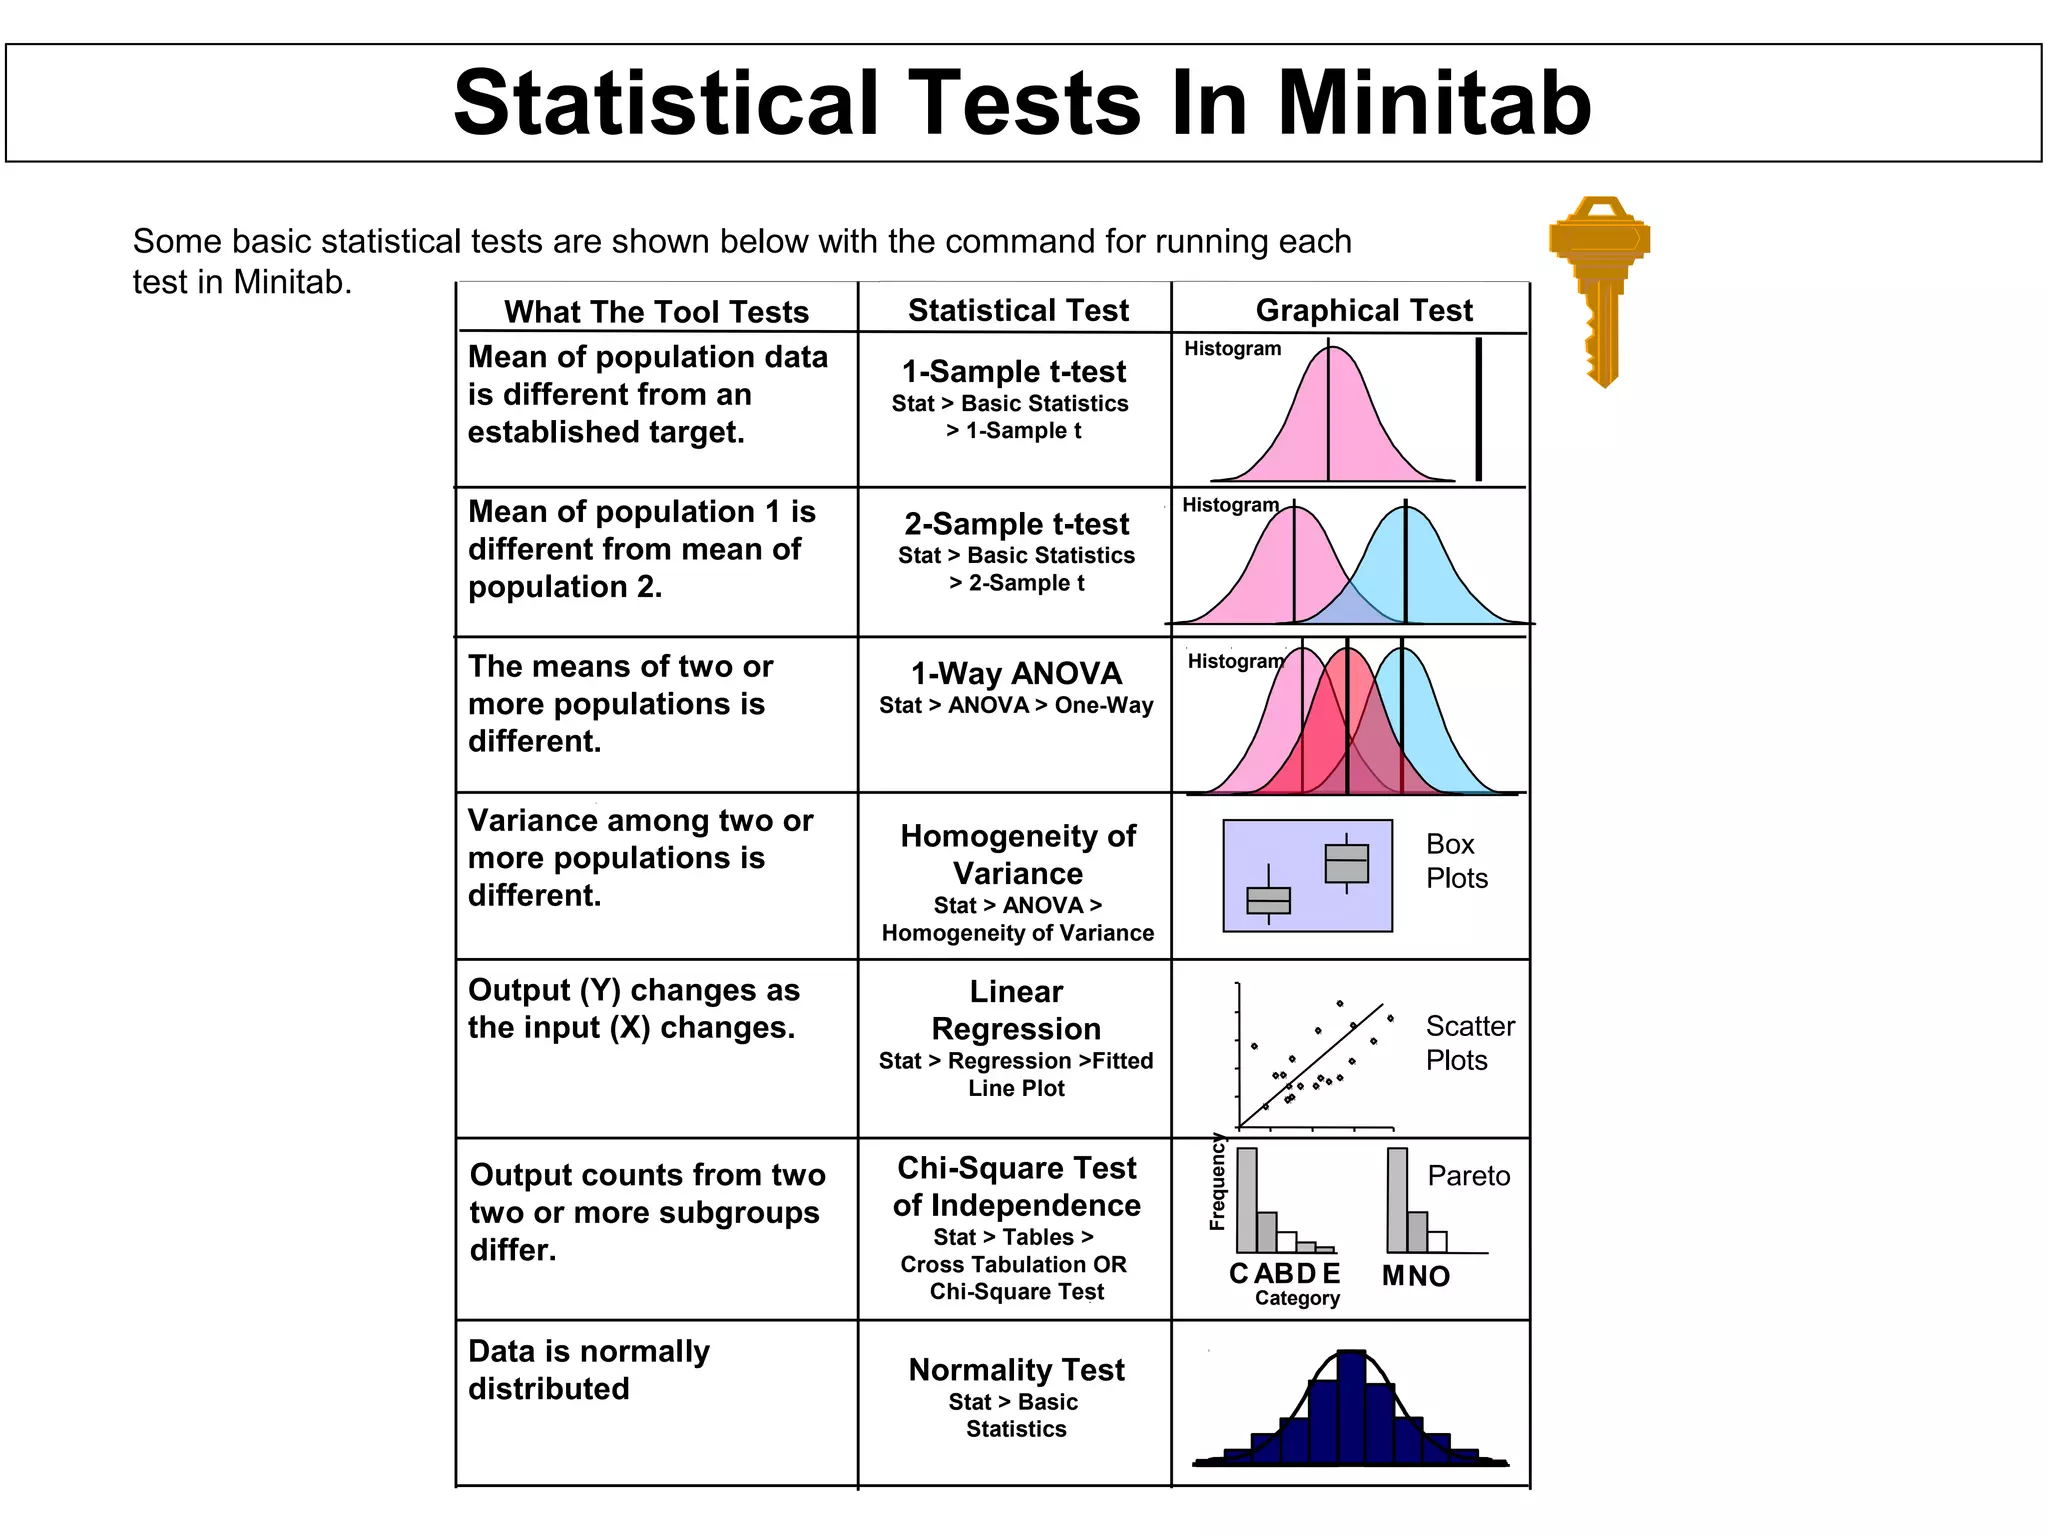
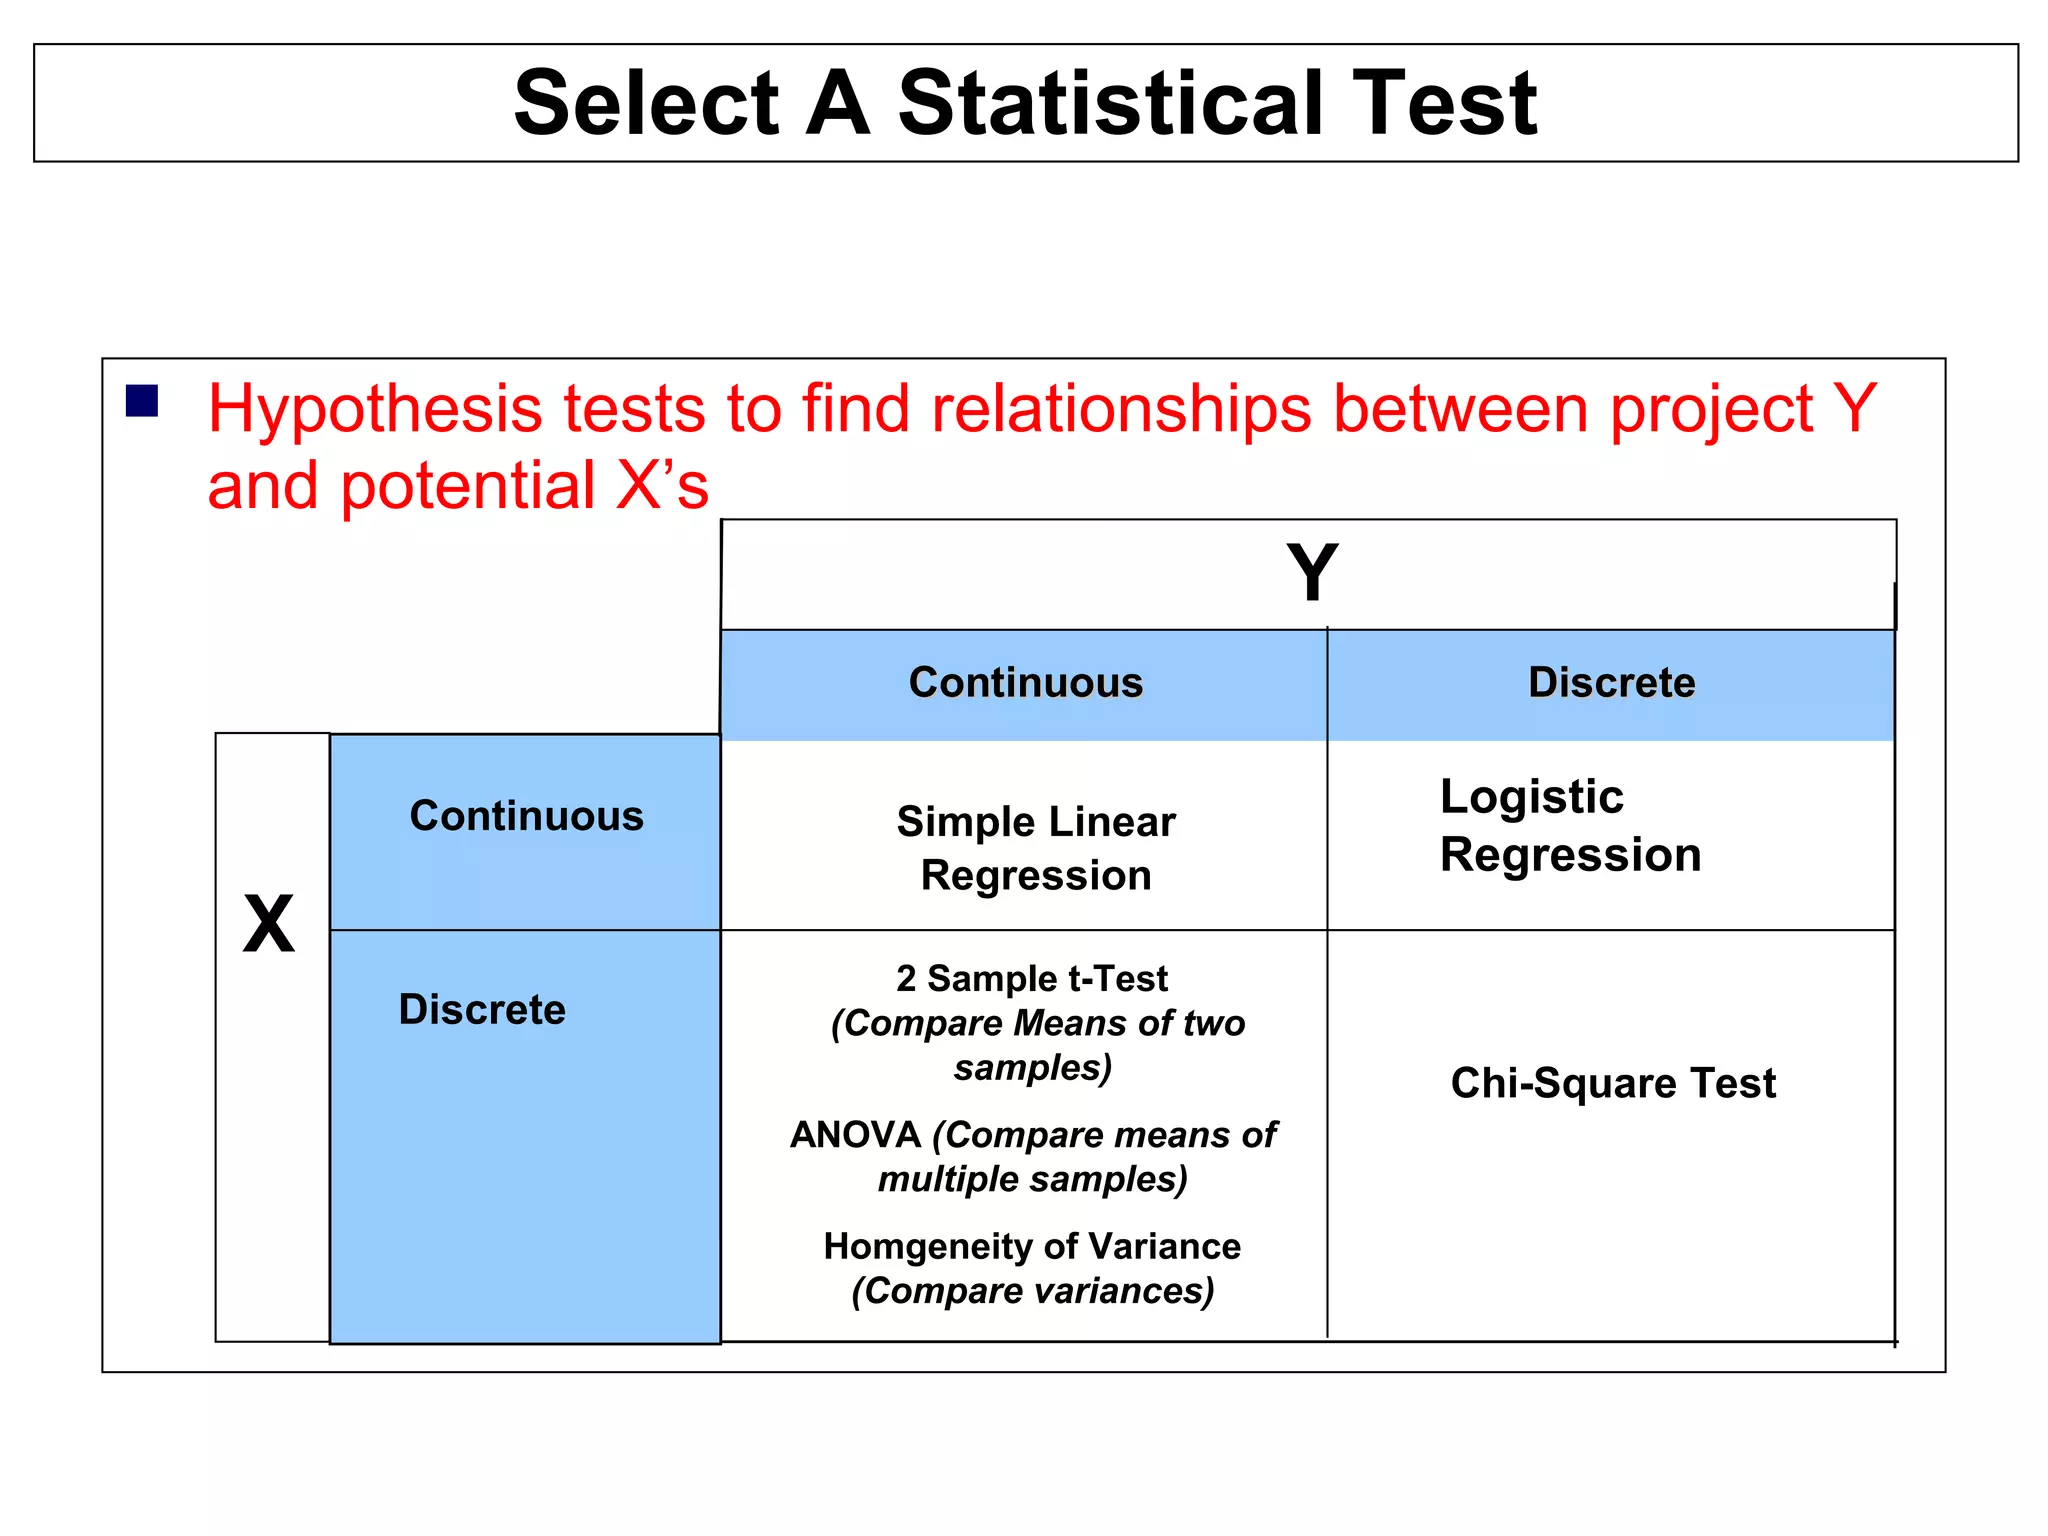

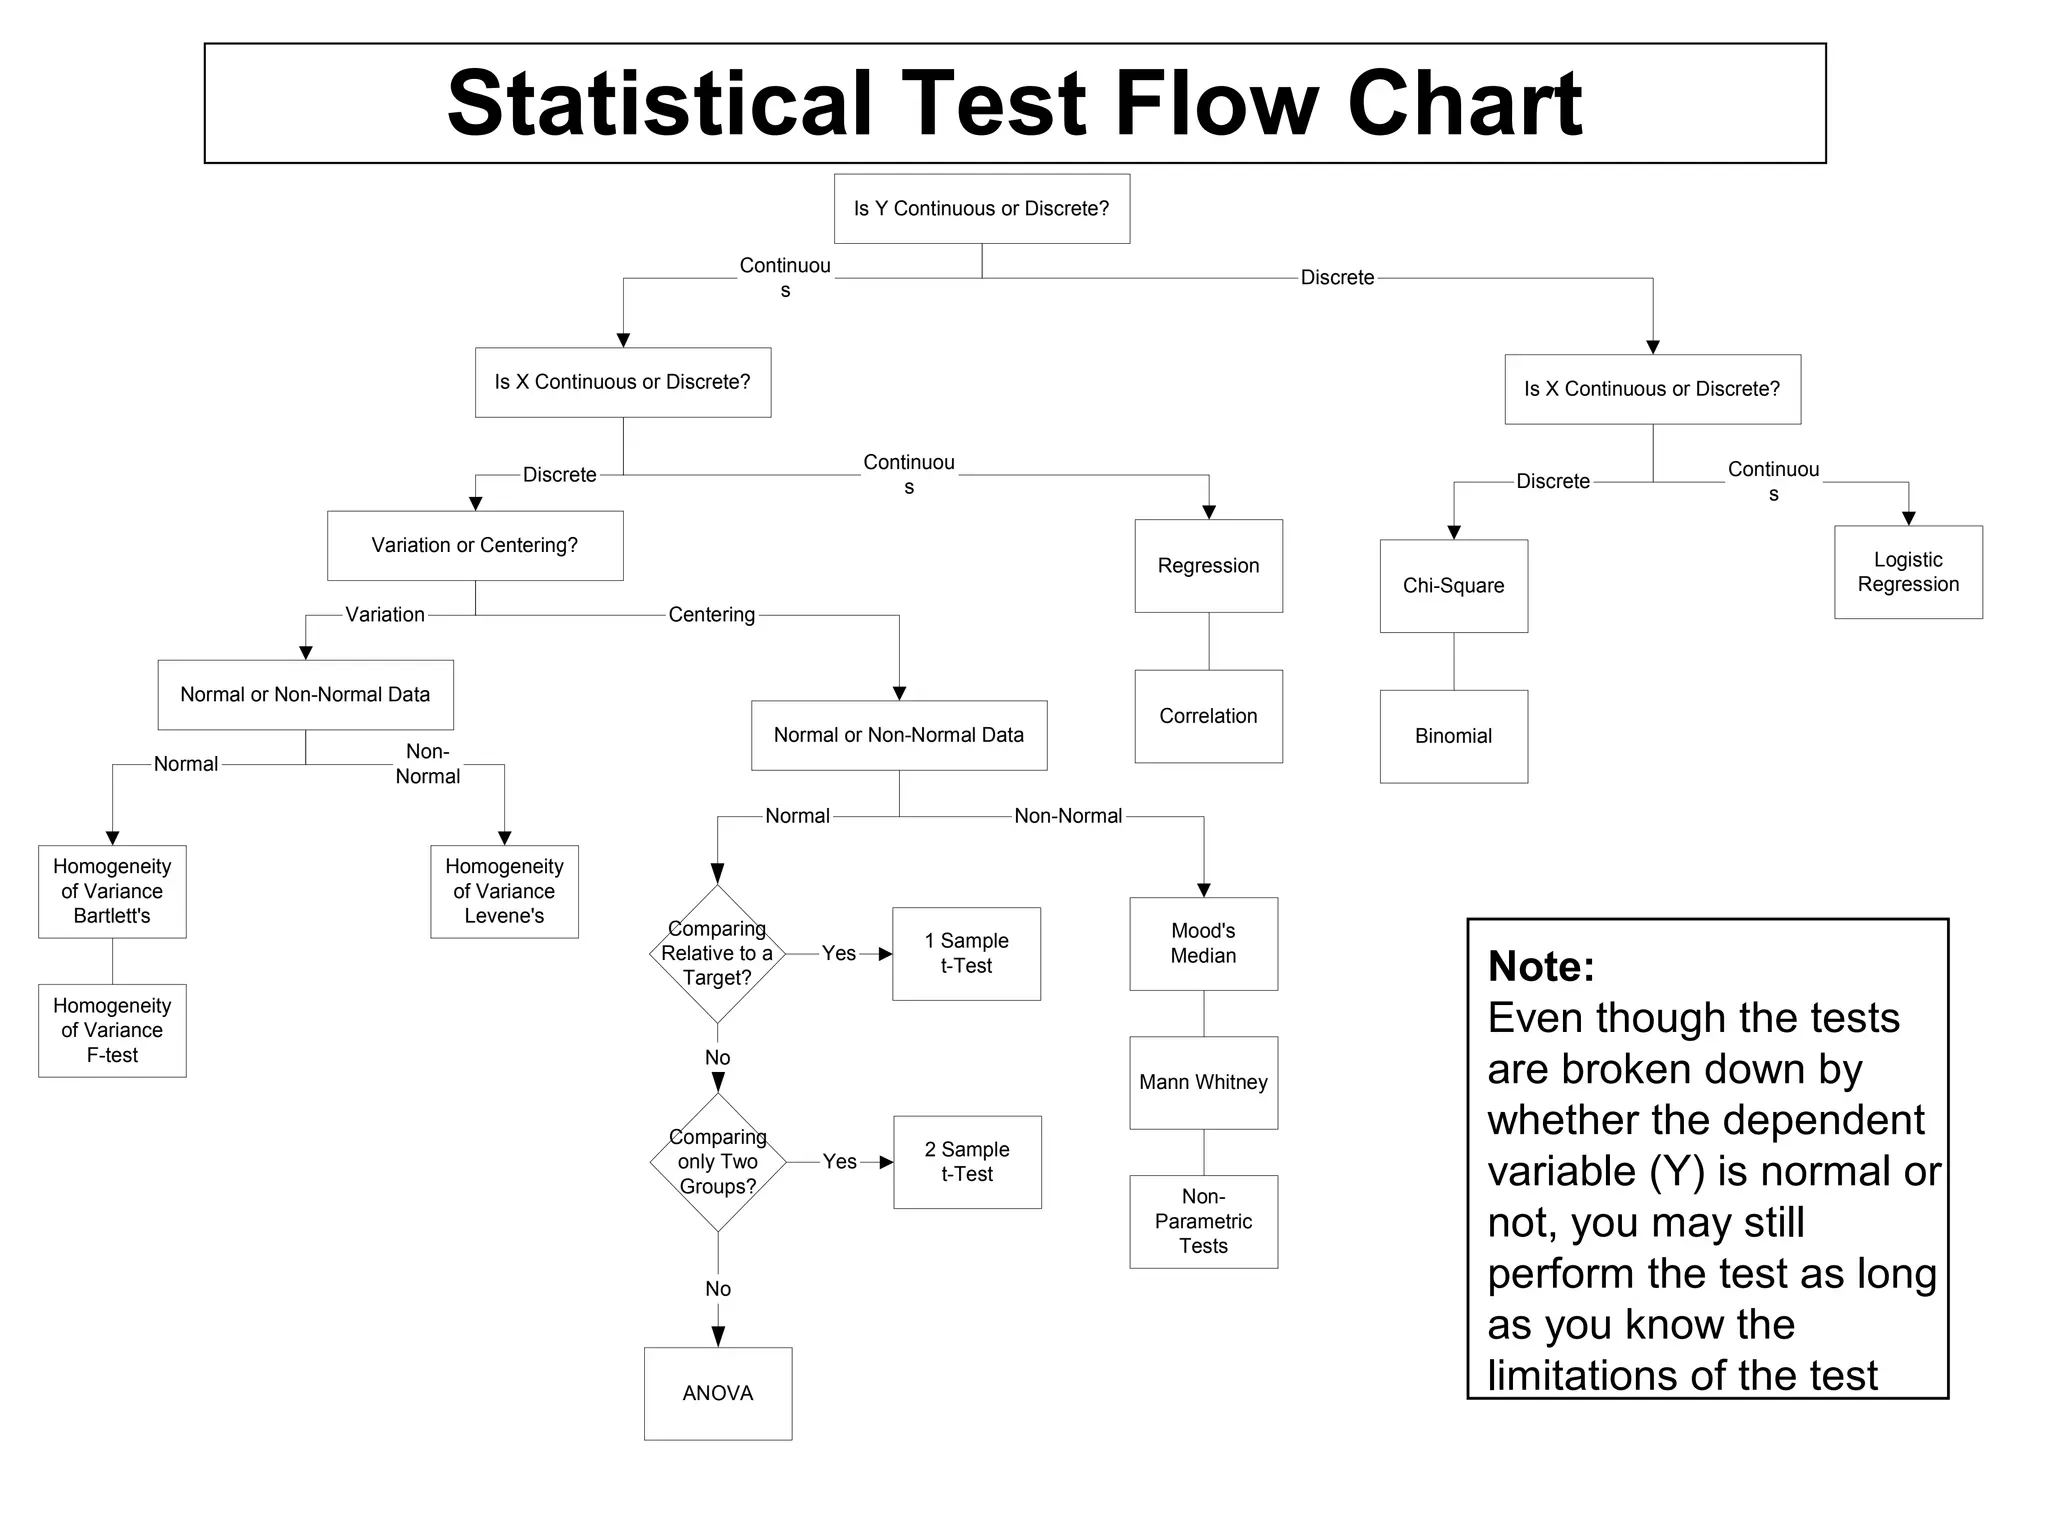

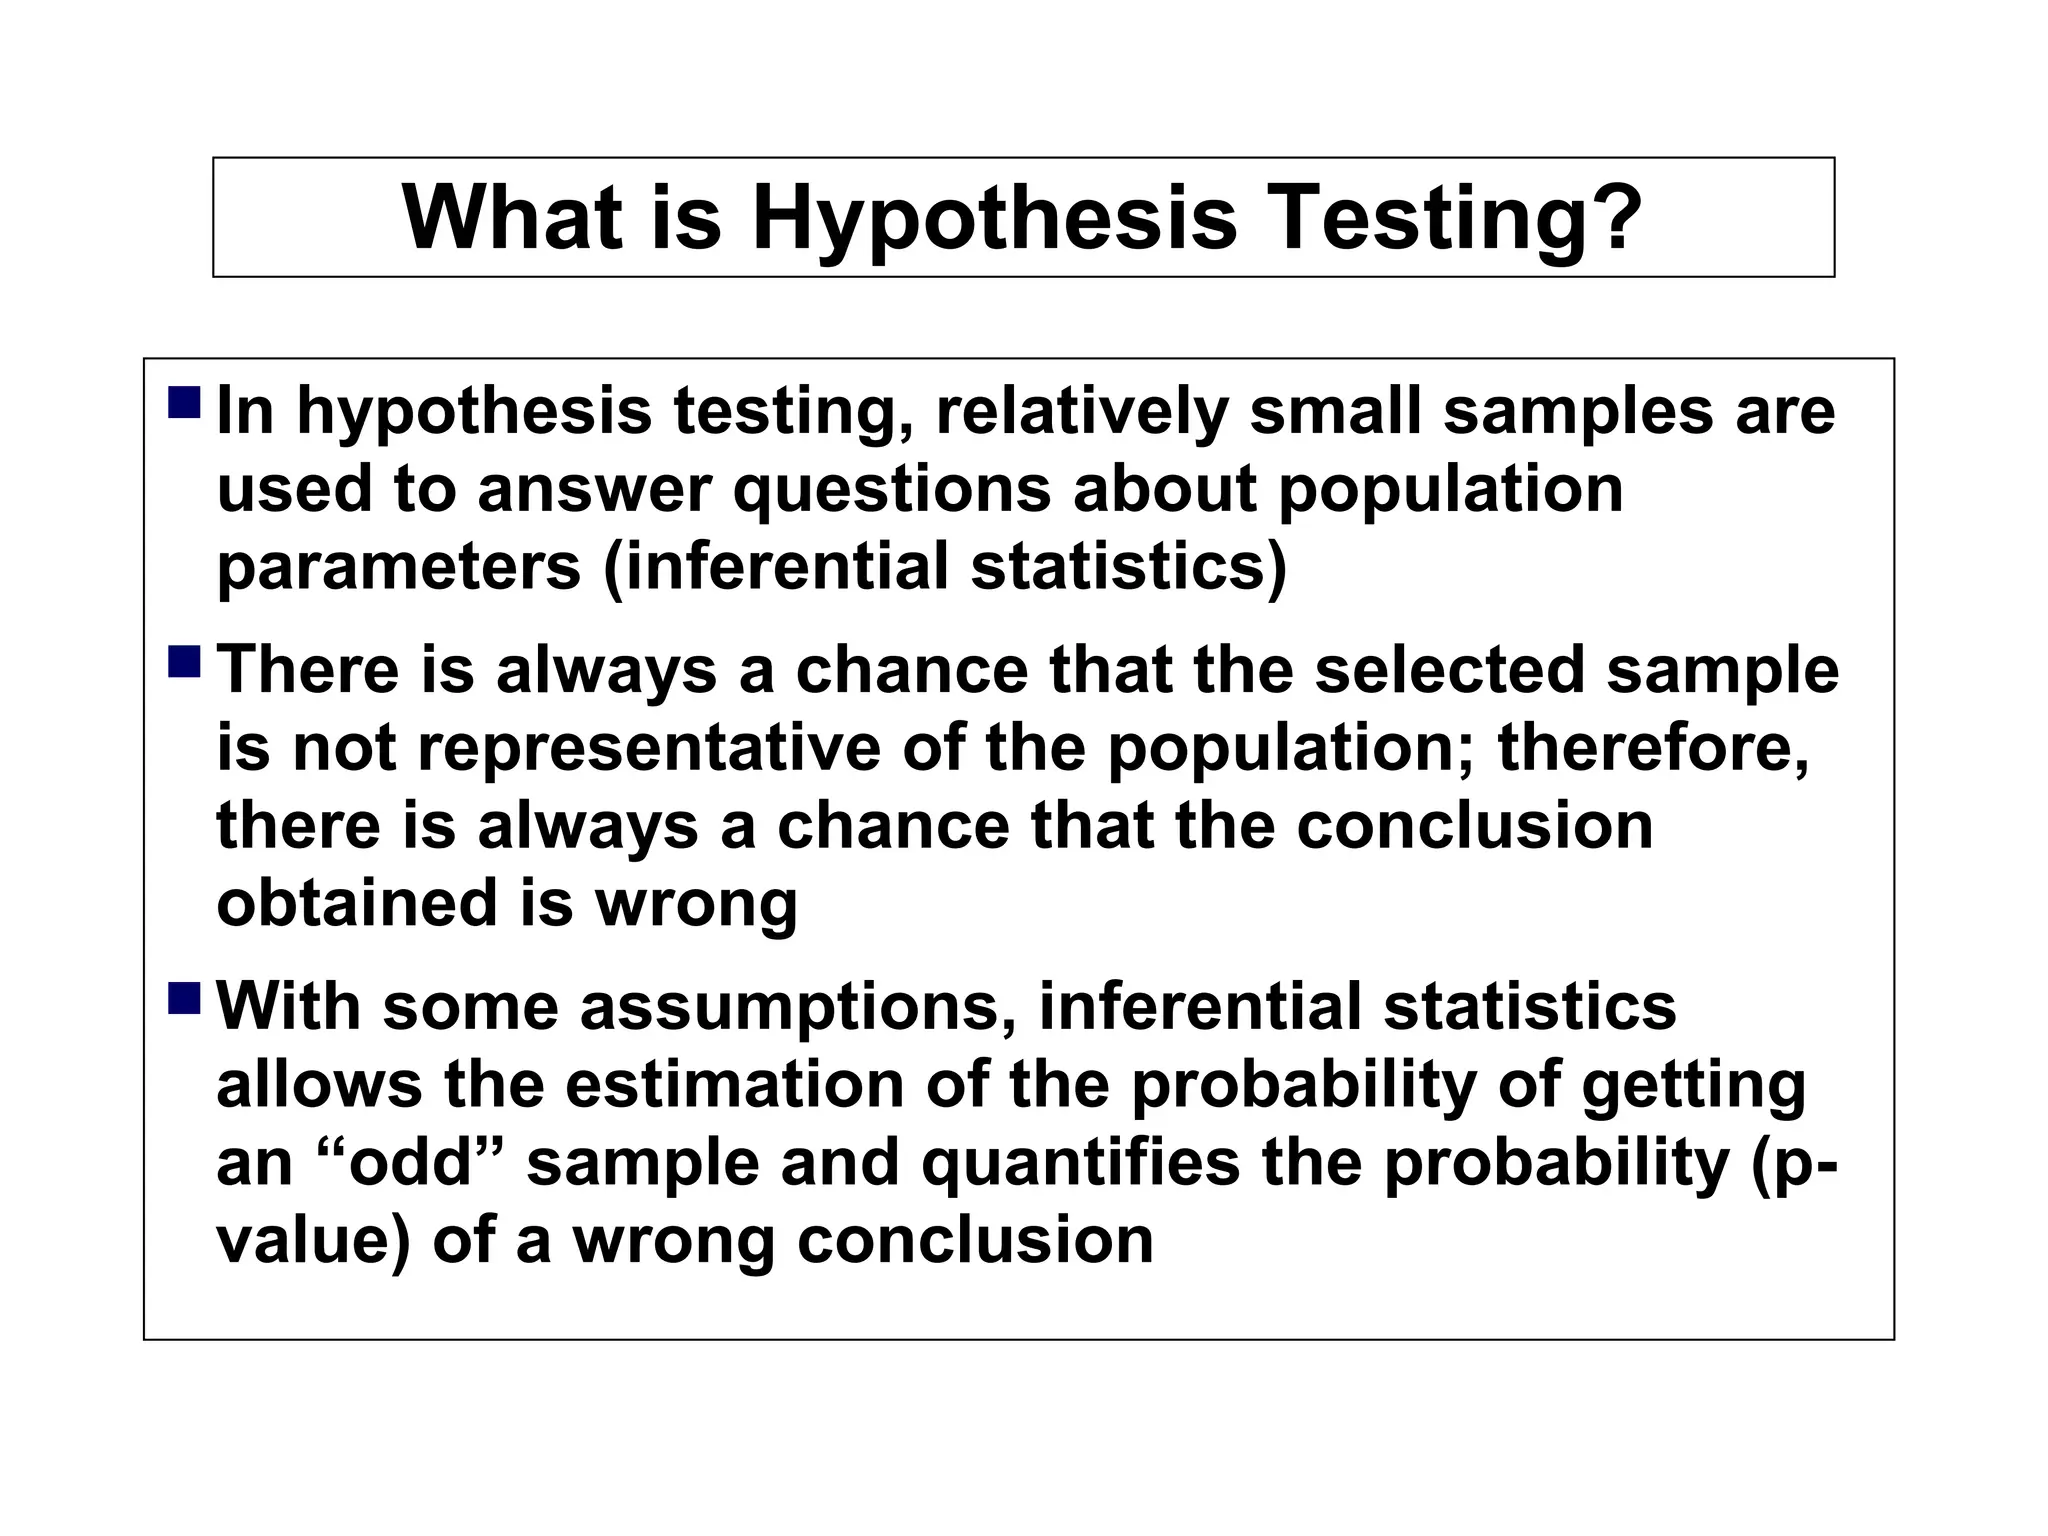
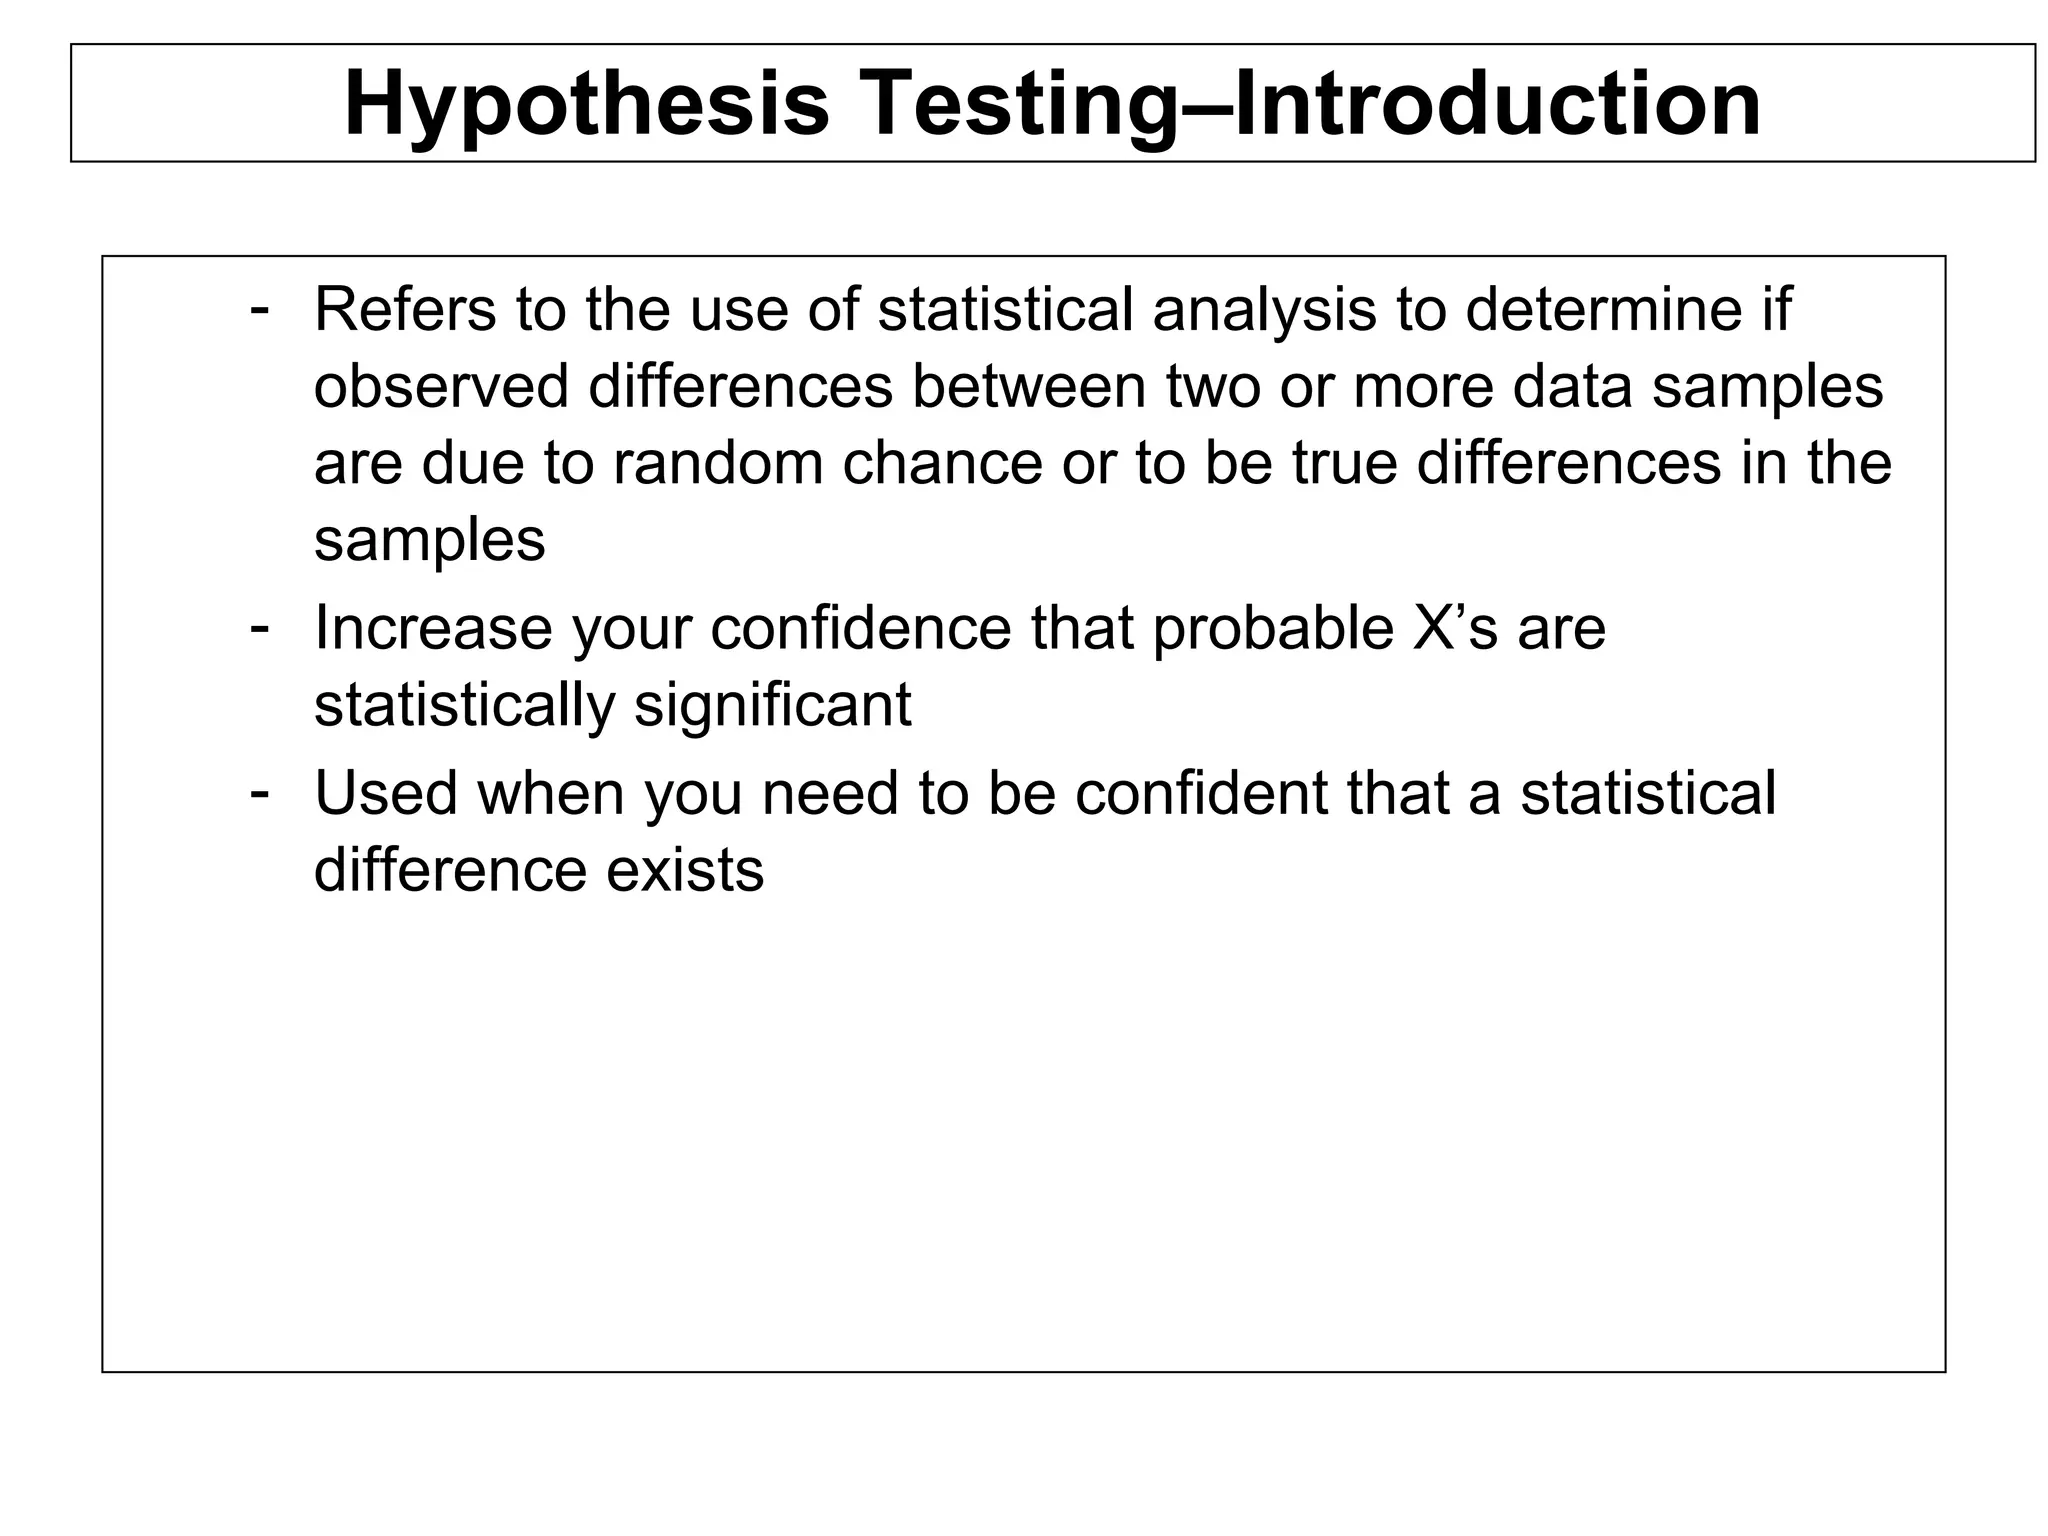
Hypothesis testing is a statistical method used to determine if observed differences between sample groups are statistically significant or due to random chance, involving concepts like null and alternative hypotheses. The process includes calculating p-values to assess the probability of drawing incorrect conclusions about populations based on sample data. Various statistical tests, including t-tests and ANOVA, are employed in hypothesis testing to analyze differences in means and variances across multiple populations.


![Acceptance Sampling[1]](https://cdn.slidesharecdn.com/ss_thumbnails/acceptancesampling1-1226078569232381-9-thumbnail.jpg?width=640&height=640&fit=bounds)