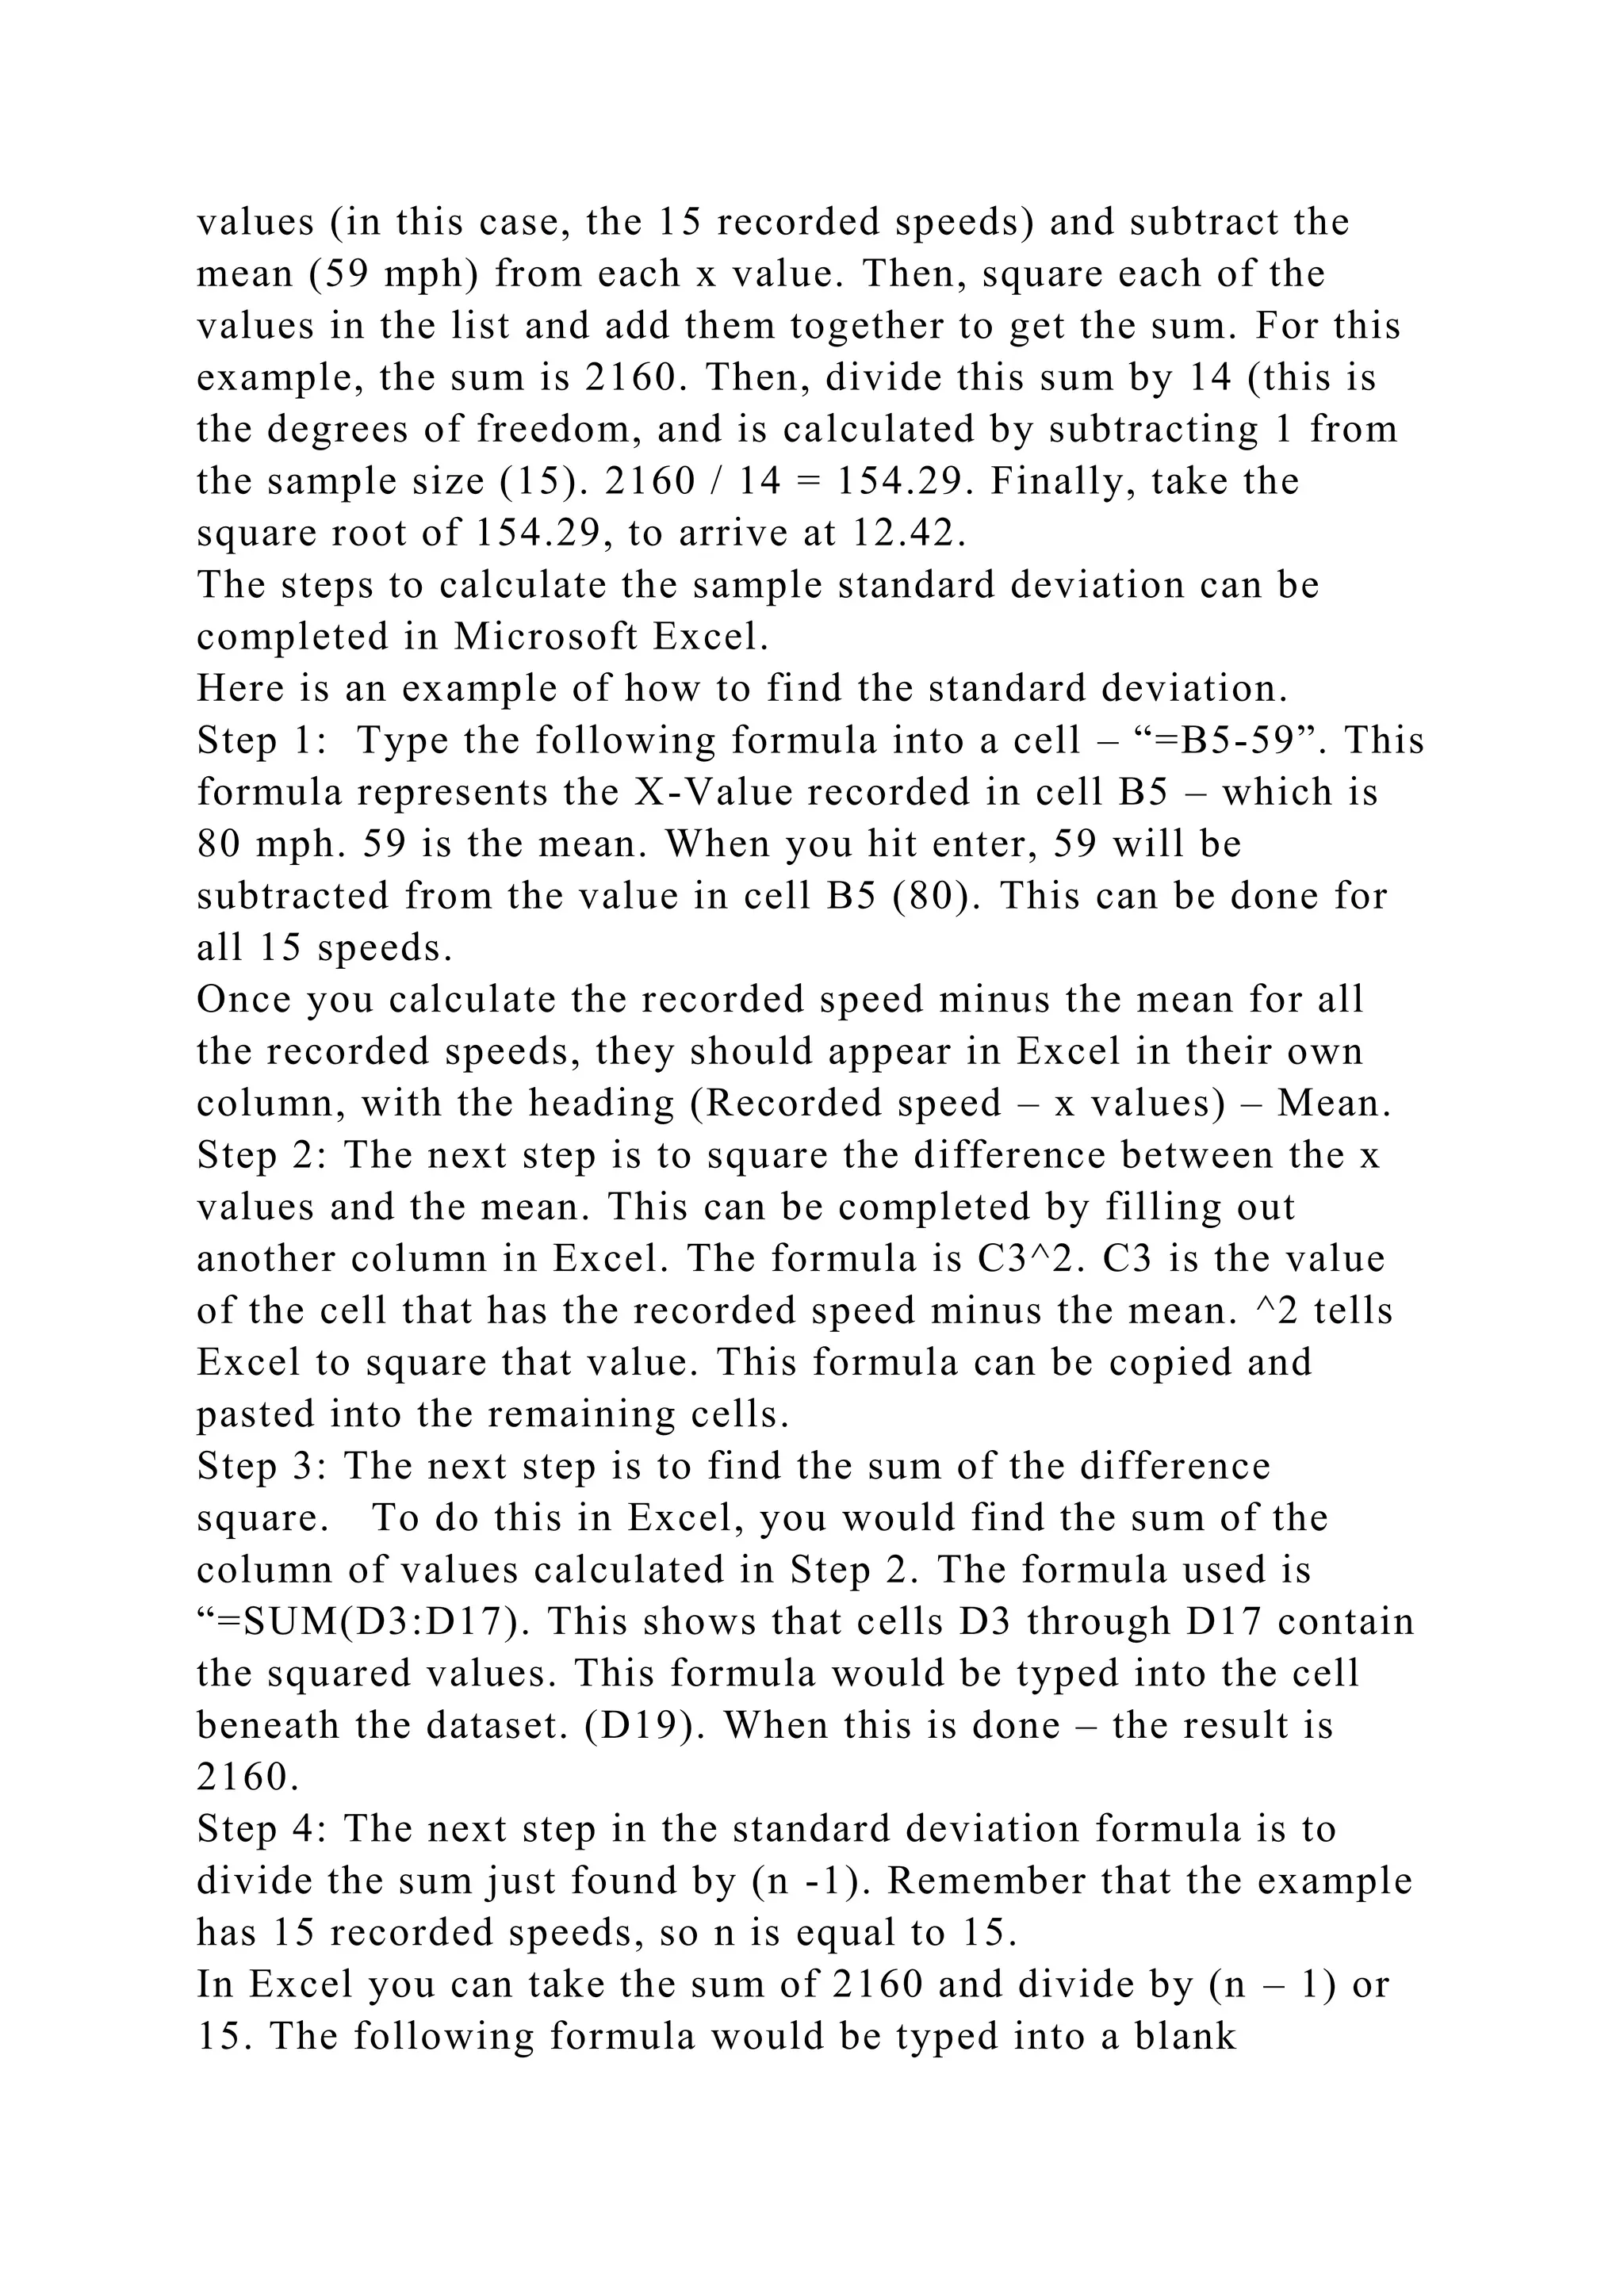
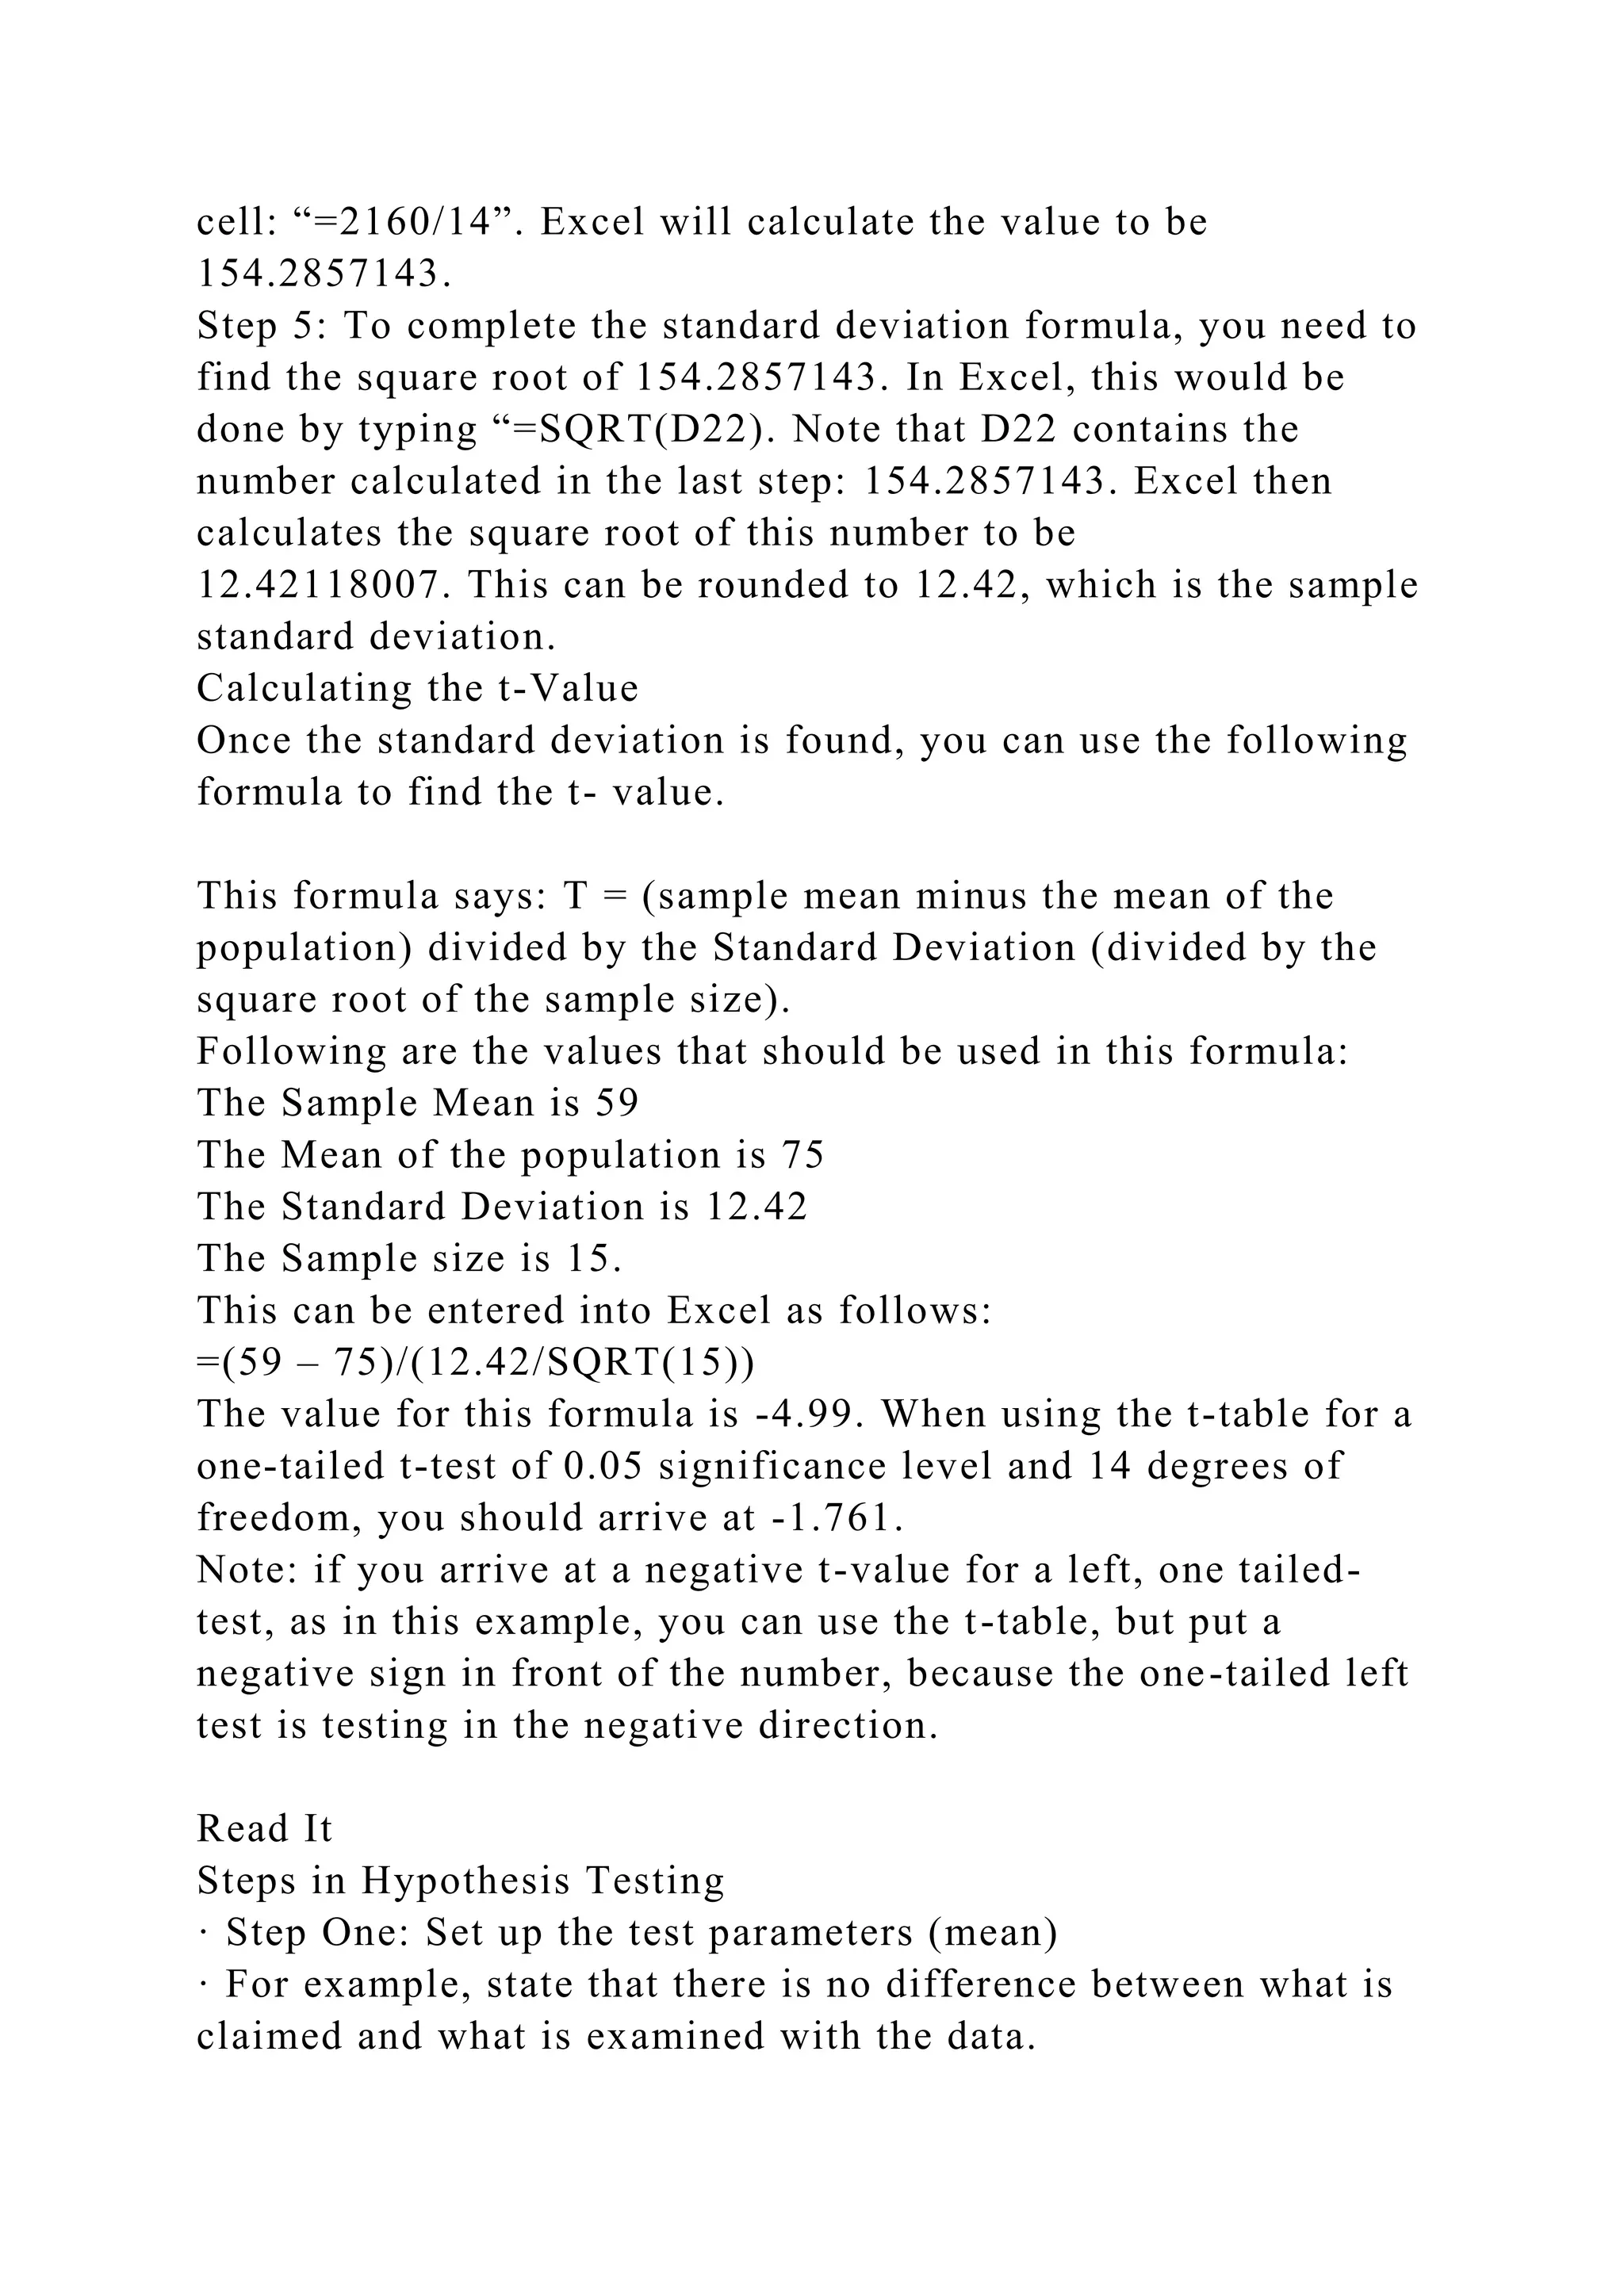
TEST #1
Perform the following two-tailed hypothesis test, using a .05
significance level:
· Intrinsic by Gender
· State the null and an alternate statement for the test
· Use Microsoft Excel (Data Analysis Tools) to process your
data and run the appropriate test. Copy and paste the results of
the output to your report in Microsoft Word.
· Identify the significance level, the test statistic, and the
critical value.
· State whether you are rejecting or failing to reject the null
hypothesis statement.
· Explain how the results could be used by the manager of the
company.
TEST #2
Perform the following two-tailed hypothesis test, using a .05
significance level:
· Extrinsic variable by Position Type
· State the null and an alternate statement for the test
· Use Microsoft Excel (Data Analysis Tools) to process your
data and run the appropriate test.
· Copy and paste the results of the output to your report in
Microsoft Word.
· Identify the significance level, the test statistic, and the
critical value.
· State whether you are rejecting or failing to reject the null
hypothesis statement.
· Explain how the results could be used by the manager of the
company.
GENERAL ANALYSIS (Research Required)
Using your textbook or other appropriate college-level
resources:
· Explain when to use a t-test and when to use a z-test. Explore
the differences.
· Discuss why samples are used instead of populations.
The report should be well written and should flow well with no
grammatical errors. It should include proper citation in APA
formatting in both the in-text and reference pages and include a
title page, be double-spaced, and in Times New Roman, 12-
point font. APA formatting is necessary to ensure academic
honesty.
Be sure to provide references in APA format for any resource
you may use to support your answers.
Making Inferences
When data are collected, various summary statistics and graphs
can be used for describing data; however, learning about what
the data mean is where the power of statistics starts. For
example, is there really a difference between two leading cola
products? Hypothesis testing is an example of making these
types of inferences on data sets.
Hypothesis Tests
Claims are made all the time, such as a particular light bulb will
last a certain number of hours.
Claims like this are tested with hypothesis testing. It is a
straight forward procedure that consists of the following steps:
1. A claim is made.
2. A value for probability of significance is chosen.
3. Data are collected.
4. The test is performed.
5. The results are analyzed.
Hypothesis tests are performed on the mean of the population. µ
It is not possible to test the full population. For example, it
would be impossible to test every light bulb. Instead, the
hypothesis test is performed on a sample of the population.
Setting up a Hypothesis Test
When performing hypothesis testing, the test is setup with a null
hypothesis (or claim) and the alternative hypothesis.
The null hypothesis (the claim) is
· what is being disputed
· represented by
The alternative hypothesis is
· what is being researched
· represented by
Example: If testing the claim that light bulbs last 3,500 hours,
then the hypothesis is written as follows:
Question 1 - Multiple Choice: In the above example, which
statement is the null hypothesis?
A.
B.
The correct answer is A. A. represents the null hypothesis. B.
represents the alternative hypothesis.
One -Tail and Two-Tail Hypothesis Testing
When hypothesis tests are set up, the researcher is either
looking to see if there is a difference or if the values are too
large or small. If the researcher is looking for a difference from
what is being claimed, the test is a two-tail test. A two-tail test
states that if the value is too far below or above the mean, then
the null will be rejected. One-tail tests are tests that are
concerned with values that are greater than (right-tail) or less
than (left-tail) the mean.
In the light bulb example, which type of test is used for the
following hypothesis?
A. Two-tail
B. One-Tail (Right tail)
C. One-Tail (Left-tail)
The correct answer is C. One-Tail (Left-tail). For the light bulb
test, the test results are only significant if the bulbs last less
than 3,500 hours.
Outcomes of Hypothesis Testing
When a hypothesis test is performed, the claim is always
assumed to be true unless proven otherwise. There are two
outcomes for a hypothesis test:
Reject the claim
Fail to reject the claim
Note: You never state that you accept the null hypothesis. You
can only state that there is not enough evidence to fail to
reject.
Level of Significance
Before a hypothesis test is made, one must decide the level of
significance. To understand the level of significance, it is
important to first understand the errors that can occur when
testing. Remember that the sample is being tested, not the entire
population.
There are two types of errors that can occur: Type I and Type
II.
· Type I Error: Rejecting the null erroneously. The null should
not have been rejected.
· Type II Error: The null is not rejected erroneously. The null
should have been rejected.
In the light bulb example, the testing showed that the light
bulbs did not perform for 3,500 hours. The tester rejected the
null hypothesis, which stated that the light bulbs last 3,500
hours.
Remember the statement:
It was then found that the test was performed on a batch of
faulty light bulbs. These light bulbs did not represent the
average light bulb, so the test results were not accurate.
Which type of error occurred?
A. Type I
B. Type II
The correct answer is A. Type I. The null hypothesis was
rejected; however, it was done so erroneously. The tests were
performed on a faulty batch of light bulbs that did not represent
the average light bulb.
Level of Significance
The significance level of the test is the risk you are willing to
take of rejecting the null hypothesis, when, in fact, it is true.
The level of significance is given in terms of alpha. Typical
values are .01 and.05.
.01 is the stricter of the two.
Performing the Test
After the hypothesis has been set up and the significance level
has been set, data are collected. After the data are collected, the
sample mean is calculated and is tested.
Testing includes finding the P- value, which is the probability
that if the population mean is true. The sample value will fit the
data set.
P-Values are calculated using the z-Test. First, the value z is
found with the following formula.
Following are descriptions of the parts of this formula.
The P-value is then found by looking up z, on a normal table, or
it is calculated using software.
Using Z-test versus t-Test
When the sample size is 30 or greater, the normal table (z-test)
that was just described is used; however, when a sample is less
than 30, the p-value s are found in a t distribution table. When
looking up values in a t table, the value called degrees of
freedom is used. The degrees of freedom are the sample size (n)
minus 1.
Hypothesis Test – Decision
When the P-value is calculated, it is compared with the level of
significance to make the decision on whether to reject the null
hypothesis. In the next exercise, Part 2, you will have a chance
to see in detail how this decision is made.
Practice: One Population Parameter
The following data set gives the speeds taken this year from 15
random cars driving on a road with a speed limit of 55 mph. The
authorities have given data that states the average speed
recorded from the year before in the same area was 75 mph.
You feel that the average is lower this year because so many
speeders were seen receiving tickets the year before.
Using the sample data, we will set up a hypothesis test based on
the claim. Carefully follow each of the steps involved in the
test. We will use a significance level of 0.05.
This activity also gives instructions on how to use Microsoft
Excel for solving this problem, so you can do this in Excel if
you wish. This will be a big help in solving statistics equations
and in future assignments.
Following is a list of the 15 recorded speeds: 60, 75, 80, 50, 45,
45, 55, 80, 75, 60, 50, 50, 50, 55, 55. In Excel, these should be
put in a column labeled “Recorded Speed (mph)”
The first step in hypothesis testing is to set up the null and
alternate hypothesis.
Question 1 – Multiple Choice: Based on the scenario just
described, which of the two would be a null hypothesis?
A
B.
The correct answer A
Recall that the null hypothesis states the claim. In this example,
the claim was that the average speed was 75 mph.
The next step in hypothesis testing is setting up the alternative
hypothesis.
Question 2 – Multiple Choice: Based on the scenario, which of
the two choices given would be the alternative hypothesis?
A
B
The correct answer is A.
The dispute to the claim is represented by the alternative
hypothesis. In this case, it was stated that your prediction was
that the average speed limit was less than 75 mph.
Question 3: After setting your null and alternative hypothesis,
you must calculate the sample mean.
The recorded speeds (mph) are (60 , 75, 80, 50, 45, 45, 55, 80,
75, 60, 50, 50, 50, 55, 55). The sample mean is found by adding
up all the speeds in the sample size and dividing by the number
(n) in the sample size. Which of the following is the sample
mean?
A. 59 mph
B. 885 mph
C. 50 mph
D. 80 mph
The correct answer is A. 59 mph. This is the answer when all 15
speeds are added together and divided by n – in this case, 15.
The mean can be calculated in Microsoft Excel. You would do
this by typing the following formal into a cell. =AVG(B3:
B17). This formula shows that the dataset that contains the
speeds starts in cell B3 and ends in B17.
When you hit “Enter”, the mean will appear. In this example,
the mean is 59.
Recall that there were 15 total speeds recorded. After finding
the sample mean of the 15 speeds (59), the sample standard
deviation can be found using the following formula:
Study this formula. Here is how it works.
To obtain the standard deviation you make a list of each of the x
values (in this case, the 15 recorded speeds) and subtract the
mean (59 mph) from each x value. Then, square each of the
values in the list and add them together to get the sum. For this
example, the sum is 2160. Then, divide this sum by 14 (this is
the degrees of freedom, and is calculated by subtracting 1 from
the sample size (15). 2160 / 14 = 154.29. Finally, take the
square root of 154.29, to arrive at 12.42.
The steps to calculate the sample standard deviation can be
completed in Microsoft Excel.
Here is an example of how to find the standard deviation.
Step 1: Type the following formula into a cell – “=B5-59”. This
formula represents the X-Value recorded in cell B5 – which is
80 mph. 59 is the mean. When you hit enter, 59 will be
subtracted from the value in cell B5 (80). This can be done for
all 15 speeds.
Once you calculate the recorded speed minus the mean for all
the recorded speeds, they should appear in Excel in their own
column, with the heading (Recorded speed – x values) – Mean.
Step 2: The next step is to square the difference between the x
values and the mean. This can be completed by filling out
another column in Excel. The formula is C3^2. C3 is the value
of the cell that has the recorded speed minus the mean. ^2 tells
Excel to square that value. This formula can be copied and
pasted into the remaining cells.
Step 3: The next step is to find the sum of the difference
square. To do this in Excel, you would find the sum of the
column of values calculated in Step 2. The formula used is
“=SUM(D3:D17). This shows that cells D3 through D17 contain
the squared values. This formula would be typed into the cell
beneath the dataset. (D19). When this is done – the result is
2160.
Step 4: The next step in the standard deviation formula is to
divide the sum just found by (n -1). Remember that the example
has 15 recorded speeds, so n is equal to 15.
In Excel you can take the sum of 2160 and divide by (n – 1) or
15. The following formula would be typed into a blank
cell: “=2160/14”. Excel will calculate the value to be
154.2857143.
Step 5: To complete the standard deviation formula, you need to
find the square root of 154.2857143. In Excel, this would be
done by typing “=SQRT(D22). Note that D22 contains the
number calculated in the last step: 154.2857143. Excel then
calculates the square root of this number to be
12.42118007. This can be rounded to 12.42, which is the sample
standard deviation.
Calculating the t-Value
Once the standard deviation is found, you can use the following
formula to find the t- value.
This formula says: T = (sample mean minus the mean of the
population) divided by the Standard Deviation (divided by the
square root of the sample size).
Following are the values that should be used in this formula:
The Sample Mean is 59
The Mean of the population is 75
The Standard Deviation is 12.42
The Sample size is 15.
This can be entered into Excel as follows:
=(59 – 75)/(12.42/SQRT(15))
The value for this formula is -4.99. When using the t-table for a
one-tailed t-test of 0.05 significance level and 14 degrees of
freedom, you should arrive at -1.761.
Note: if you arrive at a negative t-value for a left, one tailed-
test, as in this example, you can use the t-table, but put a
negative sign in front of the number, because the one-tailed left
test is testing in the negative direction.
Read It
Steps in Hypothesis Testing
· Step One: Set up the test parameters (mean)
· For example, state that there is no difference between what is
claimed and what is examined with the data.
· The test is set up with a null (claim) and an alternative (being
researched) hypothesis.
· Step Two: Decide on how significant the test needs to be.
· The more valuable test results will require a more strict
rejection value.
· Step Three: Collect the data for examination.
· Representative sampling techniques are used for collecting the
data.
· Step Four: Analyze the claim versus the actual data collected.
· Step Five: Once the data have been analyzed, the conclusion
can be given.
Type I and Type II Errors
· Type I errors occur when the null hypothesis has been rejected
incorrectly.
· The level of significance (alpha level) can be very strict to try
not to have this type of error occur.
· However, the tradeoff is that lower Type I errors give higher
Type II errors.
· A Type II error occurs when the alternative was accepted
incorrectly.
· Both errors can occur from faulty data or a poor sample.
Deciding the level of significance (alpha values)
· The level of significance is determined by the strictness of the
test's outcome.
· For example, if a test is designed to ensure the safety of an
airplane, the results need to be stricter than a test that is
determining if the correct amount of potato chips is in a
particular bag.
P-values
P-values are typically more prevalent when reporting the results
of a hypothesis test because they give the probability that the
sampled value would occur given the claim of the test. A higher
probability ensures that the claim seems very likely whereas a
small probability states that either the sampled data are bad or
the claim is false. P-values are found either with a distribution
table or with computer software.
One-Tail and Two-Tailed Hypothesis Tests
When hypothesis tests are set up, the researcher is either
looking to see if there is a difference or the values are too large
or small. If the researcher is looking for a difference in the
claim, this is a two-tailed hypothesis test. The two-tailed test
states that if the value is too far below or above the mean, then
the null will be rejected. A one-tail test, however, may only be
rejected if the value is too far below the claim or, in a separate
test, too far above the claim. The use of the word tail is
represented in the distribution of the data cutting off both tails
or only the top or bottom tail. In the following figure, the
shaded region signifies the rejection area:
For example, the researcher may want to know if there is a
difference (two-tail) in a student’s score, either being very high
or very low versus the rest of the class. However, for a light
bulb, the researcher may only care if it is not lasting as long as
the manufacturer reports (one-tail—left). Quality control may
also be interested if an item has been overstocked in packaging
(one-tail—right).
Z value
The z value is the test statistic that is calculated from sampled
data. The z value is calculated by subtracting the mean of the
sample data and the hypothesized mean, and then dividing the
standard error, where the standard error is given by the standard
deviation divided by the square root of the sample size, as in
the following equation:
Once the test statistics have been calculated, the value is looked
up in a standard normal table. The value that is found in the
table gives the p-value. Then, the decision for rejecting or not
rejecting the null hypothesis can be made based on the value
from the table compared to the level of significance.
Difference Between z and t Distributions
The t distributions are used when the sample size is less than 30
samples. The t distribution requires looking up the value in a t
table with the known degrees of freedom. The degrees of
freedom are found by n – 1, or one less than the sample size.
Comparing Two Means for a Hypothesis Test
When comparing two means, the null hypothesis is set up as the
two means are equal, meaning there is no significant statistical
difference in their values whereas the alternative can be set up
as one-tail or two-tail, depending on if the researcher is
examining a difference or a high or low value. For example, the
following hypothesis setup states that the alternative is claiming
the mean values are not the same:
The test statistic, or z value, is found by the differences of the
sample mean and hypothesized mean divided by the square root
of the standard error as in the following equation:
Note that if there is not a difference in the hypothesized means,
then the value of , meaning that.
Sample Problem 1
According to the city of Shumaker Falls, Texas, the average
monthly rent for a one bedroom apartment is $875. A real estate
agent claims that this average has decreased since the
information was calculated. Determine the null and alternative
hypothesis, and explain what is meant by making a Type I or
Type II error.
Answer
Set up the hypothesis with the following equations:
Note that the alternative is less than because the real estate
agent is claiming that the rent has decreased.
A Type I error would occur if the test concludes that the rent
has decreased when it really did not. This may occur if the
sample was not representative of the true population of
apartment rentals in Shumaker Falls.
A Type II error would occur if the test resulted that there was a
decrease in the average monthly rent of the apartment when
there really was not. Again, this could occur if a poorly
representative sample was taken that only consisted of low-rent
apartments, for example, in a particular low-rent area.
Sample Problem 2
If the p-value for a hypothesis tests is 0.0327 and the level of
significance is 0.05, what is your decision based on the test?
Decipher the p-value.
Answer
Because the p-value of 0.0327 is less than the level of
significance of 0.05, this implies that the probability the value
of the claim is true, given that the p-value is 0.0327, which is a
very small probability. Thus, the null hypothesis for the test
would be rejected.
Read It
Hypothesis testing is one of the fundamental concepts in both
scientific research and business decision making. It involves
establishing a hypothesis (an educated guess) about the outcome
of an event or experiment and then gathering evidence (data) to
decide whether the hypothesis should be accepted or rejected.
Another way to think of it is that the hypothesis is an opinion
about the value of something for a population; then, data are
gathered from a representative sample from that population to
make a decision as to whether the opinion is true.
Here are some examples of business problems that can be
addressed using hypothesis testing:
· Should we change our advertising campaign? Does the new
campaign have higher recall scores than the current campaign?
· Do we need to change a critical machine part more often
(because downtime exceeds a certain threshold)?
· Do the computers from Manufacturer A really run faster than
the computers from Manufacturer B?
· Does Trucking Company D provide more reliable service than
Trucking Company E (does it have more on-time deliveries)?
The first step in conducting a hypothesis test is to formulate a
statement that describes an expectation or assumption to test.
The next step is to derive a statement that is the opposite. The
opposite statement is called the null hypothesis and is
represented as H0 (read as H subzero, H for hypothesis and 0
for no difference). The null hypothesis usually has “not” or “no
different from” in it. Thealternative hypothesis (H1, H subone)
is the expectation or assumption.
Here are the null and alternative hypotheses for the four
examples above:
H0: Recall scores for the new ad campaign are not better or
higher than those from the current campaign.
H1: Recall scores for the new ad campaign are better or higher
than those from the current campaign.
H0: Machine X is not malfunctioning more often than y times
per week.
H1: Machine X is malfunctioning more often than y times per
week.
H0: Computers from Manufacturer A do not run faster than
those from Manufacturer B.
H1: Computers from Manufacturer A run faster than those from
Manufacturer B.
H0: Trucking Company D does not have more on-time deliveries
than Trucking Company E.
H1: Trucking Company D has more on-time deliveries than
Trucking Company E.
The null hypothesis is that which is tested. Keep in mind that
the result of a hypothesis test is that you either reject or accept
the null hypothesis. You do not prove that the alternative
hypothesis is true, just that there is proof beyond a reasonable
doubt that it is true. That is why conclusions are often phrased
as “the results do not allow us to reject H0” or “we fail to reject
H0.” This means that there is ample evidence to support the
alternative hypothesis as not occurring due to mere chance.
The significance level of the test is the risk you are willing to
take of rejecting the null hypothesis when, in fact, it is true.
This level must be decided before you collect data and is related
to how large a sample you will need. Hypothesis testing relies
on a sample and not on the entire population, so there is a
chance for two kinds of errors:
· Type I error: rejecting the null hypothesis when it is true (we
think there is a difference when there is not); this tends to result
in lost profits because we make a decision to act (usually
spending money and other resources) when we should not
have—the test’s significance measures this (the most common
level is 95%)
· Type II error: accepting the null hypothesis when it is false
(we think there is no difference when there really is); this tends
to result in lost opportunity because we do not proceed with
something we should have—the test’s power measures this and
equals 1 - significance, so it is usually 5%
The following chart helps distinguish the Type I and Type II
errors:
Null Hypothesis
Accept H0
Reject H0
H0 is really true
Correct decision
Type I error
H0 is really false
Type II error
Correct decision
Type I and Type II errors for the examples follow:
Type I
Type II
Should we change our advertising campaign? Does the new
campaign have higher recall scores than the current campaign?
Test says new campaign is better, so we go ahead with that. It
actually turns out to be worse, and we lose sales.
Test says new campaign is no better than the current one, so we
do not change campaigns. The new campaign was actually
better, and we would have had higher sales if we had changed.
Do we need to change a critical machine part more often
(because downtime exceeds a certain threshold)?
Test says downtime exceeds the threshold, so we change the
part more often. Downtime really does not exceed the threshold,
so money and time are wasted changing the part more often than
is necessary.
Test says downtime does not exceed the threshold, so part is not
changed more often. Downtime actually does exceed the
threshold, and the line is down more often than it would be if
we changed the part at the right time.
Do the computers from Manufacturer A really run faster than
the computers from Manufacturer B?
Test says computers from Mfr A run faster than those from Mfr
B, so we switch to Mfr A. They really do not run any faster, so
we wasted money switching to Mfr A.
Test says computers from Mfr A do not run faster than those
from Mfr B, so we do not switch to Mfr A. We forego
productivity gains because computers from Mfr A really do run
faster.
Does Trucking Company D provide more reliable service than
Trucking Company E (do they have more on-time deliveries)?
Test says Trucking Company D has a higher proportion of on-
time deliveries, so we switch to them. It turns out they really
don’t have more on-time deliveries, so we switched from
Trucking Company E for no reason and could be losing if
Trucking Company D has fewer (as opposed to the same) % of
on-time deliveries as Company E.
Test says Trucking Company D does not have a higher
proportion of on-time deliveries than Trucking Company E, so
we keep our business with Trucking Company E. Trucking
Company D does have better on-time delivery performance, so
we miss out on productivity gains.
You must decide whether you need a one-tailed or two-tailed
test when designing a hypothesis. If you want to know if one
thing is just different than the other (either greater or less,
faster or slower, and so on), use atwo-tailed test. If you are
testing to see whether one is better or worse than the other, then
use a one-tailed test. One-tailed tests are more common.
(Statistics software will have options for one- or two-tailed
tests, so you must choose the right one.)
One- or two-tailed test?
Why?
Should we change our advertising campaign? Does the new
campaign have higher recall scores than the current campaign?
One-tailed
Does the new campaign have higher scores than the current
campaign, not higher or lower scores?
Do we need to change a critical machine part more often
(because downtime exceeds a certain threshold)?
One-tailed
Is the downtime greater than some threshold, not just if it is
different (greater or less) than that threshold.
Do the computers from Manufacturer A really run faster than
the computers from Manufacturer B?
One-tailed
Do Mfr A computers run faster, not faster or slower.
Does Trucking Company D provide more reliable service than
Trucking Company E (do they have more on-time deliveries)?
One-tailed
Does trucking Company D have a higher proportion of on-time
deliveries than Trucking Company E, not a higher or lower
proportion?
Data Collection
Businesses and organizations of all types produce significant
quantities of data. The majority of these data are generated from
normal business operations. For example, each sales transaction
of a beverage manufacturer will contain data about the date of
the sale, the product sold, the amount of the sale, the customer,
the region of the sale, and perhaps the salesperson. These are
primary data, and collection of this type of data typically occurs
automatically within the organization through the organization’s
databases that store the transactions. Other primary data are
collected to measure operational performance toward specific
objectives. For example, a package delivery company may track
driver safety performance over a period of time over certain
routes during each day of the week. A copper mining company
may collect information on the weight of ore hauled by each
truck to understand if truckloads are optimized. A retail store
may collect data on customer traffic in the store each hour.
Credit card companies may measure how quickly customer
service calls are answered.
In addition to company and transaction specific data,
organizations and businesses frequently collect financial and
market data about competitors, suppliers, customers, and others
to guide effective decision making. This data collection effort
occurs outside the business and might involve tools such as
surveys, interviews, and questionnaires. For example, a
manufacturer of appliances might ask its suppliers to produce
data on financial health, safety records, and measures of product
quality. A consumer goods company may distribute a new
product in a defined region and follow up with telephone
interviews to assess the product's performance and
attractiveness. National Family Opinion is a national
organization that uses the Internet and mail surveys to
understand consumer preferences and reactions to specific
grocery and nongrocery items. Other site collect data on
political opinion for use by political campaigns and journalists.
A financial services company that is interested in acquiring
another financial institution would require data on the
acquisition target’s customer base, branches, and deposits. If
any of these data are collected by a third party, such as an
independent market research group, or if the data are purchased
(such as a customer list), the data are considered secondary
data. Whether primary or secondary data, users must always be
aware of the collection tools and data sources to ensure fairly
measured and accurate data. Having correctly measured data
from unbiased samples or sources is critical to correct decision
making.
Graphs, Charts, and Tables
Graphs, charts, and tables are tools to help organize and
aggregate data upon collection. Each tool helps transform the
data into information useful in decision making. Graphs and
charts visually present summaries and relationships. For
example, a pie chart could visually summarize the percentage of
sales dollars in each sales region for a beverage distributor. A
frequency distribution could identify the number of salespeople
that achieved specific performance targets (e.g., sales or sales
growth). A bar chart might compare the quantity of ore hauled
by different types of trucks in dry versus wet weather to
estimate the effect of weather on mining production. Line charts
or graphs frequently involve how performance changes over
time. For example, a financial services company might plot a
line chart of the growth in deposits by type over time for its
acquisition target. Another graph might identify a relationship
between the change in sales of soft drinks versus bottled water
over the last 5 years, or the change in sales around different
levels of marketing. Unlike the visual relationships presented in
charts and graphs, tables present summary data in columns and
rows, leaving the user to identify and understand relationships.
Presentation of data in tables allows users to better understand
the data points, range, and distribution characteristics. What is
the preferred method of presenting collected data? A
combination of visual charts and graphs and tabular
presentations ideally describe a set of data and explain the
relationships. Pictures minimize the need to explain
relationships verbally. However, tabular presentations of data
allow users to develop their own understanding of the data and
relationships.
Numerical Measures
Numerical measures describe data samples and populations to
better understand the central point and spread of the data.
Numerical measures, such as the mean, median, and mode
describe the central tendency or common point of the data.
Variance and standard deviation describe the spread of the data.
The variance is the square of the standard deviation. Since the
unit measure is squared in the variance, standard deviation is
more commonly used to get to the original units.
These measures together allow users to make inferences about
the data that can be used to answer questions and make
decisions with a statistical measurement of confidence. For
example, consider a set of data collected to understand the
effect of a smoking ban on restaurant sales. The mean sales is
the average level of sales. The median sales is the sales point
where half of all observations are greater than the median and
half are below the median. The most common data point defines
the mode. Typically, the mode is more commonly reported
among discrete or categorical data rather than continuous data.
For example, if restaurant patrons rate service quality on a scale
of 1 (poor) to 5 (excellent) with the following distribution, then
the mode is 4.
Rating
Percent of Responses
1
5%
2
15%
3
30%
4
40%
5
10%
Although data may have similar central points, the variance and
standard deviation describe how spread out the data distribution
is. For example, do a significant number of data points remain
around the central tendency points, or are the data points spread
out on one or both sides of the center point? For example,
although average restaurant sales are the same before and after
a smoking ban, the level of the sales may be found to be more
spread out prior to the ban compared to after the ban. Rather
than concluding no effect of a ban, a difference in the variance
of sales may suggest that a greater variety of customers are
attracted to the restaurants after the ban.
Running head: BUSN311 - Quantitative Methods and Analysis
1
Unit 4 – Hypothesis Testing & Variance
Type your Name Here
American InterContinental University
Abstract
This is a single paragraph, no indentation is required. The next
page will be an abstract; “a brief, comprehensive summary of
the contents of the article; it allows the readers to survey the
contents of an article quickly” (Publication Manual, 2010). The
length of this abstract should be 35-50 words (2-3 sentences).
NOTE: the abstract must be on page 2 and the body of the paper
will begin on page 3.
Introduction
Remember to always indent the first line of a paragraph (use the
tab key). The introduction should be short (2-3 sentences). The
margins, font size, spacing, and font type (italics or plain) are
set in APA format. While you may change the names of the
headings and subheadings, do not change the font or style of
font.
Hypothesis Test #1 Looking at Intrinsic Satisfaction by Gender
Null and alternate hypotheses.
Write out a Null & Alternate Hypothesis (alpha = .05).
The test
Use Excel to perform the test. Paste the results in the document.
In a separate sentence, specifically identify the significance
level (alpha), the test statistics and the critical value.
State your decision
State whether you are rejecting or failing to reject the null
hypothesis statement. Explanation of decision made
Comment on why you are making your decision in terms of how
the test statistic
compares to the critical value or in terms of how the p value
compares to the alpha. Applications for managers
Discuss how the manager of the company could use this
information specifically. Why is this information valuable?
Hypothesis Test #2 Looking at Extrinsic Satisfaction by
Position
Null and alternate hypotheses
Write out a Null & Alternate Hypothesis (alpha = .05).
The test
Use Excel to perform the test. Paste the results in the document
In a separate sentence, specifically identify the significance
level (alpha), the test statistics and the critical value.
State your decision
State whether you are rejecting or failing to reject the null
hypothesis statement. Explanation of decision made
Comment on why you are making your decision in terms of how
the test statistic compares to the critical value or in terms of
how the p value compares to the alpha.
Applications for managers
Discuss how the manager of the company could use this
information specifically. Why is this information valuable?
Z and T Tests
Explain the difference between the Z and T test and when each
one is used.
Samples and Populations
Explain the difference between a sample and the population.
Why are samples used for hypothesis tests? Be sure to be
specific.
Conclusion
Add some concluding remarks in about 2-3 sentences.
References
NOTE: The reference list starts on a new page after your
conclusion.
For help with formatting citations and references using rules
outlined in the APA Manual’s 6th Edition, please check out the
AIU APA guide located under the Interactive Learning section
on the left side of the course.
Examples:
American Psychological Association [APA]. (2010) Publication
manual of the American
Psychological association (6th ed.). Washington, DC: Author.
Association of Legal Writing Directors (ALWD) (2005). ALWD
citation manual: A professional
system of citation (3rd ed.). New York: Aspen Publishers.
TEST #1Perform the following two-tailed hypothesis test, using a.docx

TEST #1Perform the following two-tailed hypothesis test, using a.docx

  • 1.
    TEST #1 Perform thefollowing two-tailed hypothesis test, using a .05 significance level: · Intrinsic by Gender · State the null and an alternate statement for the test · Use Microsoft Excel (Data Analysis Tools) to process your data and run the appropriate test. Copy and paste the results of the output to your report in Microsoft Word. · Identify the significance level, the test statistic, and the critical value. · State whether you are rejecting or failing to reject the null hypothesis statement. · Explain how the results could be used by the manager of the company. TEST #2 Perform the following two-tailed hypothesis test, using a .05 significance level: · Extrinsic variable by Position Type · State the null and an alternate statement for the test · Use Microsoft Excel (Data Analysis Tools) to process your data and run the appropriate test. · Copy and paste the results of the output to your report in Microsoft Word. · Identify the significance level, the test statistic, and the critical value. · State whether you are rejecting or failing to reject the null hypothesis statement. · Explain how the results could be used by the manager of the company. GENERAL ANALYSIS (Research Required) Using your textbook or other appropriate college-level resources: · Explain when to use a t-test and when to use a z-test. Explore the differences.
  • 2.
    · Discuss whysamples are used instead of populations. The report should be well written and should flow well with no grammatical errors. It should include proper citation in APA formatting in both the in-text and reference pages and include a title page, be double-spaced, and in Times New Roman, 12- point font. APA formatting is necessary to ensure academic honesty. Be sure to provide references in APA format for any resource you may use to support your answers. Making Inferences When data are collected, various summary statistics and graphs can be used for describing data; however, learning about what the data mean is where the power of statistics starts. For example, is there really a difference between two leading cola products? Hypothesis testing is an example of making these types of inferences on data sets. Hypothesis Tests Claims are made all the time, such as a particular light bulb will last a certain number of hours. Claims like this are tested with hypothesis testing. It is a straight forward procedure that consists of the following steps: 1. A claim is made. 2. A value for probability of significance is chosen. 3. Data are collected. 4. The test is performed. 5. The results are analyzed. Hypothesis tests are performed on the mean of the population. µ It is not possible to test the full population. For example, it would be impossible to test every light bulb. Instead, the hypothesis test is performed on a sample of the population. Setting up a Hypothesis Test
  • 3.
    When performing hypothesistesting, the test is setup with a null hypothesis (or claim) and the alternative hypothesis. The null hypothesis (the claim) is · what is being disputed · represented by The alternative hypothesis is · what is being researched · represented by Example: If testing the claim that light bulbs last 3,500 hours, then the hypothesis is written as follows: Question 1 - Multiple Choice: In the above example, which statement is the null hypothesis? A. B. The correct answer is A. A. represents the null hypothesis. B. represents the alternative hypothesis. One -Tail and Two-Tail Hypothesis Testing When hypothesis tests are set up, the researcher is either looking to see if there is a difference or if the values are too large or small. If the researcher is looking for a difference from what is being claimed, the test is a two-tail test. A two-tail test states that if the value is too far below or above the mean, then the null will be rejected. One-tail tests are tests that are concerned with values that are greater than (right-tail) or less than (left-tail) the mean. In the light bulb example, which type of test is used for the following hypothesis? A. Two-tail
  • 4.
    B. One-Tail (Righttail) C. One-Tail (Left-tail) The correct answer is C. One-Tail (Left-tail). For the light bulb test, the test results are only significant if the bulbs last less than 3,500 hours. Outcomes of Hypothesis Testing When a hypothesis test is performed, the claim is always assumed to be true unless proven otherwise. There are two outcomes for a hypothesis test: Reject the claim Fail to reject the claim Note: You never state that you accept the null hypothesis. You can only state that there is not enough evidence to fail to reject. Level of Significance Before a hypothesis test is made, one must decide the level of significance. To understand the level of significance, it is important to first understand the errors that can occur when testing. Remember that the sample is being tested, not the entire population. There are two types of errors that can occur: Type I and Type II. · Type I Error: Rejecting the null erroneously. The null should not have been rejected. · Type II Error: The null is not rejected erroneously. The null should have been rejected. In the light bulb example, the testing showed that the light bulbs did not perform for 3,500 hours. The tester rejected the null hypothesis, which stated that the light bulbs last 3,500 hours. Remember the statement: It was then found that the test was performed on a batch of faulty light bulbs. These light bulbs did not represent the average light bulb, so the test results were not accurate. Which type of error occurred?
  • 5.
    A. Type I B.Type II The correct answer is A. Type I. The null hypothesis was rejected; however, it was done so erroneously. The tests were performed on a faulty batch of light bulbs that did not represent the average light bulb. Level of Significance The significance level of the test is the risk you are willing to take of rejecting the null hypothesis, when, in fact, it is true. The level of significance is given in terms of alpha. Typical values are .01 and.05. .01 is the stricter of the two. Performing the Test After the hypothesis has been set up and the significance level has been set, data are collected. After the data are collected, the sample mean is calculated and is tested. Testing includes finding the P- value, which is the probability that if the population mean is true. The sample value will fit the data set. P-Values are calculated using the z-Test. First, the value z is found with the following formula. Following are descriptions of the parts of this formula. The P-value is then found by looking up z, on a normal table, or it is calculated using software. Using Z-test versus t-Test When the sample size is 30 or greater, the normal table (z-test) that was just described is used; however, when a sample is less than 30, the p-value s are found in a t distribution table. When looking up values in a t table, the value called degrees of freedom is used. The degrees of freedom are the sample size (n) minus 1. Hypothesis Test – Decision When the P-value is calculated, it is compared with the level of significance to make the decision on whether to reject the null
  • 6.
    hypothesis. In thenext exercise, Part 2, you will have a chance to see in detail how this decision is made. Practice: One Population Parameter The following data set gives the speeds taken this year from 15 random cars driving on a road with a speed limit of 55 mph. The authorities have given data that states the average speed recorded from the year before in the same area was 75 mph. You feel that the average is lower this year because so many speeders were seen receiving tickets the year before. Using the sample data, we will set up a hypothesis test based on the claim. Carefully follow each of the steps involved in the test. We will use a significance level of 0.05. This activity also gives instructions on how to use Microsoft Excel for solving this problem, so you can do this in Excel if you wish. This will be a big help in solving statistics equations and in future assignments. Following is a list of the 15 recorded speeds: 60, 75, 80, 50, 45, 45, 55, 80, 75, 60, 50, 50, 50, 55, 55. In Excel, these should be put in a column labeled “Recorded Speed (mph)” The first step in hypothesis testing is to set up the null and alternate hypothesis. Question 1 – Multiple Choice: Based on the scenario just described, which of the two would be a null hypothesis? A B. The correct answer A Recall that the null hypothesis states the claim. In this example, the claim was that the average speed was 75 mph. The next step in hypothesis testing is setting up the alternative hypothesis. Question 2 – Multiple Choice: Based on the scenario, which of
  • 7.
    the two choicesgiven would be the alternative hypothesis? A B The correct answer is A. The dispute to the claim is represented by the alternative hypothesis. In this case, it was stated that your prediction was that the average speed limit was less than 75 mph. Question 3: After setting your null and alternative hypothesis, you must calculate the sample mean. The recorded speeds (mph) are (60 , 75, 80, 50, 45, 45, 55, 80, 75, 60, 50, 50, 50, 55, 55). The sample mean is found by adding up all the speeds in the sample size and dividing by the number (n) in the sample size. Which of the following is the sample mean? A. 59 mph B. 885 mph C. 50 mph D. 80 mph The correct answer is A. 59 mph. This is the answer when all 15 speeds are added together and divided by n – in this case, 15. The mean can be calculated in Microsoft Excel. You would do this by typing the following formal into a cell. =AVG(B3: B17). This formula shows that the dataset that contains the speeds starts in cell B3 and ends in B17. When you hit “Enter”, the mean will appear. In this example, the mean is 59. Recall that there were 15 total speeds recorded. After finding the sample mean of the 15 speeds (59), the sample standard deviation can be found using the following formula: Study this formula. Here is how it works. To obtain the standard deviation you make a list of each of the x
  • 8.
    values (in thiscase, the 15 recorded speeds) and subtract the mean (59 mph) from each x value. Then, square each of the values in the list and add them together to get the sum. For this example, the sum is 2160. Then, divide this sum by 14 (this is the degrees of freedom, and is calculated by subtracting 1 from the sample size (15). 2160 / 14 = 154.29. Finally, take the square root of 154.29, to arrive at 12.42. The steps to calculate the sample standard deviation can be completed in Microsoft Excel. Here is an example of how to find the standard deviation. Step 1: Type the following formula into a cell – “=B5-59”. This formula represents the X-Value recorded in cell B5 – which is 80 mph. 59 is the mean. When you hit enter, 59 will be subtracted from the value in cell B5 (80). This can be done for all 15 speeds. Once you calculate the recorded speed minus the mean for all the recorded speeds, they should appear in Excel in their own column, with the heading (Recorded speed – x values) – Mean. Step 2: The next step is to square the difference between the x values and the mean. This can be completed by filling out another column in Excel. The formula is C3^2. C3 is the value of the cell that has the recorded speed minus the mean. ^2 tells Excel to square that value. This formula can be copied and pasted into the remaining cells. Step 3: The next step is to find the sum of the difference square. To do this in Excel, you would find the sum of the column of values calculated in Step 2. The formula used is “=SUM(D3:D17). This shows that cells D3 through D17 contain the squared values. This formula would be typed into the cell beneath the dataset. (D19). When this is done – the result is 2160. Step 4: The next step in the standard deviation formula is to divide the sum just found by (n -1). Remember that the example has 15 recorded speeds, so n is equal to 15. In Excel you can take the sum of 2160 and divide by (n – 1) or 15. The following formula would be typed into a blank
  • 9.
    cell: “=2160/14”. Excelwill calculate the value to be 154.2857143. Step 5: To complete the standard deviation formula, you need to find the square root of 154.2857143. In Excel, this would be done by typing “=SQRT(D22). Note that D22 contains the number calculated in the last step: 154.2857143. Excel then calculates the square root of this number to be 12.42118007. This can be rounded to 12.42, which is the sample standard deviation. Calculating the t-Value Once the standard deviation is found, you can use the following formula to find the t- value. This formula says: T = (sample mean minus the mean of the population) divided by the Standard Deviation (divided by the square root of the sample size). Following are the values that should be used in this formula: The Sample Mean is 59 The Mean of the population is 75 The Standard Deviation is 12.42 The Sample size is 15. This can be entered into Excel as follows: =(59 – 75)/(12.42/SQRT(15)) The value for this formula is -4.99. When using the t-table for a one-tailed t-test of 0.05 significance level and 14 degrees of freedom, you should arrive at -1.761. Note: if you arrive at a negative t-value for a left, one tailed- test, as in this example, you can use the t-table, but put a negative sign in front of the number, because the one-tailed left test is testing in the negative direction. Read It Steps in Hypothesis Testing · Step One: Set up the test parameters (mean) · For example, state that there is no difference between what is claimed and what is examined with the data.
  • 10.
    · The testis set up with a null (claim) and an alternative (being researched) hypothesis. · Step Two: Decide on how significant the test needs to be. · The more valuable test results will require a more strict rejection value. · Step Three: Collect the data for examination. · Representative sampling techniques are used for collecting the data. · Step Four: Analyze the claim versus the actual data collected. · Step Five: Once the data have been analyzed, the conclusion can be given. Type I and Type II Errors · Type I errors occur when the null hypothesis has been rejected incorrectly. · The level of significance (alpha level) can be very strict to try not to have this type of error occur. · However, the tradeoff is that lower Type I errors give higher Type II errors. · A Type II error occurs when the alternative was accepted incorrectly. · Both errors can occur from faulty data or a poor sample. Deciding the level of significance (alpha values) · The level of significance is determined by the strictness of the test's outcome. · For example, if a test is designed to ensure the safety of an airplane, the results need to be stricter than a test that is determining if the correct amount of potato chips is in a particular bag. P-values P-values are typically more prevalent when reporting the results of a hypothesis test because they give the probability that the sampled value would occur given the claim of the test. A higher probability ensures that the claim seems very likely whereas a small probability states that either the sampled data are bad or the claim is false. P-values are found either with a distribution table or with computer software.
  • 11.
    One-Tail and Two-TailedHypothesis Tests When hypothesis tests are set up, the researcher is either looking to see if there is a difference or the values are too large or small. If the researcher is looking for a difference in the claim, this is a two-tailed hypothesis test. The two-tailed test states that if the value is too far below or above the mean, then the null will be rejected. A one-tail test, however, may only be rejected if the value is too far below the claim or, in a separate test, too far above the claim. The use of the word tail is represented in the distribution of the data cutting off both tails or only the top or bottom tail. In the following figure, the shaded region signifies the rejection area: For example, the researcher may want to know if there is a difference (two-tail) in a student’s score, either being very high or very low versus the rest of the class. However, for a light bulb, the researcher may only care if it is not lasting as long as the manufacturer reports (one-tail—left). Quality control may also be interested if an item has been overstocked in packaging (one-tail—right). Z value The z value is the test statistic that is calculated from sampled data. The z value is calculated by subtracting the mean of the sample data and the hypothesized mean, and then dividing the standard error, where the standard error is given by the standard deviation divided by the square root of the sample size, as in the following equation: Once the test statistics have been calculated, the value is looked up in a standard normal table. The value that is found in the table gives the p-value. Then, the decision for rejecting or not rejecting the null hypothesis can be made based on the value from the table compared to the level of significance. Difference Between z and t Distributions The t distributions are used when the sample size is less than 30 samples. The t distribution requires looking up the value in a t
  • 12.
    table with theknown degrees of freedom. The degrees of freedom are found by n – 1, or one less than the sample size. Comparing Two Means for a Hypothesis Test When comparing two means, the null hypothesis is set up as the two means are equal, meaning there is no significant statistical difference in their values whereas the alternative can be set up as one-tail or two-tail, depending on if the researcher is examining a difference or a high or low value. For example, the following hypothesis setup states that the alternative is claiming the mean values are not the same: The test statistic, or z value, is found by the differences of the sample mean and hypothesized mean divided by the square root of the standard error as in the following equation: Note that if there is not a difference in the hypothesized means, then the value of , meaning that. Sample Problem 1 According to the city of Shumaker Falls, Texas, the average monthly rent for a one bedroom apartment is $875. A real estate agent claims that this average has decreased since the information was calculated. Determine the null and alternative hypothesis, and explain what is meant by making a Type I or Type II error. Answer Set up the hypothesis with the following equations: Note that the alternative is less than because the real estate agent is claiming that the rent has decreased. A Type I error would occur if the test concludes that the rent has decreased when it really did not. This may occur if the sample was not representative of the true population of apartment rentals in Shumaker Falls. A Type II error would occur if the test resulted that there was a decrease in the average monthly rent of the apartment when there really was not. Again, this could occur if a poorly
  • 13.
    representative sample wastaken that only consisted of low-rent apartments, for example, in a particular low-rent area. Sample Problem 2 If the p-value for a hypothesis tests is 0.0327 and the level of significance is 0.05, what is your decision based on the test? Decipher the p-value. Answer Because the p-value of 0.0327 is less than the level of significance of 0.05, this implies that the probability the value of the claim is true, given that the p-value is 0.0327, which is a very small probability. Thus, the null hypothesis for the test would be rejected. Read It Hypothesis testing is one of the fundamental concepts in both scientific research and business decision making. It involves establishing a hypothesis (an educated guess) about the outcome of an event or experiment and then gathering evidence (data) to decide whether the hypothesis should be accepted or rejected. Another way to think of it is that the hypothesis is an opinion about the value of something for a population; then, data are gathered from a representative sample from that population to make a decision as to whether the opinion is true. Here are some examples of business problems that can be addressed using hypothesis testing: · Should we change our advertising campaign? Does the new campaign have higher recall scores than the current campaign? · Do we need to change a critical machine part more often (because downtime exceeds a certain threshold)? · Do the computers from Manufacturer A really run faster than the computers from Manufacturer B? · Does Trucking Company D provide more reliable service than Trucking Company E (does it have more on-time deliveries)? The first step in conducting a hypothesis test is to formulate a statement that describes an expectation or assumption to test. The next step is to derive a statement that is the opposite. The
  • 14.
    opposite statement iscalled the null hypothesis and is represented as H0 (read as H subzero, H for hypothesis and 0 for no difference). The null hypothesis usually has “not” or “no different from” in it. Thealternative hypothesis (H1, H subone) is the expectation or assumption. Here are the null and alternative hypotheses for the four examples above: H0: Recall scores for the new ad campaign are not better or higher than those from the current campaign. H1: Recall scores for the new ad campaign are better or higher than those from the current campaign. H0: Machine X is not malfunctioning more often than y times per week. H1: Machine X is malfunctioning more often than y times per week. H0: Computers from Manufacturer A do not run faster than those from Manufacturer B. H1: Computers from Manufacturer A run faster than those from Manufacturer B. H0: Trucking Company D does not have more on-time deliveries than Trucking Company E. H1: Trucking Company D has more on-time deliveries than Trucking Company E. The null hypothesis is that which is tested. Keep in mind that the result of a hypothesis test is that you either reject or accept the null hypothesis. You do not prove that the alternative hypothesis is true, just that there is proof beyond a reasonable doubt that it is true. That is why conclusions are often phrased as “the results do not allow us to reject H0” or “we fail to reject H0.” This means that there is ample evidence to support the alternative hypothesis as not occurring due to mere chance. The significance level of the test is the risk you are willing to take of rejecting the null hypothesis when, in fact, it is true. This level must be decided before you collect data and is related to how large a sample you will need. Hypothesis testing relies on a sample and not on the entire population, so there is a
  • 15.
    chance for twokinds of errors: · Type I error: rejecting the null hypothesis when it is true (we think there is a difference when there is not); this tends to result in lost profits because we make a decision to act (usually spending money and other resources) when we should not have—the test’s significance measures this (the most common level is 95%) · Type II error: accepting the null hypothesis when it is false (we think there is no difference when there really is); this tends to result in lost opportunity because we do not proceed with something we should have—the test’s power measures this and equals 1 - significance, so it is usually 5% The following chart helps distinguish the Type I and Type II errors: Null Hypothesis Accept H0 Reject H0 H0 is really true Correct decision Type I error H0 is really false Type II error Correct decision Type I and Type II errors for the examples follow: Type I Type II Should we change our advertising campaign? Does the new campaign have higher recall scores than the current campaign? Test says new campaign is better, so we go ahead with that. It actually turns out to be worse, and we lose sales. Test says new campaign is no better than the current one, so we do not change campaigns. The new campaign was actually better, and we would have had higher sales if we had changed. Do we need to change a critical machine part more often (because downtime exceeds a certain threshold)?
  • 16.
    Test says downtimeexceeds the threshold, so we change the part more often. Downtime really does not exceed the threshold, so money and time are wasted changing the part more often than is necessary. Test says downtime does not exceed the threshold, so part is not changed more often. Downtime actually does exceed the threshold, and the line is down more often than it would be if we changed the part at the right time. Do the computers from Manufacturer A really run faster than the computers from Manufacturer B? Test says computers from Mfr A run faster than those from Mfr B, so we switch to Mfr A. They really do not run any faster, so we wasted money switching to Mfr A. Test says computers from Mfr A do not run faster than those from Mfr B, so we do not switch to Mfr A. We forego productivity gains because computers from Mfr A really do run faster. Does Trucking Company D provide more reliable service than Trucking Company E (do they have more on-time deliveries)? Test says Trucking Company D has a higher proportion of on- time deliveries, so we switch to them. It turns out they really don’t have more on-time deliveries, so we switched from Trucking Company E for no reason and could be losing if Trucking Company D has fewer (as opposed to the same) % of on-time deliveries as Company E. Test says Trucking Company D does not have a higher proportion of on-time deliveries than Trucking Company E, so we keep our business with Trucking Company E. Trucking Company D does have better on-time delivery performance, so we miss out on productivity gains. You must decide whether you need a one-tailed or two-tailed test when designing a hypothesis. If you want to know if one thing is just different than the other (either greater or less, faster or slower, and so on), use atwo-tailed test. If you are testing to see whether one is better or worse than the other, then use a one-tailed test. One-tailed tests are more common.
  • 17.
    (Statistics software willhave options for one- or two-tailed tests, so you must choose the right one.) One- or two-tailed test? Why? Should we change our advertising campaign? Does the new campaign have higher recall scores than the current campaign? One-tailed Does the new campaign have higher scores than the current campaign, not higher or lower scores? Do we need to change a critical machine part more often (because downtime exceeds a certain threshold)? One-tailed Is the downtime greater than some threshold, not just if it is different (greater or less) than that threshold. Do the computers from Manufacturer A really run faster than the computers from Manufacturer B? One-tailed Do Mfr A computers run faster, not faster or slower. Does Trucking Company D provide more reliable service than Trucking Company E (do they have more on-time deliveries)? One-tailed Does trucking Company D have a higher proportion of on-time deliveries than Trucking Company E, not a higher or lower proportion? Data Collection Businesses and organizations of all types produce significant quantities of data. The majority of these data are generated from normal business operations. For example, each sales transaction of a beverage manufacturer will contain data about the date of the sale, the product sold, the amount of the sale, the customer, the region of the sale, and perhaps the salesperson. These are primary data, and collection of this type of data typically occurs
  • 18.
    automatically within theorganization through the organization’s databases that store the transactions. Other primary data are collected to measure operational performance toward specific objectives. For example, a package delivery company may track driver safety performance over a period of time over certain routes during each day of the week. A copper mining company may collect information on the weight of ore hauled by each truck to understand if truckloads are optimized. A retail store may collect data on customer traffic in the store each hour. Credit card companies may measure how quickly customer service calls are answered. In addition to company and transaction specific data, organizations and businesses frequently collect financial and market data about competitors, suppliers, customers, and others to guide effective decision making. This data collection effort occurs outside the business and might involve tools such as surveys, interviews, and questionnaires. For example, a manufacturer of appliances might ask its suppliers to produce data on financial health, safety records, and measures of product quality. A consumer goods company may distribute a new product in a defined region and follow up with telephone interviews to assess the product's performance and attractiveness. National Family Opinion is a national organization that uses the Internet and mail surveys to understand consumer preferences and reactions to specific grocery and nongrocery items. Other site collect data on political opinion for use by political campaigns and journalists. A financial services company that is interested in acquiring another financial institution would require data on the acquisition target’s customer base, branches, and deposits. If any of these data are collected by a third party, such as an independent market research group, or if the data are purchased (such as a customer list), the data are considered secondary data. Whether primary or secondary data, users must always be aware of the collection tools and data sources to ensure fairly measured and accurate data. Having correctly measured data
  • 19.
    from unbiased samplesor sources is critical to correct decision making. Graphs, Charts, and Tables Graphs, charts, and tables are tools to help organize and aggregate data upon collection. Each tool helps transform the data into information useful in decision making. Graphs and charts visually present summaries and relationships. For example, a pie chart could visually summarize the percentage of sales dollars in each sales region for a beverage distributor. A frequency distribution could identify the number of salespeople that achieved specific performance targets (e.g., sales or sales growth). A bar chart might compare the quantity of ore hauled by different types of trucks in dry versus wet weather to estimate the effect of weather on mining production. Line charts or graphs frequently involve how performance changes over time. For example, a financial services company might plot a line chart of the growth in deposits by type over time for its acquisition target. Another graph might identify a relationship between the change in sales of soft drinks versus bottled water over the last 5 years, or the change in sales around different levels of marketing. Unlike the visual relationships presented in charts and graphs, tables present summary data in columns and rows, leaving the user to identify and understand relationships. Presentation of data in tables allows users to better understand the data points, range, and distribution characteristics. What is the preferred method of presenting collected data? A combination of visual charts and graphs and tabular presentations ideally describe a set of data and explain the relationships. Pictures minimize the need to explain relationships verbally. However, tabular presentations of data allow users to develop their own understanding of the data and relationships. Numerical Measures Numerical measures describe data samples and populations to better understand the central point and spread of the data. Numerical measures, such as the mean, median, and mode
  • 20.
    describe the centraltendency or common point of the data. Variance and standard deviation describe the spread of the data. The variance is the square of the standard deviation. Since the unit measure is squared in the variance, standard deviation is more commonly used to get to the original units. These measures together allow users to make inferences about the data that can be used to answer questions and make decisions with a statistical measurement of confidence. For example, consider a set of data collected to understand the effect of a smoking ban on restaurant sales. The mean sales is the average level of sales. The median sales is the sales point where half of all observations are greater than the median and half are below the median. The most common data point defines the mode. Typically, the mode is more commonly reported among discrete or categorical data rather than continuous data. For example, if restaurant patrons rate service quality on a scale of 1 (poor) to 5 (excellent) with the following distribution, then the mode is 4. Rating Percent of Responses 1 5% 2 15% 3 30% 4 40% 5 10% Although data may have similar central points, the variance and standard deviation describe how spread out the data distribution is. For example, do a significant number of data points remain around the central tendency points, or are the data points spread out on one or both sides of the center point? For example, although average restaurant sales are the same before and after
  • 21.
    a smoking ban,the level of the sales may be found to be more spread out prior to the ban compared to after the ban. Rather than concluding no effect of a ban, a difference in the variance of sales may suggest that a greater variety of customers are attracted to the restaurants after the ban. Running head: BUSN311 - Quantitative Methods and Analysis 1 Unit 4 – Hypothesis Testing & Variance Type your Name Here American InterContinental University Abstract This is a single paragraph, no indentation is required. The next page will be an abstract; “a brief, comprehensive summary of the contents of the article; it allows the readers to survey the contents of an article quickly” (Publication Manual, 2010). The length of this abstract should be 35-50 words (2-3 sentences). NOTE: the abstract must be on page 2 and the body of the paper will begin on page 3. Introduction Remember to always indent the first line of a paragraph (use the tab key). The introduction should be short (2-3 sentences). The
  • 22.
    margins, font size,spacing, and font type (italics or plain) are set in APA format. While you may change the names of the headings and subheadings, do not change the font or style of font. Hypothesis Test #1 Looking at Intrinsic Satisfaction by Gender Null and alternate hypotheses. Write out a Null & Alternate Hypothesis (alpha = .05). The test Use Excel to perform the test. Paste the results in the document. In a separate sentence, specifically identify the significance level (alpha), the test statistics and the critical value. State your decision State whether you are rejecting or failing to reject the null hypothesis statement. Explanation of decision made Comment on why you are making your decision in terms of how the test statistic compares to the critical value or in terms of how the p value compares to the alpha. Applications for managers Discuss how the manager of the company could use this information specifically. Why is this information valuable? Hypothesis Test #2 Looking at Extrinsic Satisfaction by Position Null and alternate hypotheses Write out a Null & Alternate Hypothesis (alpha = .05). The test Use Excel to perform the test. Paste the results in the document In a separate sentence, specifically identify the significance level (alpha), the test statistics and the critical value. State your decision State whether you are rejecting or failing to reject the null hypothesis statement. Explanation of decision made Comment on why you are making your decision in terms of how the test statistic compares to the critical value or in terms of how the p value compares to the alpha. Applications for managers
  • 23.
    Discuss how themanager of the company could use this information specifically. Why is this information valuable? Z and T Tests Explain the difference between the Z and T test and when each one is used. Samples and Populations Explain the difference between a sample and the population. Why are samples used for hypothesis tests? Be sure to be specific. Conclusion Add some concluding remarks in about 2-3 sentences. References NOTE: The reference list starts on a new page after your conclusion. For help with formatting citations and references using rules outlined in the APA Manual’s 6th Edition, please check out the AIU APA guide located under the Interactive Learning section on the left side of the course. Examples: American Psychological Association [APA]. (2010) Publication manual of the American Psychological association (6th ed.). Washington, DC: Author. Association of Legal Writing Directors (ALWD) (2005). ALWD citation manual: A professional system of citation (3rd ed.). New York: Aspen Publishers.