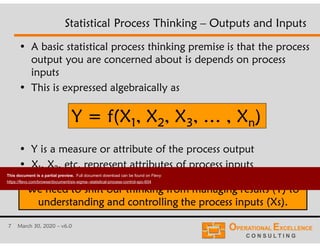
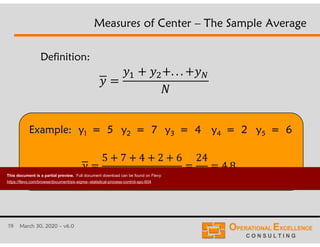
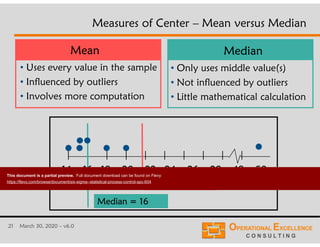
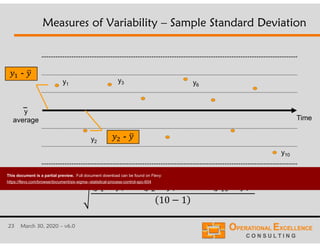
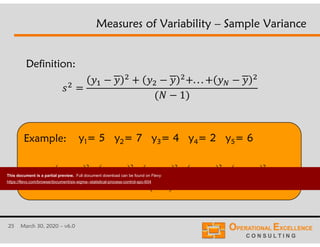
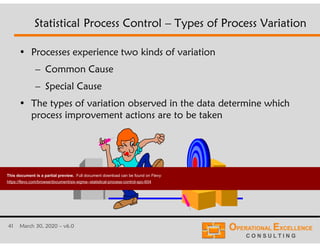
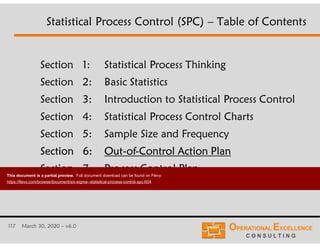
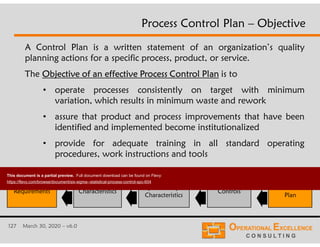
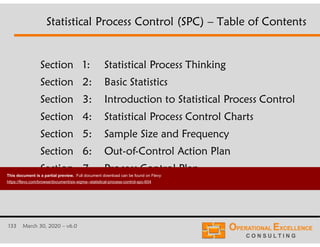
More Information:
https://flevy.com/browse/business-document/six-sigma--statistical-process-control-spc-604
DOCUMENT DESCRIPTION
The Six Sigma - Statistical Process Control (SPC) Training Module includes:
1. MS PowerPoint Presentation including 136 slides covering
- Introduction to Statistical Process Thinking,
- Basic Statistics,
- Introduction to Statistical Process Control,
- Statistical Process Control Charts,
- Sample Size & Frequency,
- Out-of-Control Action Plan, and
- Process Control Plan.
2. MS Excel Confidence Interval Analysis Calculator making it really easy to calculate confidence intervals (mean value, standard deviation, capability indices, proportion, count) and perform a Comparison of two statistics (mean values, standard deviations, proportions, counts).
"After you have downloaded the training material, you can change any part of the training material and remove all logos and references to Operational Excellence Consulting. You can share the material with your colleagues and clients, and re-use it as you need. The only restriction is that you cannot publicly re-distribute, sell, rent or license the material as though it is your own. Thank you."
Got a question about this presentation? Email us at support@flevy.com.
DMAIC is a methodology for improving existing processes. DMAIC stands for Define, Measure, Analyze, Improve, and Control.
https://goleansixsigma.com/lean-six-sigma-step-by-step/
Lean six sigma explained: Beginners trainingQualsys Ltd
A free online introduction to Lean six sigma principles.
Includes lean six sigma tools, philosophy, disciplines, history overview of lean six sigma, applying DMAIC for complex decision making, using Qualsys EQMS software for Lean Six Sigma.
Lean Six Sigma is a process improvement methodology that relies on a collaborative team effort to improve performance by systematically removing waste, combining Lean and Six Sigma to eliminate the eight kinds of waste
Lean Six Sigma projects comprise aspects of Lean's waste elimination and the Six Sigma focus on reducing defects
Six Sigma Process Capability Study (PCS) Training Module Frank-G. Adler
The Process Capability Study (PCS) Training Module v3.0 includes:
1. MS PowerPoint Presentation including 98 slides covering Introduction to Six Sigma, Creating and analyzing a Histogram, Basic Statistics & Product Capability, Statistical Process Control for Variable Data, Definitions of Process Capability Indices, Confidence Interval Analysis for Capability Indices, Capability Study for Non-Normal Distributed Processes, and several Exercises.
2. MS Excel Confidence Interval Analysis Calculator making it really easy to calculate Confidence Intervals for Capability Indices and other Statistics.
Lean, Six Sigma, ToC using DMAIC - Measure phase Simon Misiewicz
This presentation guides you through the DMAIC methodology that encompasses Lean, Six Sigma and ToC initiatives. The Measure phase guides you through the detailed process mapping of the SIPOC diagram to Swim Lanes, spaghetti diagrams that focus on time, cost and quality. The presentation guides you though the statistics element of data sampling and to understand the theory of constraints. The presentation also discusses the use of Pareto charts to identify the key issues within a process. – Optimise-GB (Creating Operational Efficiencies)
Problem solving road map to guide anybody who must improve a process that is slow, defective, inflexible, unresponsive, costly and risky.
Do you have any like that in your organization?
Of special use for teams following Lean Six Sigma methods (green belt and black belt projects).
Follows DMAIC structure integrated with Lean thinking and tools.
ASSOCIATED KEYWORDS:
Shewhart, Deming, Ohno, Ishikawa, lean, toyota, tps, toyota kata, lean six sigma, project management, six sigma, green belt, black belt, champion, coach, master black belt, deliverables, road map, project management, project plan, DMAIC, LSS, Define, Measure, Analyze, Improve, Control, Sustain, project charter, business case, team, problem solving, milestone, tollgate, baseline, process map, SIPOC, gemba, 7 wastes, 8 wastes, gemba walk, waste walk, spaghetti chart, flow chart, RACI, swimlane, VSM, value stream map, quick wins, operational definition, gage r&r, basic quality tools, check sheet, run chart, histogram, data statification, first time yield, FTY, rolled throughput yield, RTY, COPQ, hidden factory, rework, SPC, Western Electric rules, pareto, prioritization, input, process, output, box plot, scatter plot, correlation, causation, system, 5 whys, cause effect, fishbone, FMEA, hypothesis testing, root causes, quick win, drive out fear, respect for worker, kaizen, 5S, poka yoke, brainstorm, TRIZ, roles, responsibilities, PDCA, PDSA, pilot, roll out, implementation, status, implementation plan, business process management, BPM, KPI, target, performance, response plan, control plan, SOP, inverted pyramid, organization, sustain, plan, budget, communication, training, change, management, adoption, business, capability, prosperity, value, realization, results, replicate, integrate
I've been asked to put together a basic (and therefore relatively quick) introduction to Lean Six Sigma & DMAIC. While it’s not yet finished, I thought I would put it out there for people to comment on. Since the presentation is supposed to be training material there’s more text on the slides than I would prefer, but there are a few exercises and games to get the trainees involved.
I've put the PowerPoint version on my blog:
http://alesandrab.wordpress.com/2013/06/07/introduction-to-lean-six-sigma-dmaic/
Dear All, I have prepared this presentation to get a better understanding of Statistical Process Control (SPC). This is a very informative presentation and giving information about the History of SPC, the basics of SPC, the PDCA approach, the Benefits of SPC, application of 7-QC tools for problem-solving. You can follow this technique in your day to day business working to solve the problems. Thanking you.
Recorded webinar: http://bit.ly/1uVqMJC
Subscribe: http://www.ksmartin.com/subscribe
Purchase the book: http://www.bit.ly/VSM
These are slides from a webinar done with APICS Heartland on the topic of Value Stream Mapping.
This webinar covers:
• How to use value stream mapping as an organizational transformation & leadership alignment tool
• How to plan for a value stream mapping activity
• The mechanics of mapping, including key metrics
for office/service/knowledge work
• How to create an actionable Value Stream Transformation Plan
More Information:
https://flevy.com/browse/business-document/lean-manufacturing-160
BENEFITS OF DOCUMENT
Learn how to eliminate waste to save time and make more money.
Learn how to apply simple Lean methods and tools in the workplace to improve productivity and quality.
DOCUMENT DESCRIPTION
Lean is a management philosophy based on the Toyota Production System (TPS). With Lean Manufacturing, you will be able to enhance value for your customers by improving and smoothing the process flow and eliminating waste. Simply put, with Lean, you will be able to increase productivity and create greater customer value with less resources.
By teaching this presentation, managers and employees will have a better understanding of the Lean principles and approach to eliminating waste, and will be more forthcoming to lead and participate in the Lean implementation process.
LEARNING OBJECTIVES
1. Understand the key concepts and principles of Lean
2. Acquire knowledge on the common Lean methods and tools and their applications to eliminate waste and create more value for customers
3. Identify ways to develop "Kaizen eyes" to look for improvement opportunities
4. Describe the various Lean roles
5. Define the critical success factors for sustaining a Lean culture
CONTENTS
1. Introduction to Lean Thinking
- The case for Lean Manufacturing
- Where did Lean originate?
- Toyota's philosophy
- Lean adoption in various environments
- Impact of Lean principles in industry
- Lean applications in manufacturing, process and service industries
- What is Lean?
- What Lean is not
- Traditional thinking versus Lean thinking
- Traditional culture vs. Lean culture
- Lean management framework
- Lean and six sigma
- Benefits of Lean manufacturing
Got a question about this presentation? Email us at support@flevy.com.
More Information:
https://flevy.com/browse/business-document/lean-six-sigma--process-risk-analysis-fmea-600
BENEFITS OF DOCUMENT
the systematic analysis of a manufacturing, service or administrative process,
the identification of critical and/or significant process characteristics, and
the identification of process deficiencies and development of an effective corrective action plan.
DOCUMENT DESCRIPTION
The Lean Six Sigma - Process Risk Analysis & Mistake-Proofing Training Module provides you with a step-by-step approach, as well as examples, exercises, and templates, to analyze and eliminate risks in your manufacturing, service or business processes. This training module includes:
1. 132 PowerPoint slides covering
- Introduction to Process Risk Analysis & Mistake-Proofing,
- Process Variables Map,
- Cause & Effect Matrix,
- Process Failure Mode and Effects Analysis,
- Sixteen Human Error Modes,
- Six Mistake-Proofing Principles,
- Seven Types of Poka-Yoke Devices and Examples,
- Process Control Plan,
- and 6 Workshop Exercises.
2. MS Excel Process Variables Map Template & Example
3. MS Excel Cause & Effect Matrix Template & Example
4. MS Excel Process FMEA Template & Example
5. MS Excel Process Control Plan Template & Example
"After you have downloaded the training material, you can change any part of the training material and remove all logos and references to Operational Excellence Consulting. You can share the material with your colleagues and clients, and re-use it as you need. The only restriction is that you cannot publicly re-distribute, sell, rent or license the material as though it is your own. Thank you."
Got a question about this presentation? Email us at support@flevy.com.
Almost all companies work with constantly grown SKU’s and raw materials numbers, that leads to working with smaller and smaller batches, shorter and shorter lead times and higher and higher quality standards which brings high complexity in effective production flow management.
To manage and visualize Information Flow became necessary condition for effective production, business management or any kind of improvements – LEAN, TOC, Six Sigma or TLS.
Nova days key success factor in production and business environment is a correct Information Flow Management.
Almost all companies work with constantly grown SKU’s and raw materials numbers, that leads to working with smaller and smaller batches, shorter and shorter lead times and higher and higher quality standards which brings high complexity in effective production flow management.
To manage and visualize Information Flow became necessary condition for effective production, business management or any kind of improvements – LEAN, TOC, Six Sigma or TLS.
Descriptive statistics are methods of describing the characteristics of a data set. It includes calculating things such as the average of the data, its spread and the shape it produces.
Operations Management Topics WikiThis is Wiki Page. This means .docxcherishwinsland
Operations Management Topics Wiki
This is Wiki Page. This means anyone can edit it (CLICK ON THE EDIT BUTTON). For the D level of your first project, give a one line definition of 2 of the topics below and then document what you did in your learning log. Or you can add a new topic. Maybe you want to edit a definition?
Make sure to cite your sources.
Topics
(in no particular order... feel free to organize them if you think they should be organized)
Process Improvement: Process Improvement is the proactive task of identifying, analyzing and improving upon existing business processeswithin an organization for optimization and to meet new quotas or standards of quality. https://www.appian.com/bpm/process-improvement-organizational-development/
Customer Contact Model (Service Operations)
Process Re-engineering- Business process reengineering (BPR) is the analysis and redesign of workflows (Links to an external site.)Links to an external site. within and between enterprises in order to optimize end-to-end processes and automate non-value-added tasks. http://searchcio.techtarget.com/definition/business-process-reengineering (Links to an external site.)Links to an external site.
Process Analysis:Process analysis is a form of technical writing and expository writing "designed to convey to the reader how a change takes place through a series of stages. https://en.wikipedia.org/wiki/Process_analysis (Links to an external site.)Links to an external site.NOTE FROM MIKE: meh... this isn't the definition I'd use for this class.... although, I like the "change takes place through a series of stages" part.
Flowcharts: is a diagram of the sequence of movements that show the actions and process of a goal. https://www.smartdraw.com/flowchart/
Service Supply Networks: A supply network is a pattern of temporal (Links to an external site.)Links to an external site. and spatial processes carried out at facility nodes and over distribution links, which adds value for customers (Links to an external site.)Links to an external site. through the manufacturing and delivery of products (Links to an external site.)Links to an external site..
source: https://en.wikipedia.org/wiki/Supply_network
Process Charts: Graphical representation of the sequence of steps or tasks (workflow) constituting a process, from raw materials through to the finished product. It serves as a tool for examining the process in detail to identify areas of possible improvements.http://www.businessdictionary.com/definition/process-chart.html (Links to an external site.)Links to an external site.
Bench-marking: A measurement of the quality of an organization's policies, products, programs, strategies, etc., and their comparison with standard measurements, or similar measurements of its peers
Source: http://www.businessdictionary.com/definition/benchmarking.html (Links to an external site.)Links to an external site.
Product-Process Matrix
Total Quality Management: is a system of management ba.
Root Causes Analysis for Lean Maintenance Using Six Sigma Approachtheijes
The aim of the project is to reduce rejection level of needle roller bearing assembly using six sigma techniques. Six Sigma is a quality improvement tool for product. It reduces the defects, minimizes the variation and improves the capability of the manufacturing process. The main objective of Six Sigma is to increase the profit margin, improve financial condition through minimizing the defects rate of product. Further it increases the customer satisfaction, retention and produces the best class product from the best process performance. The needle roller bearing has more Lining Thickness Variation (LTV) defect and bearing Fits like loose fit and tight fit in the production line. The current rejection level of lining thickness variation defect is very high which leads to consumption of money in the form of rework and rejection of the job. The aim of the project is to identify the causes for various assembly defect and its remedies to reduce rejection level in needle roller bearing
This presentation on batch process analytics was given at Emerson Exchange, 2010. A overview of batch data analytics is presented and information provided on a field trail of on-line batch data analytics at the Lubrizol, Rouen, France plant.
Fortune 500 companies and other leading organizations frequently seek the expertise of global consulting firms, such as McKinsey, BCG, Bain, Deloitte, and Accenture, as well as specialized boutique firms. These firms are valued for their ability to dissect complex business scenarios, offering strategic recommendations that are informed by a vast repository of consulting frameworks, subject matter expertise, benchmark data, best practices, and rich insights gleaned from a history of diverse client engagements.
The case studies presented in this book are a distillation of such professional wisdom and experience. Each case study delves into the specific challenges and competitive situations faced by a variety of organizations across different industries. The analyses are crafted from the viewpoint of consulting teams as they navigate the unique set of questions, uncertainties, strengths, weaknesses, and dynamic conditions particular to each organization.
What you can gain from this whitepaper:
Real-World Challenges, Practical Strategies: Each case study presents real-world business challenges and the strategic maneuvers used to navigate them successfully.
Expert Perspectives: Crafted from the viewpoint of top-tier consultants, you get an insider's look into professional methodologies and decision-making processes.
Diverse Industry Insights: Whether it's finance, tech, retail, manufacturing, or healthcare, gain insights into a variety of sectors and understand how top firms tackle critical issues.
Enhance Your Strategic Acumen: This collection is designed to sharpen your strategic thinking, providing you with tools and frameworks used by the best in the business.
Whether you're at the helm of a corporation or on your path to becoming a consulting expert, "100 Case Studies on Strategy & Transformation" is your essential guide to navigating the complex world of business strategy.
More Information:
https://flevy.com/browse/marketplace/project-management-for-mba-in-french-5722
BENEFITS OF DOCUMENT
Project management adapted to the needs of participants in MBA programs
Course built on the basis of the project management process: Initiating - Planning - Executing - Controlling - Closing.
Course presenting in detail not only the Waterfall approach but also the Agile & Hybrid development approaches.
DOCUMENT DESCRIPTION
This course is a presentation of over 220 pages specially edited to cover the needs of participants in Master of Business Administration - MBA programs.
This course is based on the standard PMBOK edition 6 of the Project Management Institute, it also follows the project management methodology offered by Rita Mulcahy's PMP Exam Prep 10th Edition.
This course refers to case studies chosen among those existing in the book Project Management: A Systems Approach to Planning, Scheduling, and Controlling, Author: Harold Kerzner.
This course contains exercises as well as a practical case of an open space development project.
Below is the table of contents:
• Introduction to project management,
• Pre-Project,
• Project environment,
• Project Management Process,
• Initiating,
• Planning,
• Executing,
• Controlling,
• Closing.
• Introduction to Agility,
• Role of the Project Manager.
Got a question about this presentation? Email us at support@flevy.com.
More Information:
https://flevy.com/browse/flevypro/4-stages-of-disruption-5265
Organizations are constantly trying to innovate and, likewise, all industries will eventually be disrupted, as new products, businesses, and industries emerge.
No industry is safe from Disruption. In a 2017 PwC survey of 1,379 CEOs around the world, 60% said their market has already changed or completely reshaped in the past 5 years and over 75% anticipate they would by 2022.
This presentation discusses the 4 Stages of Disruption. Research has found Innovation that eventually leads to Disruption follows a 4-stage evolution:
1. Disruption of Incumbent
2. Rapid and Linear Evolution
3. Appealing Convergence
4. Complete Reimagination
Understanding this 4-stage model will help us understand what design choices to prioritize and when. At any given time, different products and organizations are likely to be at different stages relative to local “end point†of Innovation.
Additional topics discussed include Disruptive vs. Incumbent Dynamics, the Consumer Adoption Curve, Endgame Niche Strategies, among others.
This deck also includes slide templates for you to use in your own business presentations.
Got a question about the product? Email us at flevypro@flevy.com.
More Information:
https://flevy.com/browse/flevypro/customer-centric-culture-3831
The use of Internet and other online tools have turned consumers to be more empowered and are now shopping differently. Customers are becoming more demanding and accustomed to getting what they want. With greater access to reviews and online rating, customers are better equipped to switch to new products and services. Consumers now want to buy products and services when, where, and however they like. They expect companies to interact with them seamlessly, in an easy, integrated fashion with very little friction across channels.
As customer expectation continue to evolve – accelerated by the amplifying forces of interconnectivity and technology – markets are becoming increasingly fragmented with demand for greater product variety, more price points, and numerous purchasing and distribution channels.
Companies should be able to adapt to these increasingly disparate demands quickly and at scale. Staying close to the customer experience across an increasingly diverse customer base changing over time is no longer a matter of choice. It is a business imperative and a matter of corporate survival.
The Age of the Customer now calls for companies to be a customer-centric company. Successful ones have discovered that building a customer-centric company depends, first and foremost, on building a Customer-centric Culture.
This framework focuses on the building a Customer-centric Culture utilizing the Corporate Culture Framework. The Corporate Culture Framework is anchored on 4 Primary Cultural Attributes and 4 Secondary Cultural Attributes.
The 4 primary Cultural Attributes are critical in building a Customer-centric Culture.
1. Collective Focus
2. External Orientation
3. Change and Innovation
4. Shared Beliefs
Customer-centric organizations also project 4 secondary Cultural Attributes.
1. Risk and Governance
2. Courage
3. Commitment
4. Inclusion
Companies with a Customer-centric Culture can drive superior financial results and a rich source of competitive advantage.
This deck also includes slide templates for you to use in your own business presentations.
Got a question about the product? Email us at flevypro@flevy.com.
More Information:
https://flevy.com/browse/flevypro/business-transformation-success-factors-5561
Business Transformations have become a necessity in the fast-changing technological and competitive business environment. Transformation is characterized by significant and risk-laden restart of a company, with the objective of accomplishing a profound improvement in performance and changing its future course.
Undertaking such arduous effort requires approaching the task in a structured way. Research shows that quite a few of such undertakings are based on anecdotal beliefs instead of being based on empirical data.
This presentation provides a detailed overview of the 5 Factors Critical for achieving the desired results from Business Transformation, based on empirical evidence. These 5 factors are:
1. Cost Management
2. Revenue Growth
3. Long-term Strategy and R&D Investment
4. New, External Leadership
5. Holistic Transformation Programs
Other topics discussed in the presentation include the rationale for Business Transformation, its effects, phases, and the trends that trigger Business Transformation.
The slide deck also includes some slide templates for you to use in your own business presentations.
More Information:
https://flevy.com/browse/flevypro/employee-engagement-measurement-and-improvement-5321
Employee Engagement has emerged as one of the significant pillars on which the Competitive Advantage, Productivity, and Growth of an organization rests. Measuring Employee Engagement is vital in shaping Employee Engagement Strategies that help propel the organization towards growth.
This presentation provides a detailed overview of the Employee Engagement Scorecard, a framework that is quite effective in measuring the existing levels of Employee Engagement and devising strategies based on the individuals’ requirements. The Employee Engagement Scorecard encompasses 5 dimensions or guiding principles:
1. Enhance Employee Satisfaction
2. Promote Employee Identification
3. Enhance Employee Commitment
4. Ensure Employee Loyalty
5. Manage Employee Performance
The slide deck also includes some slide templates for you to use in your own business presentations.
More Information:
https://flevy.com/browse/flevypro/digital-transformation-workforce-digitization-3969
The approaching Age of Automation, together with the impending penetration of digital technology into the labor force, threatens to destabilize crucial aspects of how employees work by. It undermines the stability companies depend on to be agile.
Executives can re-solidify their companies even while making the most of the coming Transformation. There is just a need for executives to adjust their leadership behavior, embrace Digital Workforce Platforms, and deepen their engagement with digitally enabled workers.
This framework provides a good understanding of Workforce Digitization, the Workforce Platforms, and its 4 core benefits (listed below).
1. Collaboration
2. Retention
3. Succession Planning
4. Decision Making
The use of Workforce Platforms can provide companies greater chance to succeed in making markets for talented workers inside their organizations.
This deck also includes slide templates for you to use in your own business presentations.
More Information:
https://flevy.com/browse/flevypro/strategic-human-resources-5310
Today's information-based, knowledge intensive, and service-driven economy has forced organizations to make substantial changes to the way they do business. With talented Human Capital now becoming the key strategic resource, the locus of the battle front has shifted. Managers not only have to fight for product markets and technical expertise but also for the hearts and minds of the most talented people in the market.
This presentation discusses the 3 core processes that Human Resources (HR) must adopt to evolve into the strategic HR function that has become the new realm in this age of disruption:
1. Building
2. Linking
3. Bonding
Other topics discussed in the slide deck include the changing perspective and responsibility of top management amidst rapid Business and Digital Transformation; and the shifting role of HR from being an auxiliary function to that of a driver.
The slide deck also includes some slide templates for you to use in your own business presentations.
[Whitepaper] 8 Key Steps of Data Integration: Restructuring Redeployment Asse...Flevy.com Best Practices
More Information:
https://flevy.com/browse/flevypro/restructuring-redeployment-assessment-management-5439
More Information:
https://flevy.com/browse/flevypro/restructuring-redeployment-assessment-management-5439
Restructuring becomes essential at some stage in the lifecycle of any organization. In order to emerge triumphant through this tumultuous challenge, it is necessary that the focus remains on the challenges impeding the organization, Strategy Development to tackle the challenges, and prioritizing Strategic Initiatives to deliver radical results that lead the organization to Operational Excellence.
Redeployment is the most significant phase in the Restructuring process. Within Redeployment, the Assessment phase is critical as the revitalization of the whole organization is dependent on correct Assessments and right placement of employees based on those Assessments.
Proper Redeployment Assessment Management is of utmost importance in Restructuring, and it should follow a structured approach, which means managing 5 core areas:
Manage Assessment Team
Manage Anxiety Level of Candidates
Manage Amount of “Deviant Behavior” in the Assessments
Manage Level of Duplicity, Wild Guessing, and Other Forms of Distortion
Manage Amount of Feedback and Its Timing after the Event
Managing 5 core areas ensures smooth implementation of the Redeployment Assessment process, which is a major milestone of the Restructuring project.
The Redeployment Assessment process has to be detailed, accurate, and prompt. Due Diligence in documenting the process, verifying particulars, and balance between Rapidity and Accurateness is essential because:
Organizational requirement to concentrate on post-restructuring environment is intense.
Employees’ urge to swiftly find out about their future is deep-seated.
Objections by employee stakeholders, as a consequence of large-scale retrenchment is high.
Probability of legal recourse by employees is also distinct.
Future Employee Engagement is dependent on fair Assessment and correct placements.
More Information:
https://flevy.com/browse/flevypro/strategy-classics-value-disciplines-model-5138
According to Treacy and Wiersema, organizations need to make tough strategic choices in order to become market leaders. Market leaders choose to excel in delivering extraordinarily levels of one particular value to their customers. This way they can remain focused and become the absolute best in a certain value proposition.
Gaining market and Operational Excellence requires that the company's entire Operating Model be adapted in a way this it is aligned with the chosen Value Discipline. A Value Discipline is a unique value that organizations can deliver to a chosen market. The Value Discipline Principle is in line with Porter's Generic Strategies, where Michael Porter describes how companies gain Competitive Advantage by either focusing on low cost, differentiation, or a niche market.
This presentation discusses the Value Disciplines Model and the 3 Value Disciplines organizations must choose from.
1. Operational Excellence
2. Product Leadership
3. Customer Intimacy
If your company has not reached yet any of the Value Disciplines, don't wait longer.
[Whitepaper] The Definitive Guide to Strategic Planning: Here’s What You Need...Flevy.com Best Practices
More Information:
https://flevy.com/browse/flevypro/best-practices-in-strategic-planning-2738
For many organizations, this is the time of the year is when Leadership will conduct the annual Strategic Planning process and plan the near-, mid- and long-term strategies.
This article breaks the full Strategic Planning and Execution processes into 3 sections:
Strategic Planning
Strategy Development
Strategy Execution
For each section, we will highlight important concepts core to the topic, as well as direct you to important resources for further understanding.
1. Strategic Planning
Per Wikipedia, we can define Strategic Planning as:
Strategic Planning is an organization’s process of defining its strategy, or direction, and making decisions on allocating its resources to pursue this strategy. It may also extend to control mechanisms for guiding the implementation of the strategy. Strategic Planning became prominent in corporations during the 1960s and remains an important aspect of strategic management. It is executed by strategic planners or strategists, who involve many parties and research sources in their analysis of the organization and its relationship to the environment in which it competes.
Strategic Planning is a crucial process, but often poorly executed, leading to poor translation from Strategy to Execution.
In most organizations, executives complain that their Strategic Planning is overly bureaucratic, insufficiently insightful, and doesn’t accommodate today’s rapidly changing, digital markets. To combat these issues, there are a few best practices we should follow:
Explore Strategy across 3 time horizons.
Encourage productive and stimulating Strategic Dialogue.
Engage a broad, decentralized group of stakeholders.
Let’s dive a little deeper into each of these best practices.
Explore
The 3 time horizons we want to explore can be defined as short term (1-year timeframe), medium term (3–5 years timeframe), and long term (5+ years). Each horizon is uniquely considered and has different objectives.
[Whitepaper] The Definitive Introduction to Strategy Development and Strategy...Flevy.com Best Practices
More Information:
https://flevy.com/browse/flevypro/strategy-classics-porters-five-forces-4051
More Information:
https://flevy.com/browse/flevypro/strategy-classics-porters-five-forces-4051
[Whitepaper] The “Theory of Constraints:” What’s Limiting Your Organization?Flevy.com Best Practices
More Information:
https://flevy.com/browse/flevypro/theory-of-constraints-1883
The Theory of Constraints (TOC) is a methodology for identifying the most important limiting factor — i.e. constraint — and systematically improving it. It was developed by Dr. Eliyahu Goldratt, introduced in 1984 book, The Goal.
TOC differs from traditional management views, in that traditional methods seek to make improvements throughout the organization. They divide the organization into smaller, more manageable pieces. The objective, thus, is to maximize the performance of each part, resulting in global improvement.
On the other hand, TOC takes a more focused approach. Instead of improving everywhere, the TOC approach seeks only to improve the few variables (or constraints) that have the largest impact on the organization’s performance. By trying to improve everything everywhere, the risk is that nothing will be improved that really counts. TOC follows the adage “a chain is no stronger than its weakest link.” An interesting phenomenon about chains is that strengthening any link except the weakest one does not improve the strength of the whole chain. Strengthening the weakest link produces an immediate increase in the strength of the whole chain, but only up to the level of the next weakest link.
There are 3 types of constraints that exist in an organization:
Capacity Constraint. This constraint occurs when a resource which cannot provide timely capacity as demanded by the system.
Market Constraint. This is when the amount of customers orders is not sufficient to sustain the required growth of the system.
Time Constraint. This occurs when the response time of the system to the requirement of the market is too long to the extent that it jeopardizes the system’s ability to meet its current commitment to its customers as well as the ability of winning new business.
More Information:
https://flevy.com/browse/flevypro/supply-chain-cost-reduction-transportation-5482
Companies looking to improve efficiency and reduce costs can gain significant ground in the Supply Chain Management function by incorporating Lean Management and Six Sigma techniques.
Reason this area has gone under the radar is that companies do not consider Supply Chain to be their core competency.
Not only Warehousing but Transportation also has almost the same potential in terms of opportunities for Cost Reduction and Process Improvement. The approach to Transportation Costs Reduction, though, is different to that of Supply Chain Cost Reduction in Warehousing. This is in part due to the complexity in Transportation Costs, as the costs come from numerous widely distributed individual operations every year.
The approach to Supply Chain Cost Reduction in Transportation encompasses 2 phases:
Understand the Baseline
Identify and Implement Opportunities
[Whitepaper] A Great Leadership Experience: Dr. Rachid Yazami, Inventor of th...Flevy.com Best Practices
More Information:
https://flevy.com/browse/flevypro/leadership-competency-model-3661
Leadership has become a usual term often misunderstood by many people even those holding the status of a leader. There is no doubt that everyone can be a leader, but not everyone can be a genius leader. Leadership is far limited to prestige, a high status, or to financial abundance; it is neither about authority nor power. Leadership starts when you go beyond the self to serve and empower others.
This article is not for a purpose to redefine leadership with its different aspects, but it is simply about a great example of leadership that mirrors outstanding performance and remarkable human qualities. Dr. Rachid Yazami is an eminent scientist and best known for his research on lithium ion batteries. This technology is used by billions of people worldwide for their cell phones, cameras, tablets, laptops, power tools, and many other devices. Dr. Yazami started his career from scratch to build an empire based on the battery technology. My main interest is not to make a compilation of his achievements and honors, but to tap into his personality traits and characteristics; to discuss the main qualities that enabled him to succeed as a scientist, a researcher, and a leader of his field. My purpose is to understand also the sources of his inspirations and the secret behind his motivations and limitless resilience. His unique path is a textbook of insightful lessons that I aim to summarize and share with you based on a set of interviews with him.
[Whitepaper] Finding It Hard to Manage Conflict at the Workplace? Use the Tho...Flevy.com Best Practices
More Information:
https://flevy.com/browse/flevypro/thomas-kilmann-conflict-mode-instrument-tki-3722
A major reason for employees leaving their workplaces is conflict with their bosses. To succeed in today’s fiercely competitive market, organizations need to invest in developing their leadership, such that they further develop their teams by training them on the desired competencies and create a sense of engagement in them.
A big challenge for leaders is getting their employees to believe in the organizational vision. No two personalities have the same viewpoints and aspirations, thus conflict is bound to occur between team members while they interact.
The Thomas-Kilmann Conflict Mode Instrument (TKI), developed by Dr. Ralph H. Kilmann and Dr. Kenneth W. Thomas, is an easy-to-use, online assessment tool to Conflict Management. Human Resources (HR) and Organizational Design (OD) consultants utilize the TKI tool as a mechanism to initiate discussions on differing topics and facilitate in mediation by learning how conflict-handling modes affect personal, group, and organizational dynamics.
Each of us has a predominant conflict style that we use in a particular situation. The Thomas-Kilmann Conflict Mode Instrument provides a basis to measure a person’s behavior in conflict situations, where individuals appear to be unable to get along. The individuals’ behavior in conflict situations encompasses 2 broad dimensions:
Assertiveness
Cooperativeness
These behavior dimensions define 5 predominant conflict handling styles (or modes) that we use while responding to conflict situations:
Competing
Accommodating
Avoiding
Collaborating
Compromising
Got a question about this presentation? Email us at support@flevy.com.
[Whitepaper] Key Account Management: Handling Large Global Accounts the Right...Flevy.com Best Practices
More Information:
https://flevy.com/browse/flevypro/key-account-management-kam-large-global-accounts-3765
Large accounts make up a significant portion of business for most B2B companies. Therefore, losing an important customer can have detrimental effects on the organization. The significance of key accounts is urging top B2B companies to revisit their key account management approaches. Additionally, the increasing level of sophistication of the purchase process being adopted — such as, centralized procurement, competitive bidding and auctions, and laborious negotiations — by large buyers is a crucial element for B2B companies to consider to win large accounts.
Studies have shown that large buyers suggest price, product features, and reliability as the most important factors in their purchasing decisions, even more so than sales and service experience. However, detailed analysis of data into the actual purchasing decisions by buyers reveal that suppliers’ service and support capabilities mean a lot to large purchasers — in fact, almost as equal in importance as price. Large buyers often involve senior team members in procurement, which necessitates the need for inclusion of people possessing high-quality management and sales skills while serving key accounts.
With more intensifying sophistication of the procurement process at large businesses in future, the buyers will keep trying to cut costs and gain significant advantage while negotiating with procurement. The suppliers, in turn, can create a win-win situation by providing first-rate key account support and service.
Leading suppliers utilize the 4 drivers of growth to develop best-in-class key account management practices and increase their large contract win ratios. These drivers are actually the 4 imperatives that forerunners undertake to fuel their growth:
Quantified Value Proposition (QVP)
Value-based Selling
Coordinated Account Management
Negotiation Preparation
Got a question about this presentation? Email us at support@flevy.com.
[Whitepaper] Nudge Theory: An Effective Way to Transform Negative BehaviorsFlevy.com Best Practices
More Information:
https://flevy.com/browse/flevypro/nudge-theory-key-challenges-3895
Changing the behaviors of people is the foremost issue with every transformation initiative.
Nudge theory is a novel Change Management model that underscores the importance of understanding the way people think, act, and decide. The model assists in encouraging human imagination and decision making, and transforming negative behaviors and influences on people. The approach helps understand and change human behavior, by analyzing, improving, designing, and offering free choices for people, so that their decisions are more likely to produce helpful outcomes for the others and society in general.
Nudge theory helps reform existing (often extremely unhealthy) choices and influences on people. The theory is quite effective in curtailing resistance and conflict resulting from using autocratic ways to change human behavior. The model promotes indirect encouragement and enablement — by designing choices which encourage positive helpful decisions — and avoids direct enforcement. For instance, playing a ‘room-tidying’ game with a child rather than instructing her/him to tidy the room; improving the availability and visibility of litter bins rather than erecting signs with a warning of fines.
Organizations are increasingly using behavioral economics to optimize their employee and client behavior and well-being. Nudge units or behavioral science teams are being set up in the public and corporate sectors to influence people to address pressing issues. For instance, to increase customer retention by changing the language of support center staff to motivate customers to consider long-term benefits of a product; or to make employees to follow safety procedures by placing posters of watching eyes to remind them of the criticality of the measure.
An effective Nudge initiative necessitates much more than deploying a few experts in heuristics and statistics. The senior leadership should lay out a conducive environment for successful behavioral transformation. This entails assisting the Nudge unit to focus, place it appropriately, create awareness, train and de-bias people, implement effective rewards, and follow high ethical standards.
The leadership needs to think about and prepare to tackle 6 key challenges Nudge units face when implementing effective behavioral transformation initiatives:
What should be the focus of the Nudge unit?
Should the Nudge unit be placed at the headquarters or at the business unit level?
Which resources be made part of the Nudge unit?
What are the critical success factors to consider for the unit?
How to communicate the results and early wins?
What should be done to tackle skepticism and resistance to change?
Got a question about this presentation? Email us at support@flevy.com.
[Whitepaper] Business Model Innovation: Creation of Scalable Business Models ...Flevy.com Best Practices
More Information:
https://flevy.com/browse/flevypro/business-model-innovation-bmi-scalable-business-models-5182
Scalability is described as possible meaningful changes in magnitude or capacity. In business terms, it’s the capability of a system to enhance productivity upon resource augmentation. Scalability provides an organization the capabilities to develop compelling value propositions — that are hard to imitate by the rivals — and achieve profitable growth even in the wake of external threats, cut-throat competition, stringent laws, or financial downturns.
Today’s challenging business ecosystems and economic outlook demand from the enterprises to develop novel and Scalable Business Models that are able to leverage positive returns on investments. To accomplish this, leaders need to identify and eradicate any capacity issues, enhance collaboration with existing partners, build new partnerships, or develop platforms to work with their opponents.
Executives should invest in scaling options only when they are sure to boost returns. They have to be quick to exit a business when returns on investment to scale backfire.
5 Patterns of Business Model Scalability
Benchmarking a number of successful organizations reveals that their Business Models were flexible enough to sustain internal and external pressures. Business Model Scalability hinges on aligning the strategic partners and Value Propositions to serve the customers.
To drive Business Model Innovation (BMI), leading organizations consistently display 5 critical patterns of Business Model Scalability:
Operate with multiple distribution channels
Eliminate typical capacity limitations
Outsource capital investments to partners
Allow customers and partners assume multiple roles in the business
Create platform models
Got a question about this presentation? Email us at support@flevy.com.
[Whitepaper] Shareholder Value Traps: How to Evade Them and Focus on Value Cr...Flevy.com Best Practices
More Information:
https://flevy.com/browse/flevypro/shareholder-value-traps-5239
Changing industry ecosystems and competition today demand from the organizations to undergo strategic shifts. The purpose of a company is undergoing Business Transformation from serving the interest of shareholders to serving all stakeholders that influence the organization.
Shareholders are often considered the only stakeholders that invest in a business. Senior management needs to be cognizant of the importance of shareholders as well other stakeholders who create value for the organization. They should work on building a collaborative Organizational Culture and paying heed to the welfare of all those groups that play a role in organizational growth.
This warrants a thorough evaluation of all stakeholders, their long-term interests, and Value Creation — or Value Destruction — potential for the organization. But first, this calls for finding answers to the following key questions:
Who creates the most value for the organization?
Who among the stakeholders typically secure the best deals from the organization?
Who is the victim of having the worst deals from the organization?
Who among the stakeholders is potentially untrustworthy?
Are there any intermediaries or stakeholders fulfilling their personal agendas?
Answering these questions is critical for the executives, otherwise they may risk falling into Shareholder Value Traps. Recognizing and understanding stakeholder value traps while the managing stakeholders’ various interests helps executives achieve shared and individual long-term goals. These 5 common traps prevent stakeholders’ interests to get integrated with the interests of the organization and destroy the value of a company if overlooked:
Ignoring cash-flow driving stakeholders while distributing cash
Miscalculating reaction from stakeholders
Supporting under-performing units
Conceding to willful vulture capitalists
Misjudging intermediaries role in transactions
Got a question about this presentation? Email us at support@flevy.com.
Business Valuation Principles for EntrepreneursBen Wann
This insightful presentation is designed to equip entrepreneurs with the essential knowledge and tools needed to accurately value their businesses. Understanding business valuation is crucial for making informed decisions, whether you're seeking investment, planning to sell, or simply want to gauge your company's worth.
Personal Brand Statement:
As an Army veteran dedicated to lifelong learning, I bring a disciplined, strategic mindset to my pursuits. I am constantly expanding my knowledge to innovate and lead effectively. My journey is driven by a commitment to excellence, and to make a meaningful impact in the world.
Kseniya Leshchenko: Shared development support service model as the way to ma...Lviv Startup Club
Kseniya Leshchenko: Shared development support service model as the way to make small projects with small budgets profitable for the company (UA)
Kyiv PMDay 2024 Summer
Website – www.pmday.org
Youtube – https://www.youtube.com/startuplviv
FB – https://www.facebook.com/pmdayconference
Unveiling the Secrets How Does Generative AI Work.pdfSam H
At its core, generative artificial intelligence relies on the concept of generative models, which serve as engines that churn out entirely new data resembling their training data. It is like a sculptor who has studied so many forms found in nature and then uses this knowledge to create sculptures from his imagination that have never been seen before anywhere else. If taken to cyberspace, gans work almost the same way.
Implicitly or explicitly all competing businesses employ a strategy to select a mix
of marketing resources. Formulating such competitive strategies fundamentally
involves recognizing relationships between elements of the marketing mix (e.g.,
price and product quality), as well as assessing competitive and market conditions
(i.e., industry structure in the language of economics).
Affordable Stationery Printing Services in Jaipur | Navpack n PrintNavpack & Print
Looking for professional printing services in Jaipur? Navpack n Print offers high-quality and affordable stationery printing for all your business needs. Stand out with custom stationery designs and fast turnaround times. Contact us today for a quote!
Tata Group Dials Taiwan for Its Chipmaking Ambition in Gujarat’s DholeraAvirahi City Dholera
The Tata Group, a titan of Indian industry, is making waves with its advanced talks with Taiwanese chipmakers Powerchip Semiconductor Manufacturing Corporation (PSMC) and UMC Group. The goal? Establishing a cutting-edge semiconductor fabrication unit (fab) in Dholera, Gujarat. This isn’t just any project; it’s a potential game changer for India’s chipmaking aspirations and a boon for investors seeking promising residential projects in dholera sir.
Visit : https://www.avirahi.com/blog/tata-group-dials-taiwan-for-its-chipmaking-ambition-in-gujarats-dholera/
Premium MEAN Stack Development Solutions for Modern BusinessesSynapseIndia
Stay ahead of the curve with our premium MEAN Stack Development Solutions. Our expert developers utilize MongoDB, Express.js, AngularJS, and Node.js to create modern and responsive web applications. Trust us for cutting-edge solutions that drive your business growth and success.
Know more: https://www.synapseindia.com/technology/mean-stack-development-company.html
Buy Verified PayPal Account | Buy Google 5 Star Reviewsusawebmarket
Buy Verified PayPal Account
Looking to buy verified PayPal accounts? Discover 7 expert tips for safely purchasing a verified PayPal account in 2024. Ensure security and reliability for your transactions.
PayPal Services Features-
🟢 Email Access
🟢 Bank Added
🟢 Card Verified
🟢 Full SSN Provided
🟢 Phone Number Access
🟢 Driving License Copy
🟢 Fasted Delivery
Client Satisfaction is Our First priority. Our services is very appropriate to buy. We assume that the first-rate way to purchase our offerings is to order on the website. If you have any worry in our cooperation usually You can order us on Skype or Telegram.
24/7 Hours Reply/Please Contact
usawebmarketEmail: support@usawebmarket.com
Skype: usawebmarket
Telegram: @usawebmarket
WhatsApp: +1(218) 203-5951
USA WEB MARKET is the Best Verified PayPal, Payoneer, Cash App, Skrill, Neteller, Stripe Account and SEO, SMM Service provider.100%Satisfection granted.100% replacement Granted.
Discover the innovative and creative projects that highlight my journey throu...dylandmeas
Discover the innovative and creative projects that highlight my journey through Full Sail University. Below, you’ll find a collection of my work showcasing my skills and expertise in digital marketing, event planning, and media production.
Putting the SPARK into Virtual Training.pptxCynthia Clay
This 60-minute webinar, sponsored by Adobe, was delivered for the Training Mag Network. It explored the five elements of SPARK: Storytelling, Purpose, Action, Relationships, and Kudos. Knowing how to tell a well-structured story is key to building long-term memory. Stating a clear purpose that doesn't take away from the discovery learning process is critical. Ensuring that people move from theory to practical application is imperative. Creating strong social learning is the key to commitment and engagement. Validating and affirming participants' comments is the way to create a positive learning environment.
RMD24 | Retail media: hoe zet je dit in als je geen AH of Unilever bent? Heid...BBPMedia1
Grote partijen zijn al een tijdje onderweg met retail media. Ondertussen worden in dit domein ook de kansen zichtbaar voor andere spelers in de markt. Maar met die kansen ontstaan ook vragen: Zelf retail media worden of erop adverteren? In welke fase van de funnel past het en hoe integreer je het in een mediaplan? Wat is nu precies het verschil met marketplaces en Programmatic ads? In dit half uur beslechten we de dilemma's en krijg je antwoorden op wanneer het voor jou tijd is om de volgende stap te zetten.
Enterprise Excellence is Inclusive Excellence.pdfKaiNexus
Enterprise excellence and inclusive excellence are closely linked, and real-world challenges have shown that both are essential to the success of any organization. To achieve enterprise excellence, organizations must focus on improving their operations and processes while creating an inclusive environment that engages everyone. In this interactive session, the facilitator will highlight commonly established business practices and how they limit our ability to engage everyone every day. More importantly, though, participants will likely gain increased awareness of what we can do differently to maximize enterprise excellence through deliberate inclusion.
What is Enterprise Excellence?
Enterprise Excellence is a holistic approach that's aimed at achieving world-class performance across all aspects of the organization.
What might I learn?
A way to engage all in creating Inclusive Excellence. Lessons from the US military and their parallels to the story of Harry Potter. How belt systems and CI teams can destroy inclusive practices. How leadership language invites people to the party. There are three things leaders can do to engage everyone every day: maximizing psychological safety to create environments where folks learn, contribute, and challenge the status quo.
Who might benefit? Anyone and everyone leading folks from the shop floor to top floor.
Dr. William Harvey is a seasoned Operations Leader with extensive experience in chemical processing, manufacturing, and operations management. At Michelman, he currently oversees multiple sites, leading teams in strategic planning and coaching/practicing continuous improvement. William is set to start his eighth year of teaching at the University of Cincinnati where he teaches marketing, finance, and management. William holds various certifications in change management, quality, leadership, operational excellence, team building, and DiSC, among others.
What are the main advantages of using HR recruiter services.pdfHumanResourceDimensi1
HR recruiter services offer top talents to companies according to their specific needs. They handle all recruitment tasks from job posting to onboarding and help companies concentrate on their business growth. With their expertise and years of experience, they streamline the hiring process and save time and resources for the company.
What are the main advantages of using HR recruiter services.pdf
Six Sigma - Statistical Process Control (SPC)
1. 1 March 30, 2020 – v6.0
Six Sigma Statistical Process Control
by Operational Excellence Consulting LLC
2. 3 March 30, 2020 – v6.0
Section 1: Statistical Process Thinking
Section 2: Basic Statistics
Section 3: Introduction to Statistical Process Control
Section 4: Statistical Process Control Charts
Section 5: Sample Size and Frequency
Section 6: Out-of-Control Action Plan
Section 7: Process Control Plan
Statistical Process Control (SPC) – Table of Contents
This document is a partial preview. Full document download can be found on Flevy:
https://flevy.com/browse/document/six-sigma--statistical-process-control-spc-604
3. 5 March 30, 2020 – v6.0
GO - Test
NO-GO - Test
The first time that one presented machine produced parts was 1851 at the
industry exhibition in the Crystal Palace in London. An American gun
smith took 10 working guns, took them apart, mixed all the parts in a box
and re-assembled them again. This was found a quite surprising
“experiment”.
Statistical Process Thinking – A little bit of History
This document is a partial preview. Full document download can be found on Flevy:
https://flevy.com/browse/document/six-sigma--statistical-process-control-spc-604
4. 7 March 30, 2020 – v6.0
Statistical Process Thinking – Outputs and Inputs
• A basic statistical process thinking premise is that the process
output you are concerned about is depends on process
inputs
• This is expressed algebraically as
• Y is a measure or attribute of the process output
• X1, X2, etc. represent attributes of process inputs
We need to shift our thinking from managing results (Y) to
understanding and controlling the process inputs (Xs).
Y = f(X1, X2, X3, … , Xn)
This document is a partial preview. Full document download can be found on Flevy:
https://flevy.com/browse/document/six-sigma--statistical-process-control-spc-604
5. 9 March 30, 2020 – v6.0
• The traditional process control concept does not help us
to produce or deliver only good products or services.
• Every process outcome, product or service, has to be
inspected.
• Products have to be repaired or even scraped.
• Rendered services result in customer dissatisfaction.
• With respect to productivity and efficiency every activity
after the actual process is a non-value adding activity.
The Traditional Process Control Concept
This document is a partial preview. Full document download can be found on Flevy:
https://flevy.com/browse/document/six-sigma--statistical-process-control-spc-604
6. 11 March 30, 2020 – v6.0
• The advanced process control concept monitors one or
several critical process and product characteristics (Ys).
• The objective is to identify outliers, trends and shifts in
those characteristics, even prior to this causing defects in
the process outcome.
• The advanced process control concept enables
organizations to reduce inspection activities, rework and
scrap.
• The advanced process control concept enables
organizations to identify critical process inputs (Xs) that
impact critical process and product characteristics (Ys).
The Advanced Process Control Concept
This document is a partial preview. Full document download can be found on Flevy:
https://flevy.com/browse/document/six-sigma--statistical-process-control-spc-604
7. 13 March 30, 2020 – v6.0
A defect is any variation of a required characteristic (Y) of the
product or service, which is far enough removed from its
target value to prevent the product or service from fulfilling
the physical and functional requirements of the customer.
Statistical Process Thinking – Defect Definition
This document is a partial preview. Full document download can be found on Flevy:
https://flevy.com/browse/document/six-sigma--statistical-process-control-spc-604
8. 15 March 30, 2020 – v6.0
Remarks or Questions ?!?Remarks or Questions ?!?
This document is a partial preview. Full document download can be found on Flevy:
https://flevy.com/browse/document/six-sigma--statistical-process-control-spc-604
9. 17 March 30, 2020 – v6.0
Basic Statistics – Overview
• Types of data
• Measures of the Center of a Data Sample
– Mean
– Median
• Measures of the Spread of a Data Sample
– Range
– Variance (s2)
– Standard Deviation (s)
• Properties of a Normal Distribution
• Binomial and Poisson Distribution
This document is a partial preview. Full document download can be found on Flevy:
https://flevy.com/browse/document/six-sigma--statistical-process-control-spc-604
10. 19 March 30, 2020 – v6.0
Example: y1 = 5 y2 = 7 y3 = 4 y4 = 2 y5 = 6
Measures of Center – The Sample Average
Definition:
. . .
5 7 4 2 6
5
24
5
4.8
This document is a partial preview. Full document download can be found on Flevy:
https://flevy.com/browse/document/six-sigma--statistical-process-control-spc-604
11. 21 March 30, 2020 – v6.0
Measures of Center – Mean versus Median
MedianMean
• Uses every value in the sample
• Influenced by outliers
• Involves more computation
• Only uses middle value(s)
• Not influenced by outliers
• Little mathematical calculation
14 16 18 20 22 24 26 28 48 50
| | | | | | | | | |
Median = 16
Mean = 21.14
This document is a partial preview. Full document download can be found on Flevy:
https://flevy.com/browse/document/six-sigma--statistical-process-control-spc-604
12. 23 March 30, 2020 – v6.0
y3
y
average
_
y2
y1
y10
Measures of Variability – Sample Standard Deviation
Time
y6
-
-
…
10 1
This document is a partial preview. Full document download can be found on Flevy:
https://flevy.com/browse/document/six-sigma--statistical-process-control-spc-604
13. 25 March 30, 2020 – v6.0
Example:
Measures of Variability – Sample Variance
. . .
1
7.3
)15(
8.468.428.448.478.45
22222
2
s
Definition:
y1= 5 y2= 7 y3= 4 y4= 2 y5= 6
This document is a partial preview. Full document download can be found on Flevy:
https://flevy.com/browse/document/six-sigma--statistical-process-control-spc-604
14. 27 March 30, 2020 – v6.0
Basic Statistics – How to create a Histogram
A histogram provides graphical presentation and a first estimation about
the location or center, spread and shape of the outcome or results of
the process.
This document is a partial preview. Full document download can be found on Flevy:
https://flevy.com/browse/document/six-sigma--statistical-process-control-spc-604
15. 29 March 30, 2020 – v6.0
Step 2: Determine the number of bars to be used to create the histogram
of the data points. Calculate the width of one bar by dividing the range
of your data by the number of bars selected.
Basic Statistics – How to create a Histogram?
Number of Bars:
less than 50
50 - 100
100 - 250
over 250
5 or 7
5, 7, 9 or 11
7 - 15
11 - 19
Number of Data Points:
Minimum = 2.1
Maximum = 3.1
Range = 1.0
Bar Width = 0.2 (5 Bars)
This document is a partial preview. Full document download can be found on Flevy:
https://flevy.com/browse/document/six-sigma--statistical-process-control-spc-604
16. 31 March 30, 2020 – v6.0
Step 4: Draw the histogram indicating by the height of each bar the
number of data points that fall between the “start” and “end” point of
that bar.
Basic Statistics – How to create a Histogram?
Sorted Measurements
Part Hole Size Bar
5 2.1 1
2 2.3 2
7 2.4 2
6 2.5 3
8 2.5 3
1 2.6 3
10 2.6 3
4 2.7 4
9 2.8 4
3 3.1 5
0
1
2
3
4
5
NumberofDataPoints
2.1 2.3 2.5 2.7 2.9 3.1
This document is a partial preview. Full document download can be found on Flevy:
https://flevy.com/browse/document/six-sigma--statistical-process-control-spc-604
17. 33 March 30, 2020 – v6.0
Basic Statistics – The Normal Distribution
average average
+1*s
average
-1*s
average
+2*s
average
-2*s
average
-3*s
average
+3*s
34.13 %34.13 %
13.60 % 13.60 %
2.14 %2.14 %
0.13 % 0.13 %
If your process Y creates a histogram with the shape of a normal distribution, about 99.74% of
your data points will fall between the average ± 3s limits.
This document is a partial preview. Full document download can be found on Flevy:
https://flevy.com/browse/document/six-sigma--statistical-process-control-spc-604
18. 35 March 30, 2020 – v6.0
Basic Statistics – Test for Normal Distribution
The Normality Test from Anderson & Darling provides a method to determine if
your data comes from a process that creates normally distributed data.
The red line represents
the normal distribution.
If the all the individual data
points fall on the red line, the
sample data itself is perfectly
normally distributed.
As long as the p-value stays above
0.05, we can assume that the process
creates normally distributed data.This document is a partial preview. Full document download can be found on Flevy:
https://flevy.com/browse/document/six-sigma--statistical-process-control-spc-604
19. 37 March 30, 2020 – v6.0
Section 1: Statistical Process Thinking
Section 2: Basic Statistics
Section 3: Introduction to Statistical Process Control
Section 4: Statistical Process Control Charts
Section 5: Sample Size and Frequency
Section 6: Out-of-Control Action Plan
Section 7: Process Control Plan
Statistical Process Control (SPC) – Table of Contents
This document is a partial preview. Full document download can be found on Flevy:
https://flevy.com/browse/document/six-sigma--statistical-process-control-spc-604
20. 39 March 30, 2020 – v6.0
Statistical Process Control – Definition
What is happening? What happened?
This document is a partial preview. Full document download can be found on Flevy:
https://flevy.com/browse/document/six-sigma--statistical-process-control-spc-604
21. 41 March 30, 2020 – v6.0
Statistical Process Control – Types of Process Variation
• Processes experience two kinds of variation
– Common Cause
– Special Cause
• The types of variation observed in the data determine which
process improvement actions are to be taken
This document is a partial preview. Full document download can be found on Flevy:
https://flevy.com/browse/document/six-sigma--statistical-process-control-spc-604
22. 43 March 30, 2020 – v6.0
Statistical Process Control – Special Causes
• Special causes, also known as assignable causes, often originate outside
the process and affect the regular, repeatable, and natural variation of
the process
• Special cause variation is not normally present in the process, but is an
irregular shock or upset to an X or a conversion activity
• Special causes create a change (e.g. outliers, trends, and shifts) in the
process and make it difficult to identify and analyze common causes
• A process that is regularly affected by Special cause variation can not
be considered stable
• It is ineffective to try to reduce Common cause variation or change the
process average until the process is stable
• While all processes have Common causes, not every process is affected
by Special causes
This document is a partial preview. Full document download can be found on Flevy:
https://flevy.com/browse/document/six-sigma--statistical-process-control-spc-604
23. 45 March 30, 2020 – v6.0
Statistical Process Control – Control Charts
• Control charts are a useful tool to verify whether a process is in
control
• While a stable process is desirable, it is not a guarantee of
meeting specifications
• A process can be in statistical control and still produce out of
specification results
• The goal is for a process to be both stable and capable of
meeting customer requirements
DR. WALTER A. SHEWHART (1891–1967)
This document is a partial preview. Full document download can be found on Flevy:
https://flevy.com/browse/document/six-sigma--statistical-process-control-spc-604
24. 47 March 30, 2020 – v6.0
The first use of control charts is to diagnose a process
• Many times the first step in improving a process is to study
and understand the current process
• The data for diagnostic control charting is collected, sometimes
off-line, by a process manager, engineer or improvement team
• The initial data collection often raises questions that require
additional data to identify sources of variation
• Many processes, especially new or modified ones, will have
special causes to resolve before we can start monitoring with
control charts
• 20 – 25 data points is normally a good starting point
Statistical Process Control – Purpose of Control Charts
This document is a partial preview. Full document download can be found on Flevy:
https://flevy.com/browse/document/six-sigma--statistical-process-control-spc-604
25. 49 March 30, 2020 – v6.0
• Work to get very timely data
• Immediately search for the root cause when control chart gives
a “signal”
• Do not make fundamental changes in the process
• Seek ways to change some higher level or upstream process to
prevent that special cause from recurring
• Also consider whether a special cause could be originating
from within the process itself
• The Process FMEA can be a powerful tool to understand and
resolve the special cause as a failure mode
Statistical Process Control – Improving Special Causes
This document is a partial preview. Full document download can be found on Flevy:
https://flevy.com/browse/document/six-sigma--statistical-process-control-spc-604
26. 51 March 30, 2020 – v6.0
1 s
2 s
3 s
1 s
2 s
3 s
%
of data points
UCL
LCL
Theitemweare
measuring
Statistical Process Control – Out-of-Control Rules
TIME
99-99.9%
90-98%
60-75%
Empirical
Rule:
Why 3s
is used.
This document is a partial preview. Full document download can be found on Flevy:
https://flevy.com/browse/document/six-sigma--statistical-process-control-spc-604
27. 53 March 30, 2020 – v6.0
Statistical Process Control – Control Chart Rules
Below is a list of the most commonly used out-of-control criteria included
in Minitab and as initially defined by Walter Shewhart in the 1920s.
Criteria 1: Outlier
Criteria 2 & 5 & 6: Process Shift
Criteria 3: Process Trend
This document is a partial preview. Full document download can be found on Flevy:
https://flevy.com/browse/document/six-sigma--statistical-process-control-spc-604
28. 55 March 30, 2020 – v6.0
Section 1: Statistical Process Thinking
Section 2: Basic Statistics
Section 3: Introduction to Statistical Process Control
Section 4: Statistical Process Control Charts
Section 5: Sample Size and Frequency
Section 6: Out-of-Control Action Plan
Section 7: Process Control Plan
Statistical Process Control (SPC) – Table of Contents
This document is a partial preview. Full document download can be found on Flevy:
https://flevy.com/browse/document/six-sigma--statistical-process-control-spc-604
29. 57 March 30, 2020 – v6.0
Process Control Charts – Types of Control Charts
Discrete – Attribute Data
(Count or Yes/No Data)
Variable – Continuous Data
(Measurements)
Subgroup
size
of > 10
Subgroup
size
of 1
Subgroup
size
of <= 10
I / MR
- Chart
x-bar / R
- Chart
x-bar / s
- Chart
Count
Incidences or
nonconformities
Fixed
oppor-
tunity
Variable
oppor-
tunity
c
- Chart
u
- Chart
Yes/No Data
Defectives or
nonconforming units
Fixed
subgroup
size
Variable
subgroup
size
np
- Chart
p
- Chart
Type of Data
This document is a partial preview. Full document download can be found on Flevy:
https://flevy.com/browse/document/six-sigma--statistical-process-control-spc-604
30. 59 March 30, 2020 – v6.0
• The I-MR (or Individuals – Moving Range) chart is a method of
looking at variation in a variable data or measurement.
• One source is the variation in the individual data points over time
(Individuals chart). This represents “long term” variation in the
process Y.
• The second source of variation is the variation between successive Y
data points (Moving Range chart). This represents “short term”
variation.
• I-MR charts should be used when there is only one data point to
represent a situation at a given time.
• To use the I-MR chart, the individual sample results should be
“sufficient” normally distributed. If not, the I-MR chart will give
more false signals, i.e. special causes.
Process Control Charts – The I-MR Chart
This document is a partial preview. Full document download can be found on Flevy:
https://flevy.com/browse/document/six-sigma--statistical-process-control-spc-604
31. 61 March 30, 2020 – v6.0
Process Control Charts – I-MR Chart Example
Minitab: Stat > Control Charts > Variable Charts for Individuals > I-MR
This is a list of the most commonly used
out-of-control criteria included in Minitab
and as initially defined by Walter Shewhart
in the 1920s.
This document is a partial preview. Full document download can be found on Flevy:
https://flevy.com/browse/document/six-sigma--statistical-process-control-spc-604
32. 63 March 30, 2020 – v6.0
Process Control Charts – I-MR Chart Example
Special Cause: 4 out of 5 points > 1 standard
deviation from center line (same side)
This document is a partial preview. Full document download can be found on Flevy:
https://flevy.com/browse/document/six-sigma--statistical-process-control-spc-604
33. 65 March 30, 2020 – v6.0
Long-term standard deviation:
Short-term standard deviation:
If the process is stable and in statistical control, then sLT = sST. However, if
the process is not stable then sLT > sST .
The difference between sLT and sST gives an indication of how much better
one can do with respect to process variation when using appropriate
process control, like Statistical Process Control (SPC).
Process Control Charts – Difference between sLT and sST
!
" . . .
1
1.128$ ) 1.128⁄
. . .
1
This document is a partial preview. Full document download can be found on Flevy:
https://flevy.com/browse/document/six-sigma--statistical-process-control-spc-604
34. 67 March 30, 2020 – v6.0
Process Control Charts – I-MR Chart Example
1. The process performance data indicates one
special cause in process. However, the special cause
show also in the MR chart, increasing the average
MR and therefore the short-term standard deviation
used to calculate the control limits for the I chart.
2. Special causes that show also in the MR chart
need to be excluded from the data to ensure that
all special causes in the I-chart can be identified.
This document is a partial preview. Full document download can be found on Flevy:
https://flevy.com/browse/document/six-sigma--statistical-process-control-spc-604
35. 69 March 30, 2020 – v6.0
Process Control Charts – Control Chart Rule #1
All SPC Out-of-Control Criteria have
about a 1 in 1,000 chance to occur in
a process without a special cause.
Therefore, they are strong evidence
for the presence of a special cause.
This document is a partial preview. Full document download can be found on Flevy:
https://flevy.com/browse/document/six-sigma--statistical-process-control-spc-604
36. 71 March 30, 2020 – v6.0
Process Control Charts – Control Chart Rule #3
6 consecutive points increasing or
decreasing often indicates a trend in
process performance due to a special
cause.
This document is a partial preview. Full document download can be found on Flevy:
https://flevy.com/browse/document/six-sigma--statistical-process-control-spc-604
37. 73 March 30, 2020 – v6.0
Process Control Charts – Control Chart Rule #6
4 of 5 consecutive points above or below the
2 standard deviation line often indicates a
shift in process performance.
This document is a partial preview. Full document download can be found on Flevy:
https://flevy.com/browse/document/six-sigma--statistical-process-control-spc-604
38. 75 March 30, 2020 – v6.0
Process Control Charts – Control Chart with Stages
The control chart indicates a shift in the Y
between the 15th and 16th data sample. This
could be caused by a change in the method,
operators, raw material batch, … .
This document is a partial preview. Full document download can be found on Flevy:
https://flevy.com/browse/document/six-sigma--statistical-process-control-spc-604
39. 77 March 30, 2020 – v6.0
Process Control Charts – Control Chart with Stages
Using the “Stages” option supports the hypothesis
that the average of the Process Y and the standard
deviation of the Process Y may have changed after
the 15th data point. The process before and after
the change was stable and in control.
This document is a partial preview. Full document download can be found on Flevy:
https://flevy.com/browse/document/six-sigma--statistical-process-control-spc-604
40. 79 March 30, 2020 – v6.0
Time t
Process
Characteristic
e.g. Hole Size
average
Subgroup size n = 5
Number of subgroups N = 7
Process Control Charts – The Principle of Subgrouping
This document is a partial preview. Full document download can be found on Flevy:
https://flevy.com/browse/document/six-sigma--statistical-process-control-spc-604
41. 81 March 30, 2020 – v6.0
Process Control Charts – x-bar/R Chart Example
Minitab: Stat > Control Charts > Variable Charts for Subgroups > Xbar-R
This document is a partial preview. Full document download can be found on Flevy:
https://flevy.com/browse/document/six-sigma--statistical-process-control-spc-604
42. 83 March 30, 2020 – v6.0
Upper control limit =
Lower control limit =
The R Chart
Upper control limit =
Lower control limit =
The x-bar Chart
where x-bar1, x-bar2, ..., x-barN are the averages of each subgroup, n the
number of items in a subgroup, N the number of subgroups,
., and
Process Control Charts – x-bar/R Chart Control Limits
- 3 ⋅ 1.128 ⋅ .$
- 3 ⋅ 1.128 ⋅ .$
RD 4
0
N
xxx
x
N
...21
N
RRR
R N
...21minmax
iii xxR
, D4 depends on the subgroup size
This document is a partial preview. Full document download can be found on Flevy:
https://flevy.com/browse/document/six-sigma--statistical-process-control-spc-604
43. 85 March 30, 2020 – v6.0
Process Control Charts – x-bar/s Chart Example
Minitab: Stat > Control Charts > Variable Charts for Subgroups > Xbar-S
This document is a partial preview. Full document download can be found on Flevy:
https://flevy.com/browse/document/six-sigma--statistical-process-control-spc-604
44. 87 March 30, 2020 – v6.0
Upper control limit =
Lower control limit =
Upper control limit =
Lower control limit =
The s Chart
The x-bar Chart
, and
where x-bar1, x-bar2, ..., x-barN are the averages of each subgroup, s1, s2, ..., sN
are the standard deviations of each subgroup, n the number of items in each
subgroup, N the number of subgroups,
.
Process Control Charts – x-bar/s Chart Control Limits
sAx 3
sAx 3
sB 4
sB 3
N
xxx
x
N
...21
N
sss
s N
...21
, B4 depends on the subgroup size
, B3 depends on the subgroup size
, A3 depends on the subgroup size
This document is a partial preview. Full document download can be found on Flevy:
https://flevy.com/browse/document/six-sigma--statistical-process-control-spc-604
45. 89 March 30, 2020 – v6.0
Process Control Charts – The Binomial Distribution
The histogram above shows data from a
process that in average creates 30 defective
items in a sample of 100, i.e. a 30% Defect
Rate.
The Binomial distribution is very similar to a
Normal distribution.
The histogram above shows data from a
process that in average creates 5 defective
items in a sample of 100, i.e. a 5% Defect
Rate.
The Binomial Distribution is asymmetric due
to the lower boundary of 0.
Process data monitoring the number of defective items creates a
Binomial Distribution.
This document is a partial preview. Full document download can be found on Flevy:
https://flevy.com/browse/document/six-sigma--statistical-process-control-spc-604
46. 91 March 30, 2020 – v6.0
Process Control Charts – np - Chart Example
Minitab: Stat > Control Charts > Attributes Charts > NP
Special Cause criteria for attribute
charts (outlier – trend – shift).
This document is a partial preview. Full document download can be found on Flevy:
https://flevy.com/browse/document/six-sigma--statistical-process-control-spc-604
47. 93 March 30, 2020 – v6.0
Lower control limit =
Upper control limit =
with
where np1, np2, ..., npN are the number of defective items in each
subgroup of constant size n, and N the number of subgroups.
13)
2
1
(
n
pn
pnpn
13)
2
1
(
n
pn
pnpn
np
np np np
N
N
1 2
3
...
Process Control Limits – The np - Chart
Standard Deviation of the
Binomial Distribution.
This document is a partial preview. Full document download can be found on Flevy:
https://flevy.com/browse/document/six-sigma--statistical-process-control-spc-604
48. 95 March 30, 2020 – v6.0
• The p - chart is used to look at variation in yes/no attribute data. It
can for example be used to monitor the percentages or proportions p
of defective items in a group of items.
• The number n of items in each group has not to be constant, but
should not vary more than 25 %.
• Operational definitions must be used to determine what constitutes a
defective item.
• The standard deviation of a Binomial distribution is
Process Control Charts – The p - Chart
where is the average proportion of defective items based on all
subgroups and n is the average subgroup size.
/̄
/̄ ⋅ 1 /̄ .̄$
This document is a partial preview. Full document download can be found on Flevy:
https://flevy.com/browse/document/six-sigma--statistical-process-control-spc-604
49. 97 March 30, 2020 – v6.0
Process Control Charts – The p – Chart Example
Proportion of defects in each subgroup.
In this case the subgroup size varied
between 95 and 105. Average defect
rate is 8.12%.
The standard deviation is depended
on the subgroup size. As the subgroup
sizes vary, the standard deviation and
control limits vary.
1 point > 3 standard deviations
from the center line indicates an
outlier in process performance.
This document is a partial preview. Full document download can be found on Flevy:
https://flevy.com/browse/document/six-sigma--statistical-process-control-spc-604
50. 99 March 30, 2020 – v6.0
The number of wrong assembled components in 20 units were
1 - 20: 10 wrong assembled components
21 - 40: 8 wrong assembled components
41 - 60: 7 wrong assembled components
61 - 80: 5 wrong assembled components
81 - 100: 6 wrong assembled components
101 - 120: 9 wrong assembled components
121 - 140: 7 wrong assembled components
141 - 160: 5 wrong assembled components
161 - 180: 2 wrong assembled components. Something changed ???
Process Control Charts – The Attribute “Count” Data
This document is a partial preview. Full document download can be found on Flevy:
https://flevy.com/browse/document/six-sigma--statistical-process-control-spc-604
51. 101 March 30, 2020 – v6.0
• The c - chart is used to look at variation in counting-type attributes
data. It is used to determine the variation in the number of defects in
a constant subgroup size.
• For example, a c - chart can be used for example to monitor the
number on injuries in a plant for a specific time period. In this case,
the plant is the subgroup.
• To use the c - chart, the opportunities for incidences to occur in the
subgroup must be very large, but the number that actually occur must
be small.
• The standard deviation of a Poisson distribution is
Process Control Charts – The c – Chart
where is the average number of defects or occurrences based on all
subgroups.
1̄
1
This document is a partial preview. Full document download can be found on Flevy:
https://flevy.com/browse/document/six-sigma--statistical-process-control-spc-604
52. 103 March 30, 2020 – v6.0
Process Control Charts – The c - Chart Example
Number of incidences in a specific
time period or samples over time.
In this case the average number of
incidences is 14.72.
This document is a partial preview. Full document download can be found on Flevy:
https://flevy.com/browse/document/six-sigma--statistical-process-control-spc-604
53. 105 March 30, 2020 – v6.0
The number of invoices typing errors per week were
# of Error # of Invoices
Week 1: 7 95
Week 2: 5 90
Week 3: 9 100
Week 4: 12 125
Week 5: 8 95
Week 6: 4 50
Week 7: 6 55
Week 8: 9 80
Week 9: 15 125 → Something changed ???
Process Control Charts – The Attribute “Count” Data
This document is a partial preview. Full document download can be found on Flevy:
https://flevy.com/browse/document/six-sigma--statistical-process-control-spc-604
54. 107 March 30, 2020 – v6.0
Process Control Charts – u - Chart Example
Minitab: Stat > Control Charts > Attributes Charts > U
Special Cause criteria for attribute
charts (outlier – trend – shift).
This document is a partial preview. Full document download can be found on Flevy:
https://flevy.com/browse/document/six-sigma--statistical-process-control-spc-604
55. 109 March 30, 2020 – v6.0
u u n 3
Lower control limit =
Upper control limit =
with andu
c c c
n n n
N
N
1 2
1 2
...
..
, n
n n n
N
N
( ... )1 2
where c1, c2, ..., cN are the number of occurrences in each subgroup and
n1, n2, ..., nN are the number of items or units in each of the N subgroups.
Note: The subgroup sizes should not vary more than 25% around the
average subgroup size.
0,3max nuu
Process Control Limits – The u - Chart
This document is a partial preview. Full document download can be found on Flevy:
https://flevy.com/browse/document/six-sigma--statistical-process-control-spc-604
56. 111 March 30, 2020 – v6.0
Section 1: Statistical Process Thinking
Section 2: Basic Statistics
Section 3: Introduction to Statistical Process Control
Section 4: Statistical Process Control Charts
Section 5: Sample Size and Frequency
Section 6: Out-of-Control Action Plan
Section 7: Process Control Plan
Statistical Process Control (SPC) – Table of Contents
This document is a partial preview. Full document download can be found on Flevy:
https://flevy.com/browse/document/six-sigma--statistical-process-control-spc-604
57. 113 March 30, 2020 – v6.0
avg
Sample Size & Frequency – Subgroup Size & Sensitivity
USL
avg + STs3
UCLLCL
avg - STs3 avg + E
Shift of Y by E
Defects
This document is a partial preview. Full document download can be found on Flevy:
https://flevy.com/browse/document/six-sigma--statistical-process-control-spc-604
58. 115 March 30, 2020 – v6.0
• The frequency of sampling of two consecutive individual data
points or subgroups of data points can be determined by
dividing the average time period between two out-of-control
situations by at least 3 but not more than 6.
Example: If experience shows that your process produces
defects or goes out-of-control once every 12-hour shift, you
should start with collect measurements from your process Y
every 2 to 4 hours.
Sample Size & Frequency – Sample Frequency
• However, no general rule can be defined about
which time interval works best. You have to start
with a good (conservative) guess and refine the
time interval if or as necessary.
This document is a partial preview. Full document download can be found on Flevy:
https://flevy.com/browse/document/six-sigma--statistical-process-control-spc-604
59. 117 March 30, 2020 – v6.0
Section 1: Statistical Process Thinking
Section 2: Basic Statistics
Section 3: Introduction to Statistical Process Control
Section 4: Statistical Process Control Charts
Section 5: Sample Size and Frequency
Section 6: Out-of-Control Action Plan
Section 7: Process Control Plan
Statistical Process Control (SPC) – Table of Contents
This document is a partial preview. Full document download can be found on Flevy:
https://flevy.com/browse/document/six-sigma--statistical-process-control-spc-604
60. 119 March 30, 2020 – v6.0
Start
Checkpoints
Activators
Corrective ActionsNo
No
No
Yes
Yes
Yes
Yes
Yes
Yes
End
No
No
Out-of-Control-Action-Plans (OCAP)
This document is a partial preview. Full document download can be found on Flevy:
https://flevy.com/browse/document/six-sigma--statistical-process-control-spc-604
61. 121 March 30, 2020 – v6.0
The checkpoints instruct the process operator or owner to
investigate specific items as possible assignable causes for
the out-of-control situation.
Once a checkpoint has identified a probable assignable
cause for the out-of-control situation, the OCAP will flow
into a terminator or corrective action.
Out-of-Control-Action-Plans – Checkpoints
This document is a partial preview. Full document download can be found on Flevy:
https://flevy.com/browse/document/six-sigma--statistical-process-control-spc-604
62. 123 March 30, 2020 – v6.0
... typically generate one or more of the following actions:
Eliminate the most common assignable causes
Analyze the activators
Revise the order of the checkpoints and terminators
Train the operators or owner to perform more of the
corrective actions included into the OCAP to resolve
out-of-control situations quickly
An Analysis of Out-of-Control-Action-Plans ...
This document is a partial preview. Full document download can be found on Flevy:
https://flevy.com/browse/document/six-sigma--statistical-process-control-spc-604
63. 125 March 30, 2020 – v6.0
Remarks or Questions ?!?Remarks or Questions ?!?
This document is a partial preview. Full document download can be found on Flevy:
https://flevy.com/browse/document/six-sigma--statistical-process-control-spc-604
64. 127 March 30, 2020 – v6.0
Process Control Plan – Objective
A Control Plan is a written statement of an organization’s quality
planning actions for a specific process, product, or service.
The Objective of an effective Process Control Plan is to
• operate processes consistently on target with minimum
variation, which results in minimum waste and rework
• assure that product and process improvements that have been
identified and implemented become institutionalized
• provide for adequate training in all standard operating
procedures, work instructions and tools
Customer
Requirements
Product & Part
Characteristics
Process
Input & Output
Characteristics
Process
Controls
Process
Control
Plan
This document is a partial preview. Full document download can be found on Flevy:
https://flevy.com/browse/document/six-sigma--statistical-process-control-spc-604
65. 129 March 30, 2020 – v6.0
• Process: Name of the process to be controlled
• Process Step: The process steps of the process to be controlled
• Characteristic (Product/Process): Name of the characteristic of a process step or
a product, which will actually be controlled.
• Specification: Actual specification, which has been set for the characteristic to
be controlled. This may be verified e.g. in standards, drawings, requirements
or product requirement documents.
• Control Limits: Control limits are specified for characteristics that are
quantifiable and selected for trend analysis (x-bar/R, x/mR, p charts). When
the process exceeds these limits, corrective actions are required.
• Measurement System: Method used to evaluate or measure the characteristic.
This may include e.g. gages, tools, jigs and test equipment or work methods.
An analysis of the repeatability and the reproducibility of the measurement
system must first be carried out (e.g. Gage R&R Study).
Process Control Plan – Template
This document is a partial preview. Full document download can be found on Flevy:
https://flevy.com/browse/document/six-sigma--statistical-process-control-spc-604
66. 131 March 30, 2020 – v6.0
Process maps detail manufacturing
steps, material flow and important
variables
Key product variables identified with
importance to customer, desired target
value and specification range defined
Key and critical process input variables
identified with targets, statistically
determined control limits & control
strategies defined
Measurement systems are capable with
calibration requirements specified
Sampling, inspection and testing plans
include how often, where and to
whom results are reported
Reaction plan in place for out-of-spec
conditions and material
Operating procedures identify actions,
responsibilities, maintenance schedule
and product segregation requirements
Training materials describe all aspects
of process operation and responsibili-
ties
Process improvement efforts fully
documented and available for refe-
rence
Control plan is reviewed and updated
quarterly and resides in the operating
area
Process Control Plan – Check List
This document is a partial preview. Full document download can be found on Flevy:
https://flevy.com/browse/document/six-sigma--statistical-process-control-spc-604
67. 133 March 30, 2020 – v6.0
Section 1: Statistical Process Thinking
Section 2: Basic Statistics
Section 3: Introduction to Statistical Process Control
Section 4: Statistical Process Control Charts
Section 5: Sample Size and Frequency
Section 6: Out-of-Control Action Plan
Section 7: Process Control Plan
Statistical Process Control (SPC) – Table of Contents
This document is a partial preview. Full document download can be found on Flevy:
https://flevy.com/browse/document/six-sigma--statistical-process-control-spc-604
68. 135 March 30, 2020 – v6.0
The End …
“Perfectionis not attainable, but if we chase perfectionwe can catch
excellence.” - Vince Lombardi
This document is a partial preview. Full document download can be found on Flevy:
https://flevy.com/browse/document/six-sigma--statistical-process-control-spc-604
69. 1
Flevy (www.flevy.com) is the marketplace
for premium documents. These
documents can range from Business
Frameworks to Financial Models to
PowerPoint Templates.
Flevy was founded under the principle that
companies waste a lot of time and money
recreating the same foundational business
documents. Our vision is for Flevy to
become a comprehensive knowledge base
of business documents. All organizations,
from startups to large enterprises, can use
Flevy— whether it's to jumpstart projects, to
find reference or comparison materials, or
just to learn.
Contact Us
Please contact us with any questions you may have
about our company.
• General Inquiries
support@flevy.com
• Media/PR
press@flevy.com
• Billing
billing@flevy.com