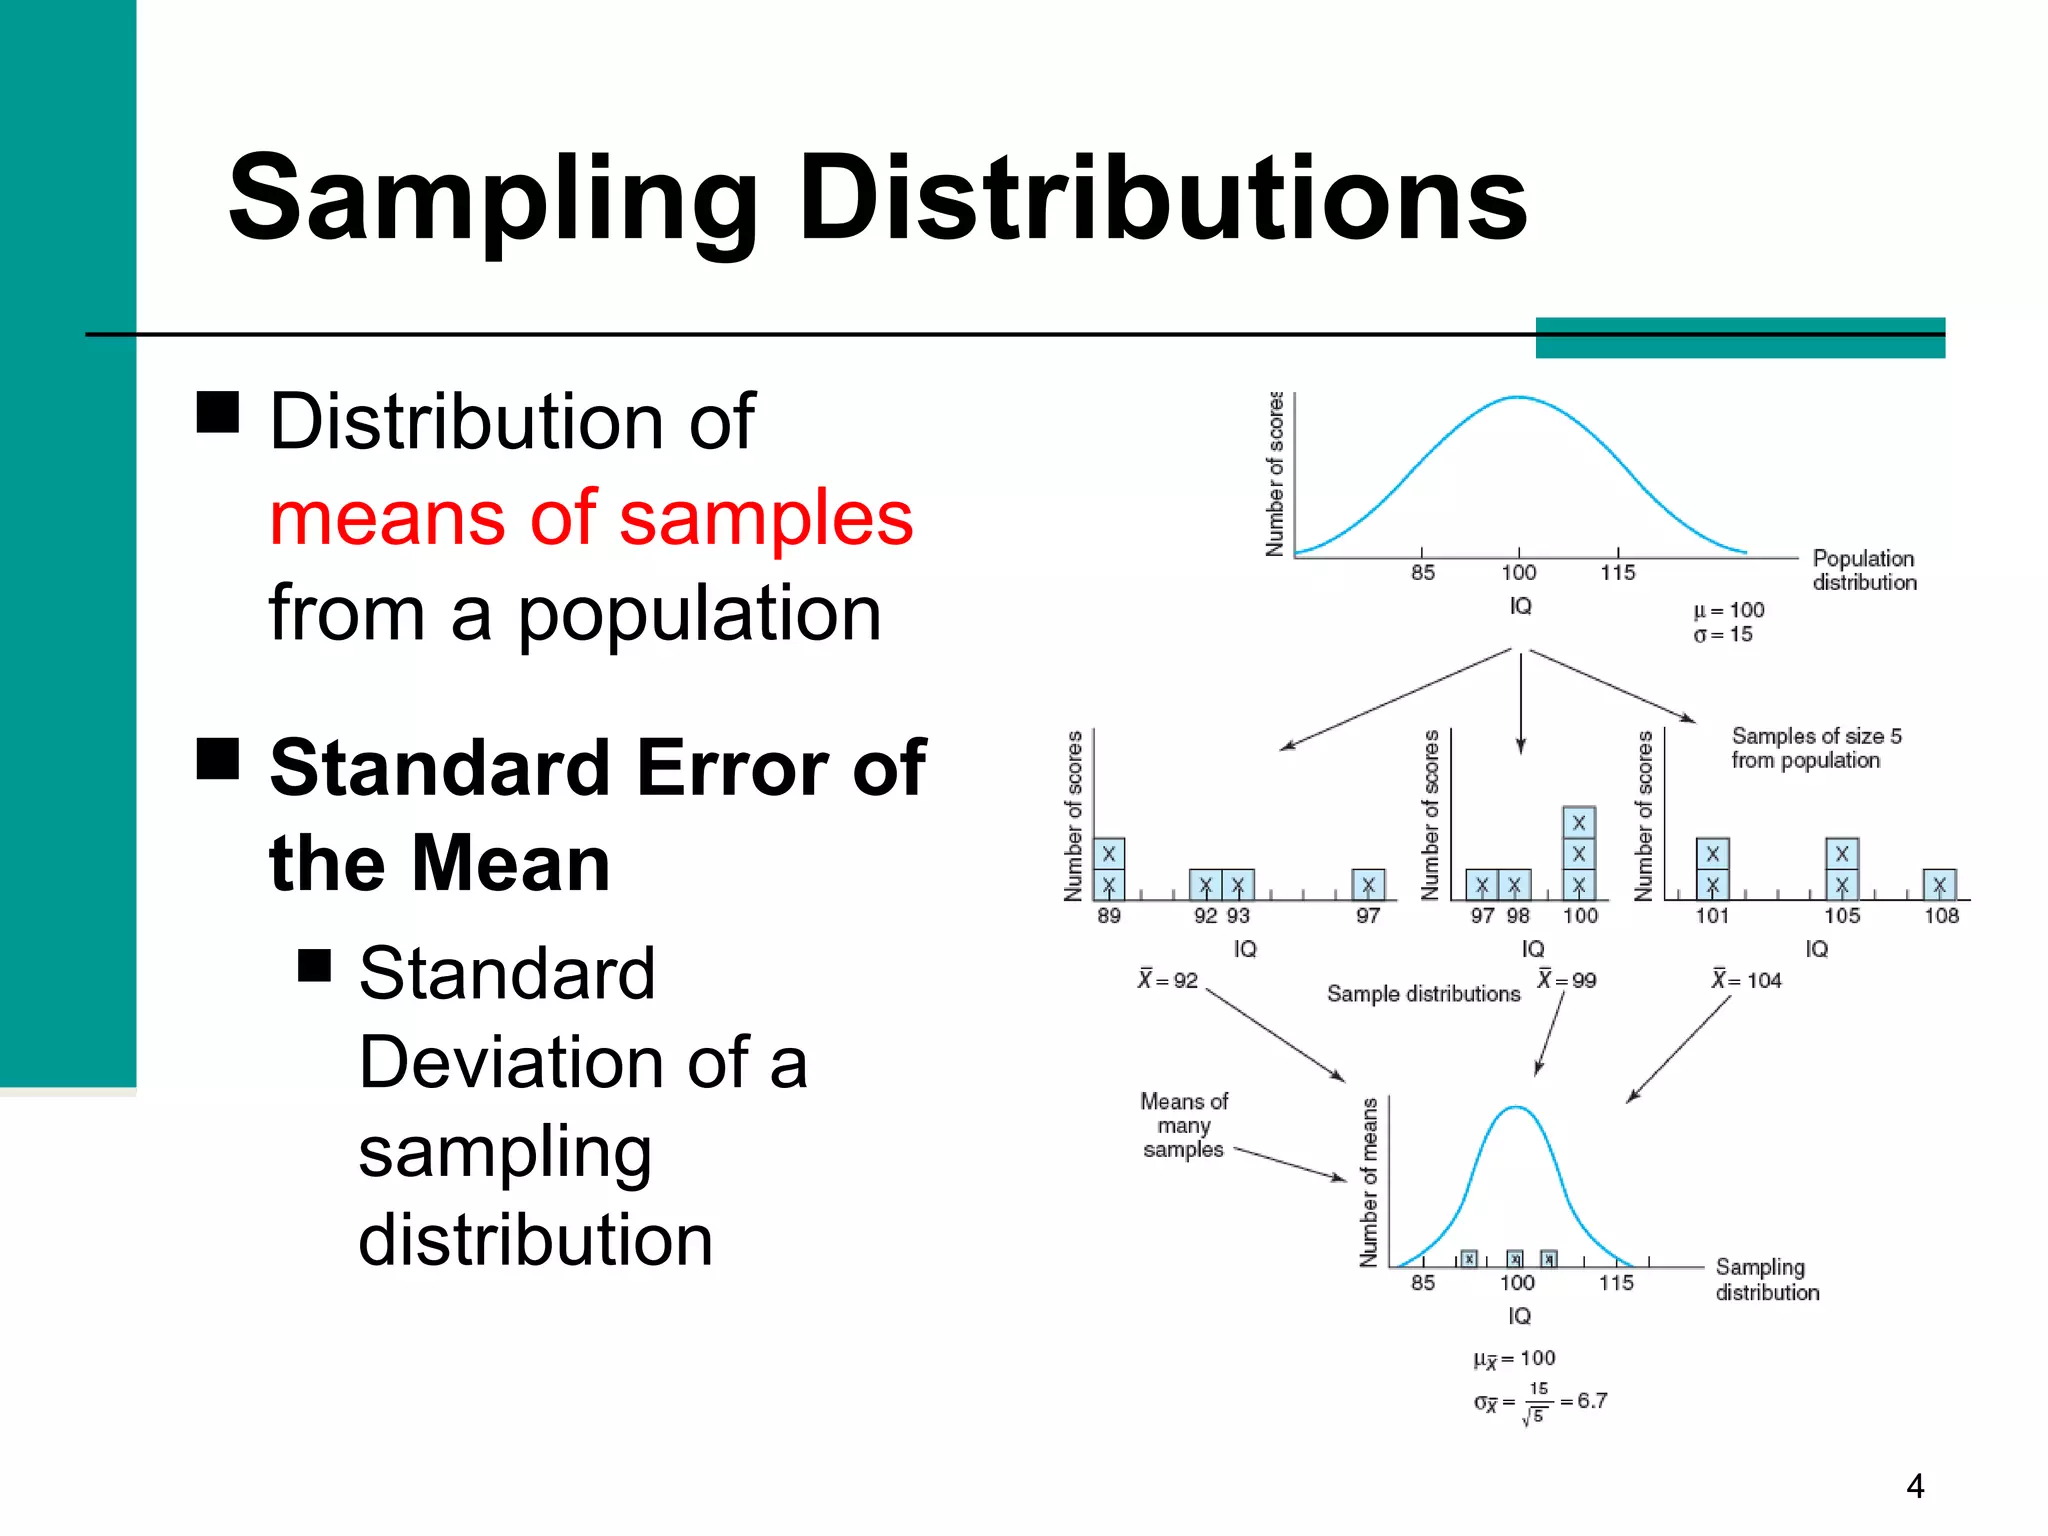
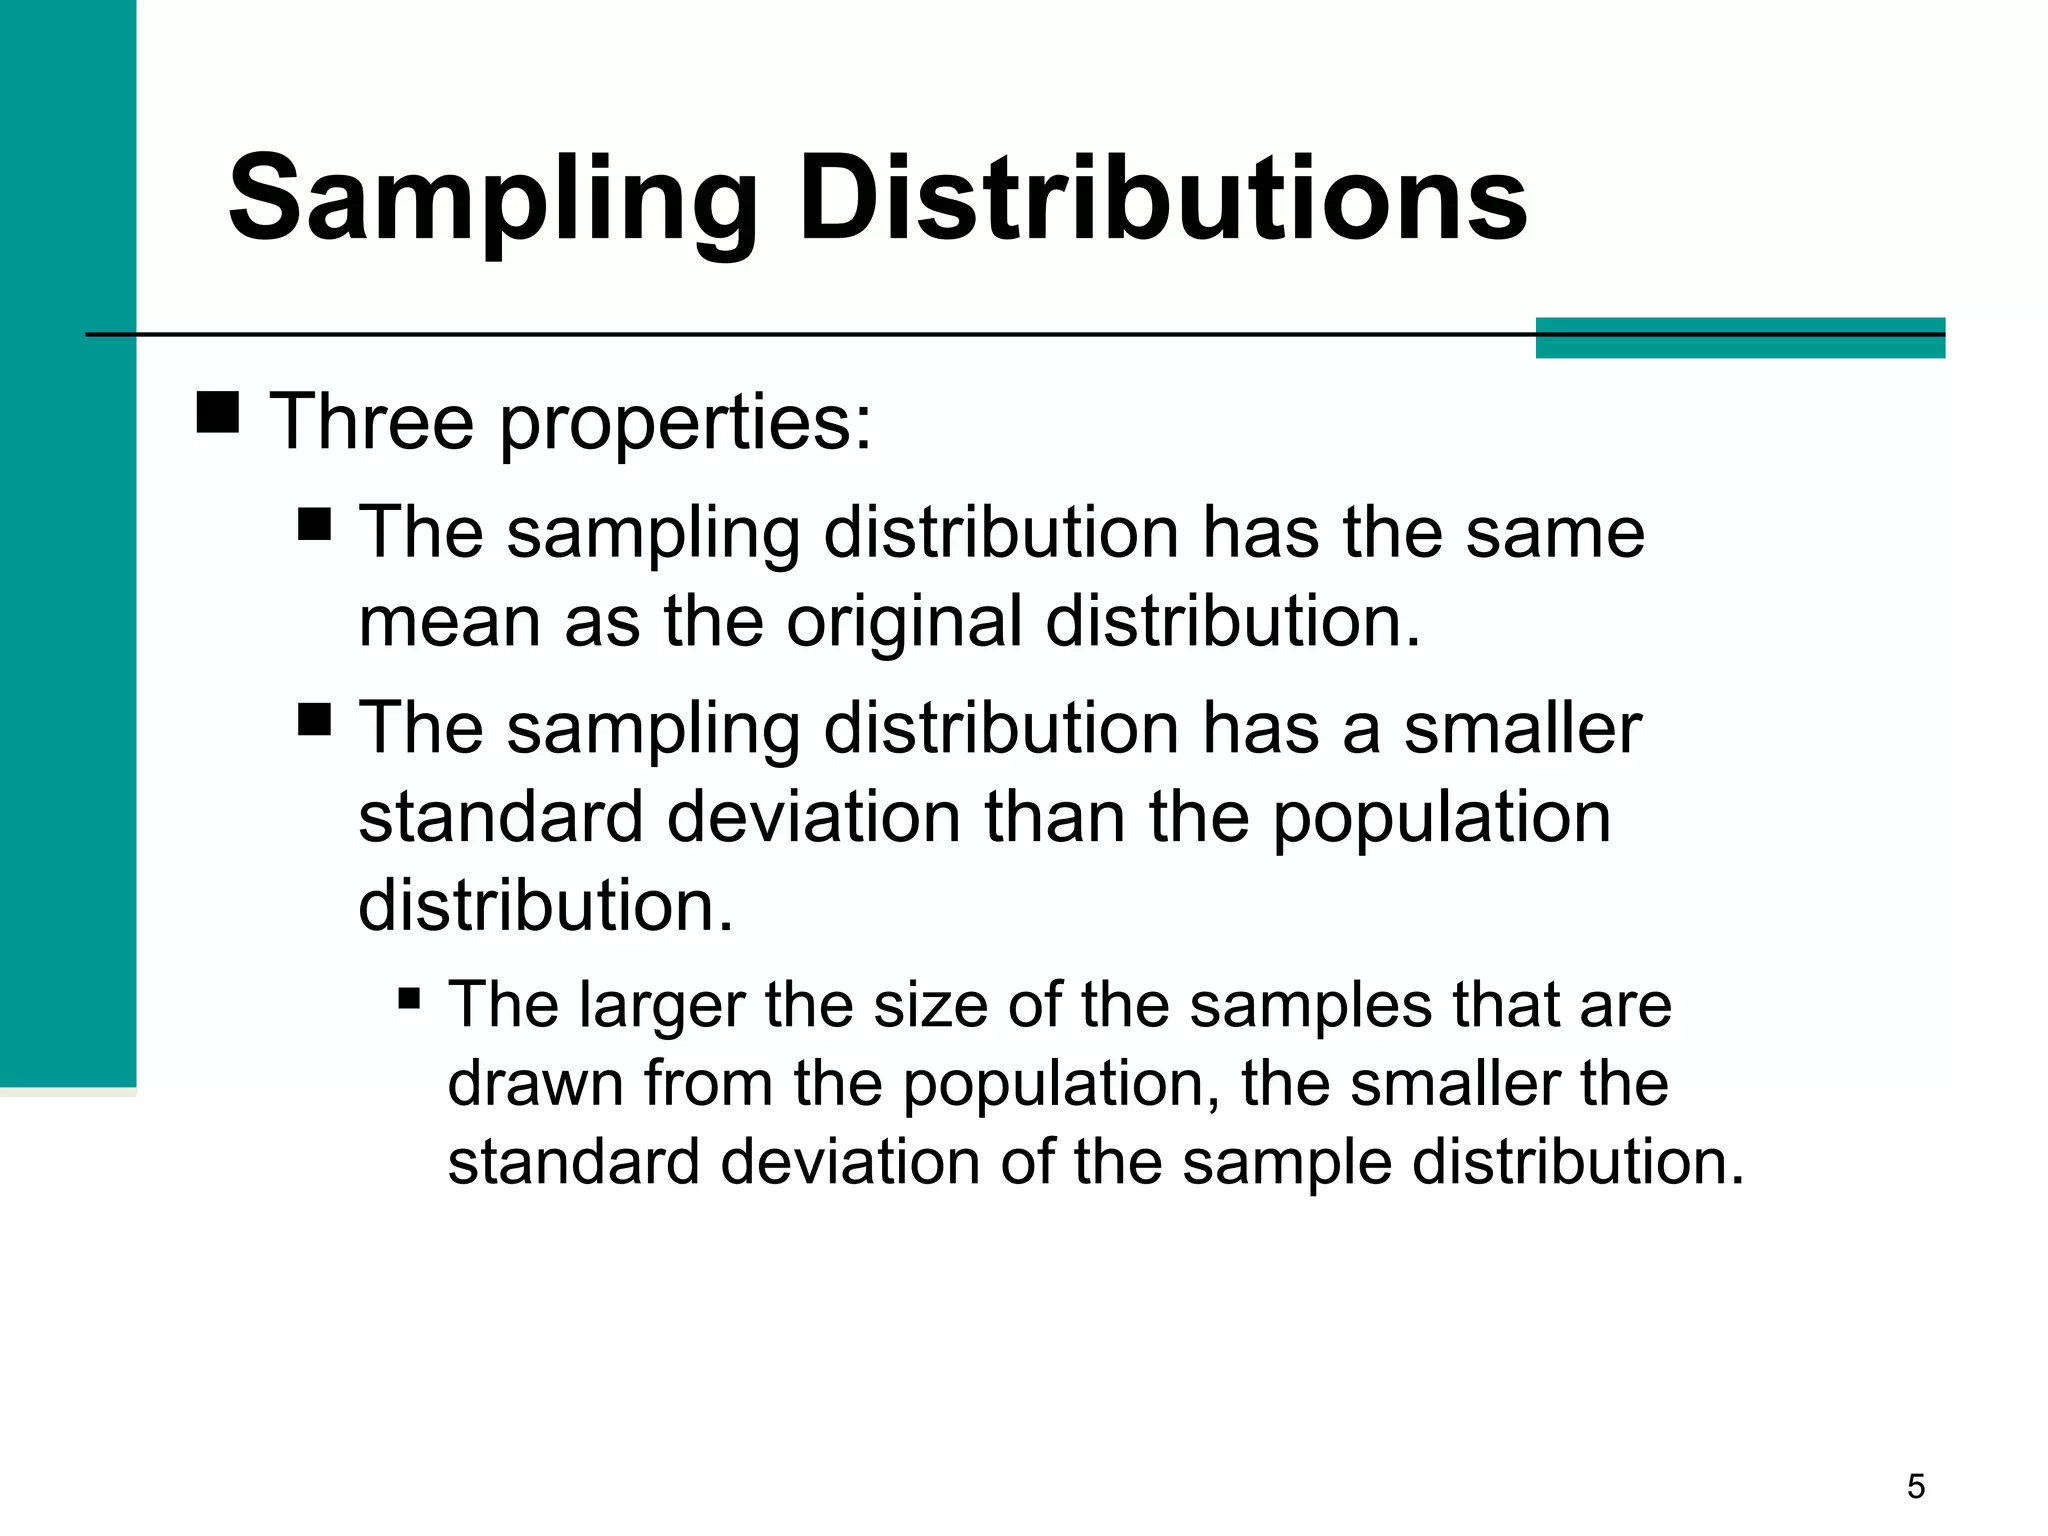
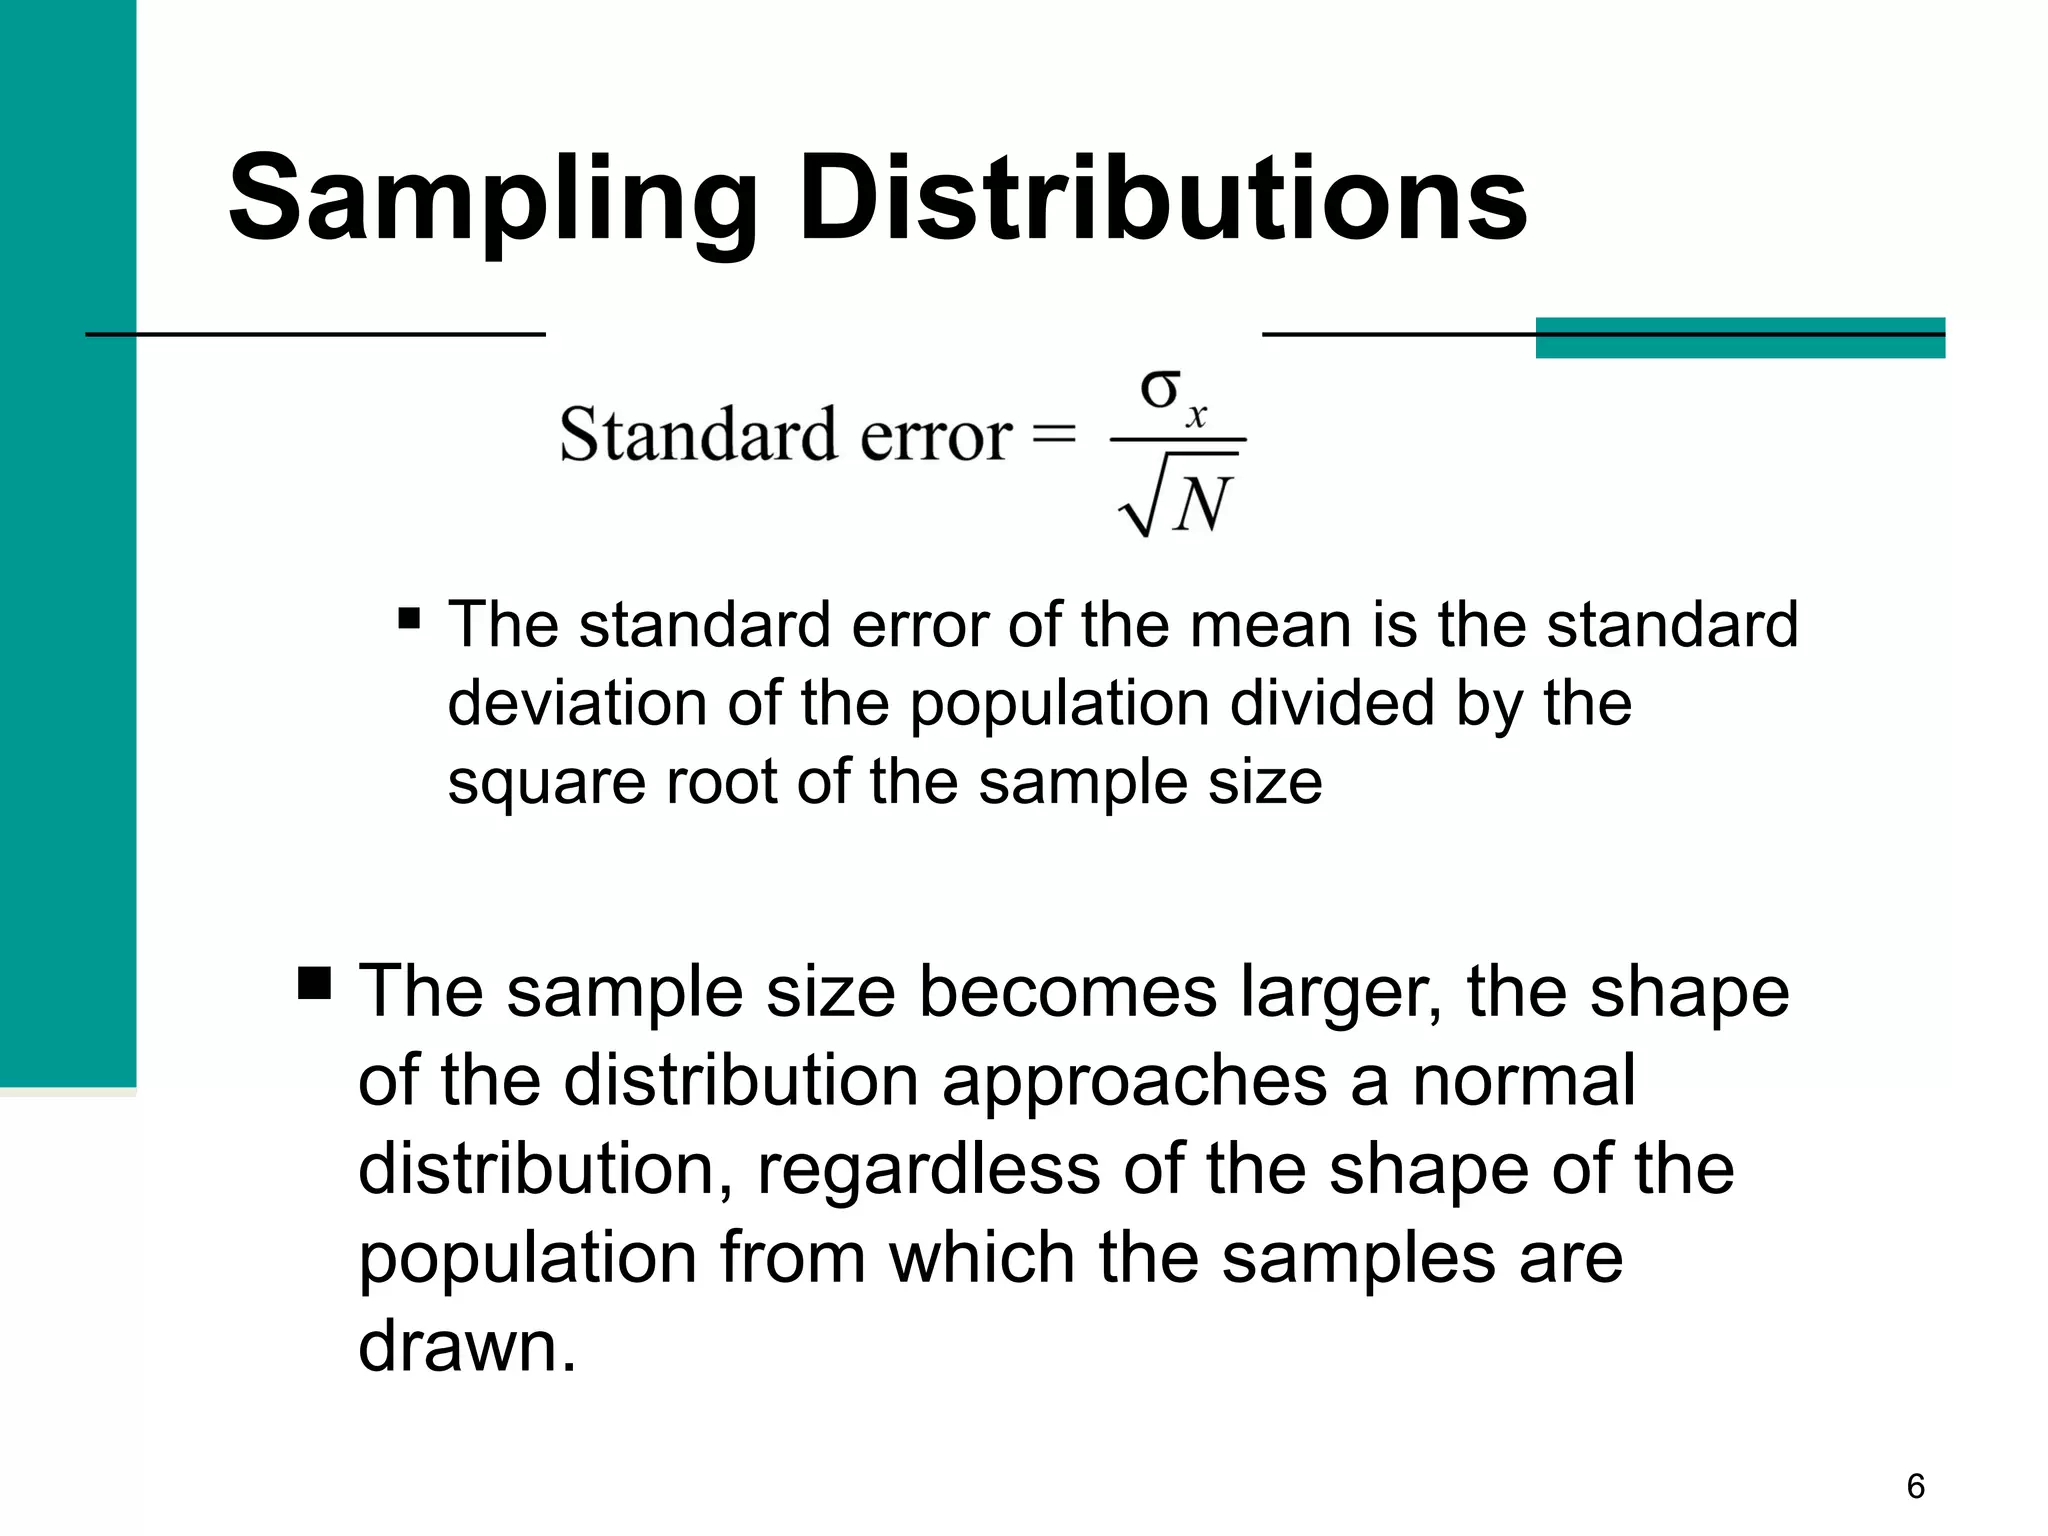
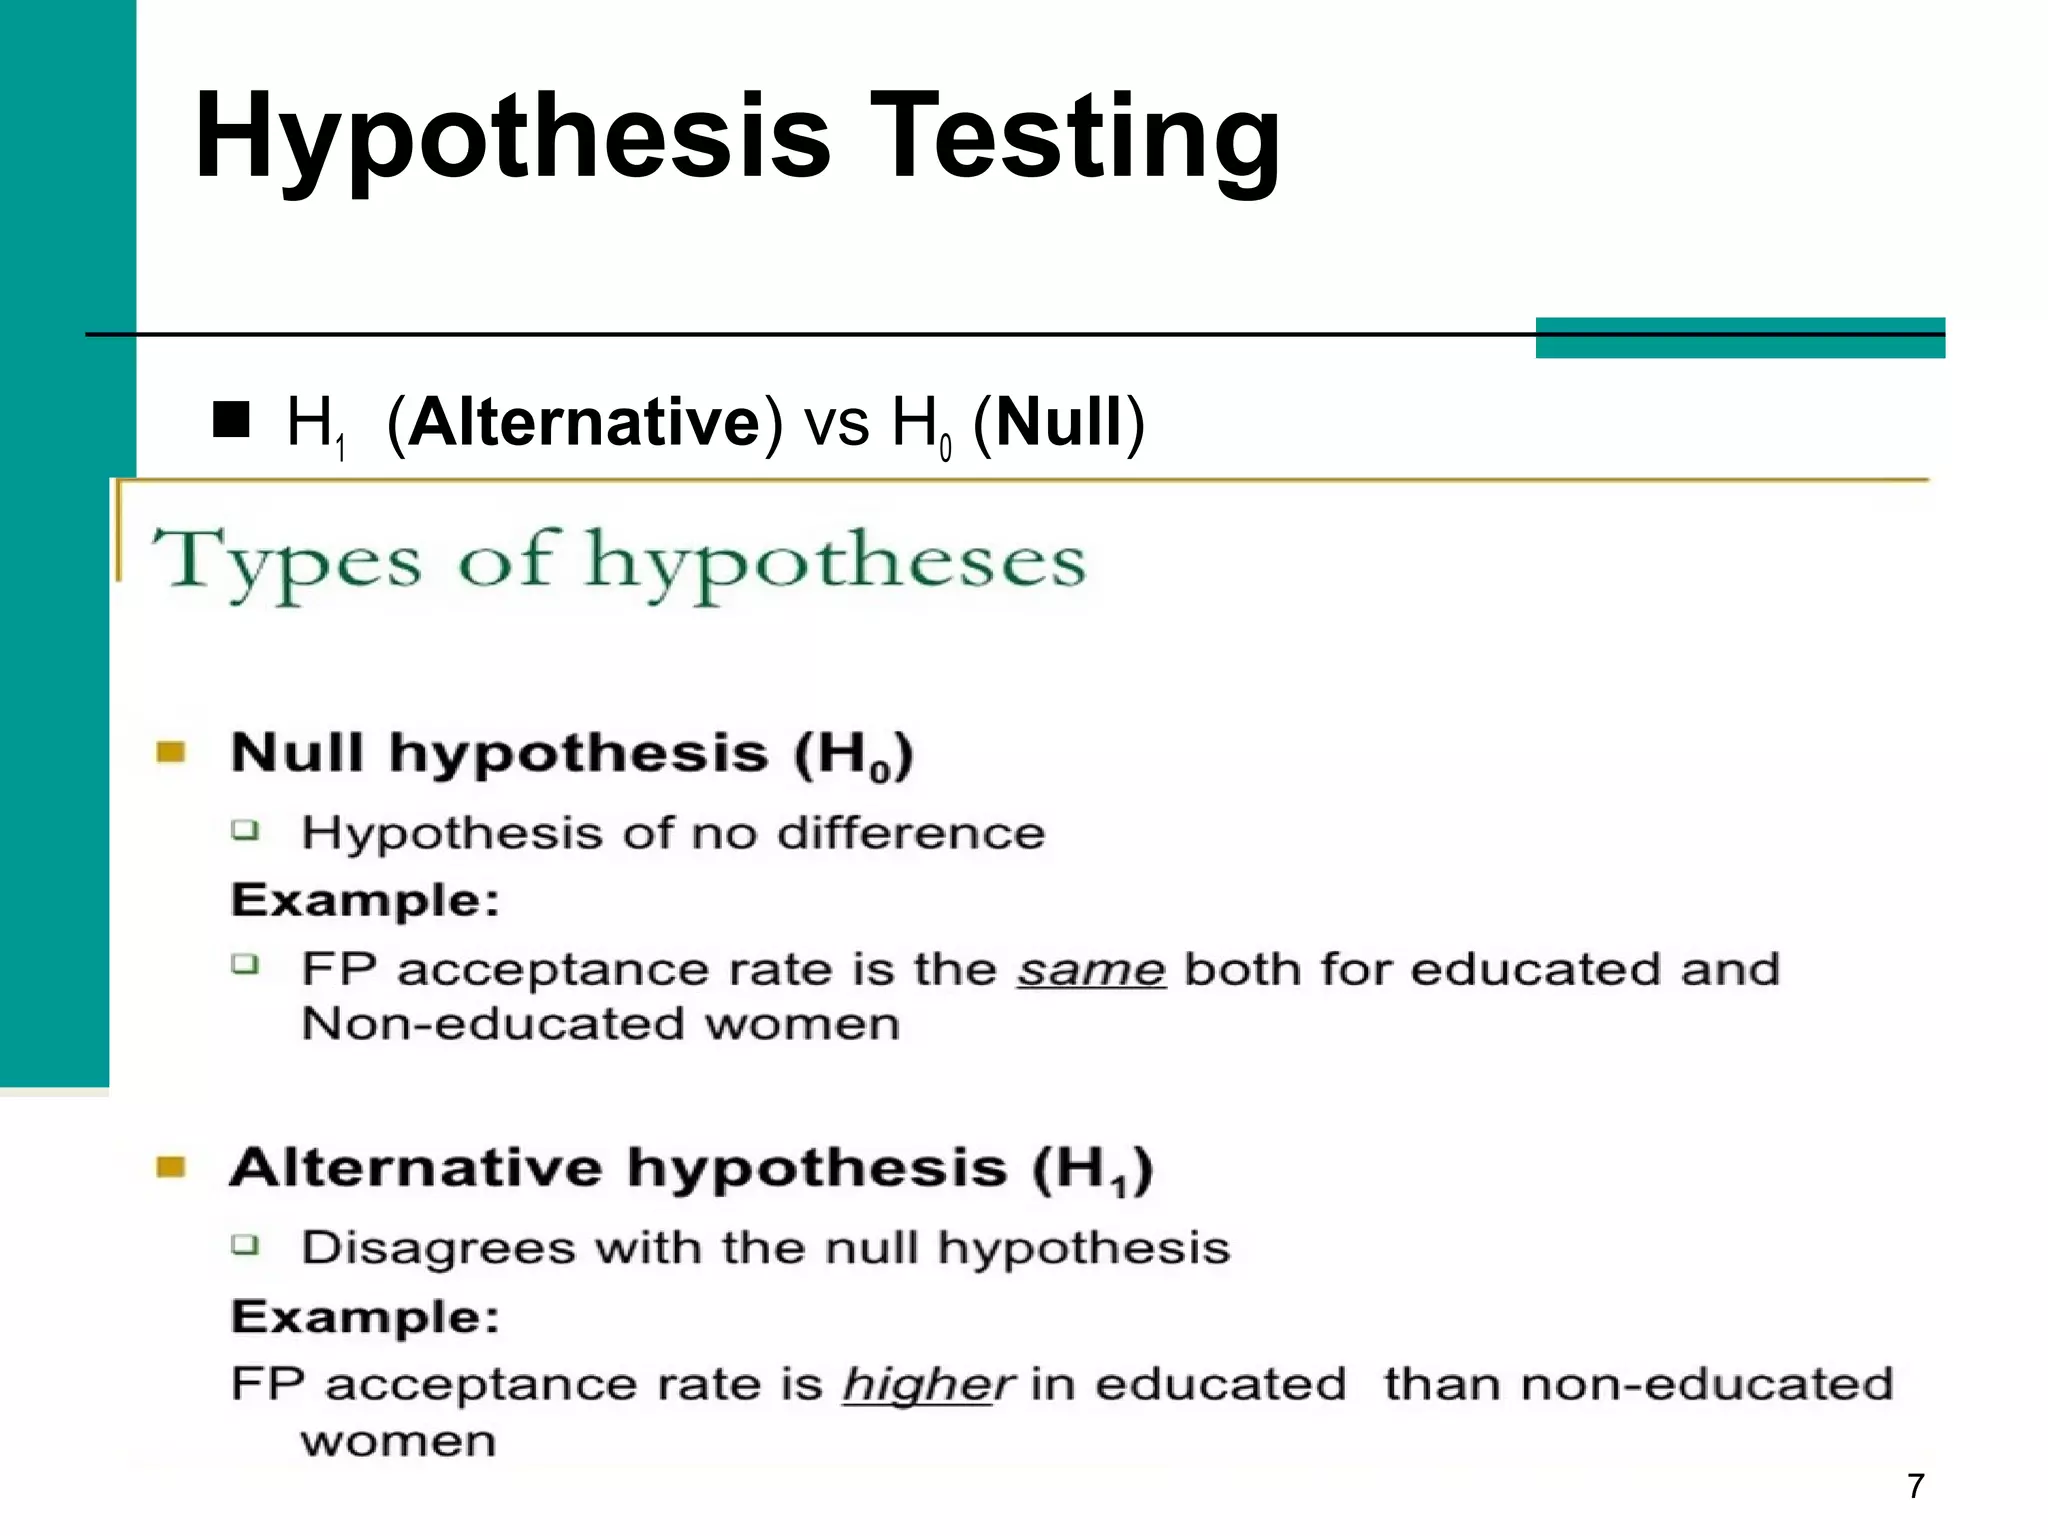
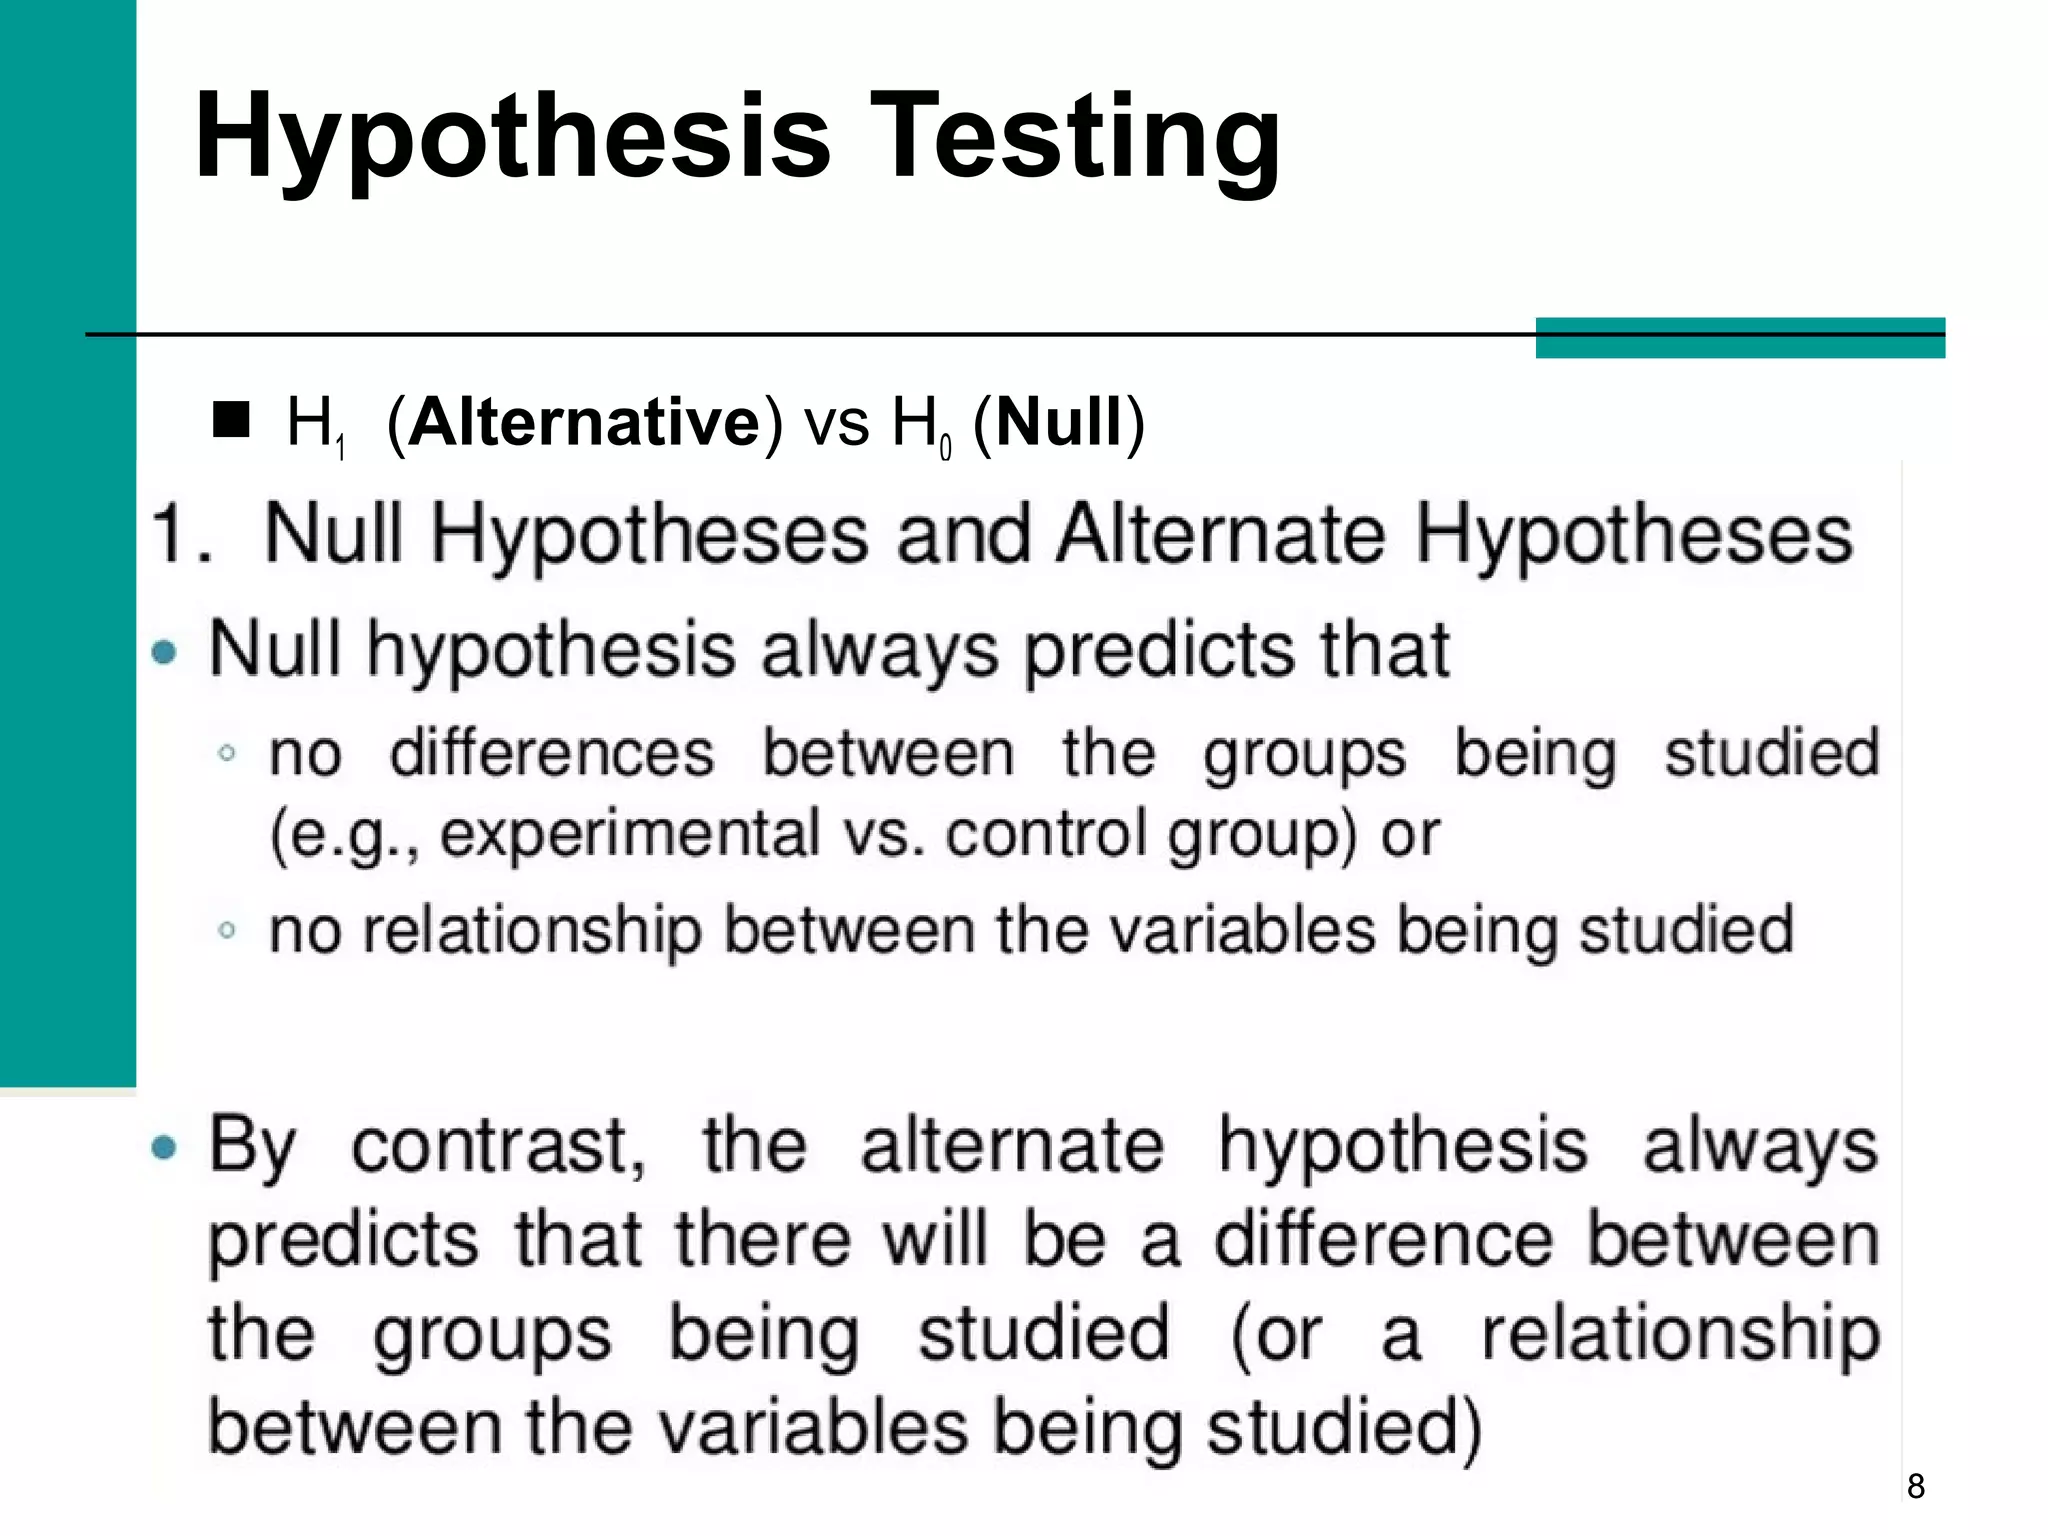
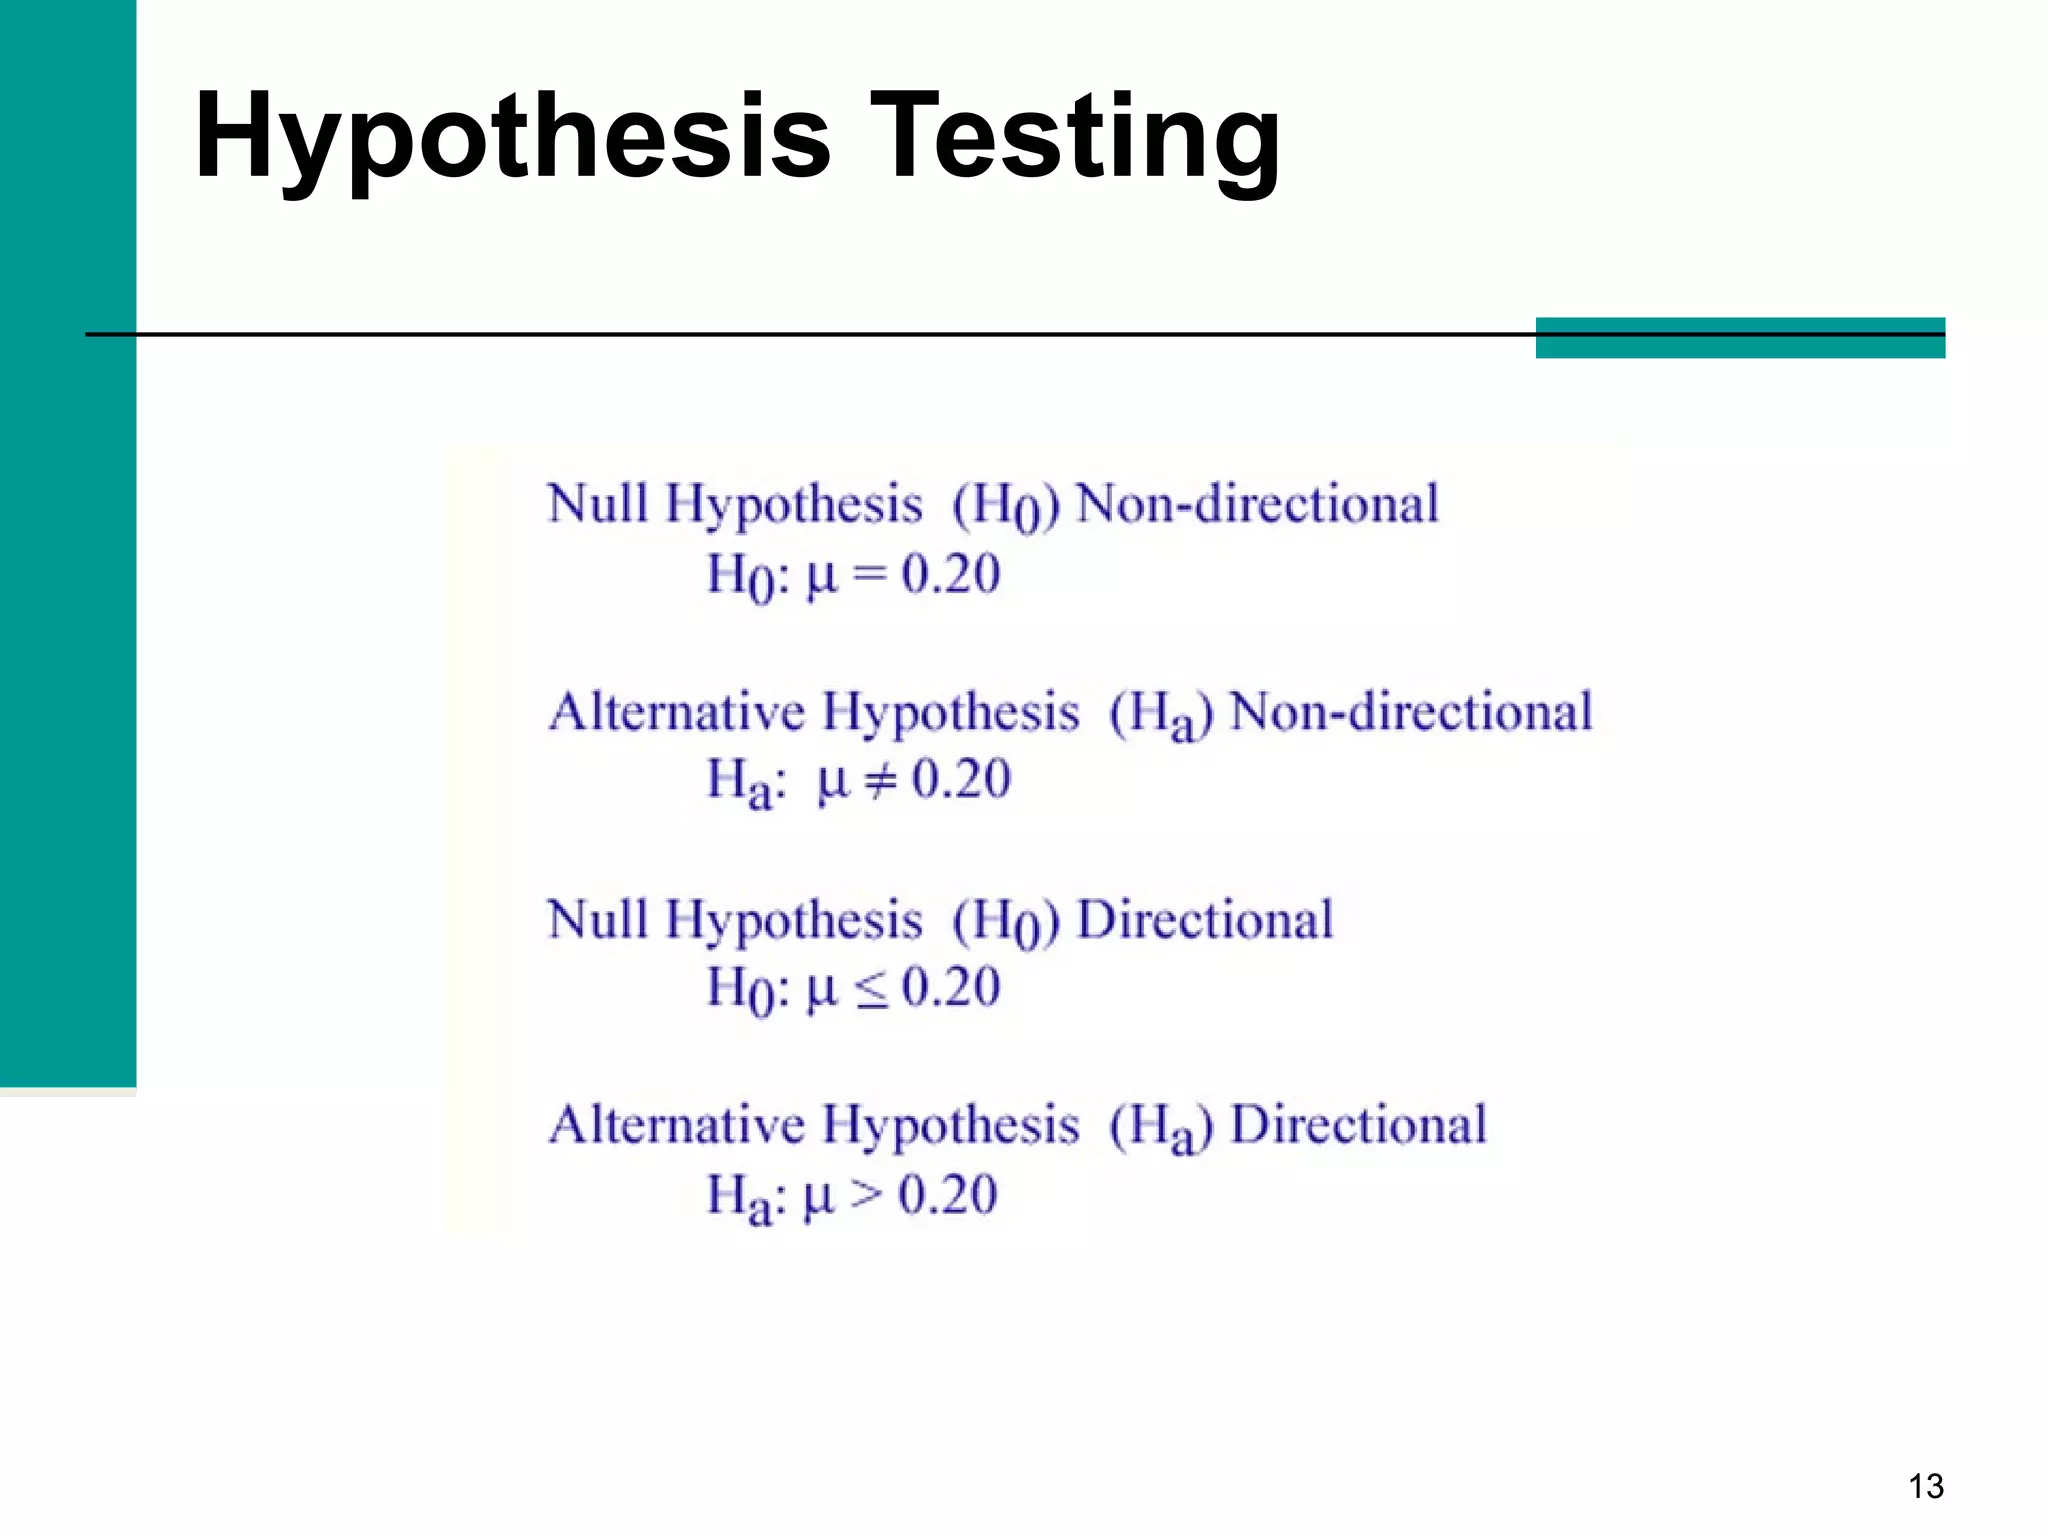
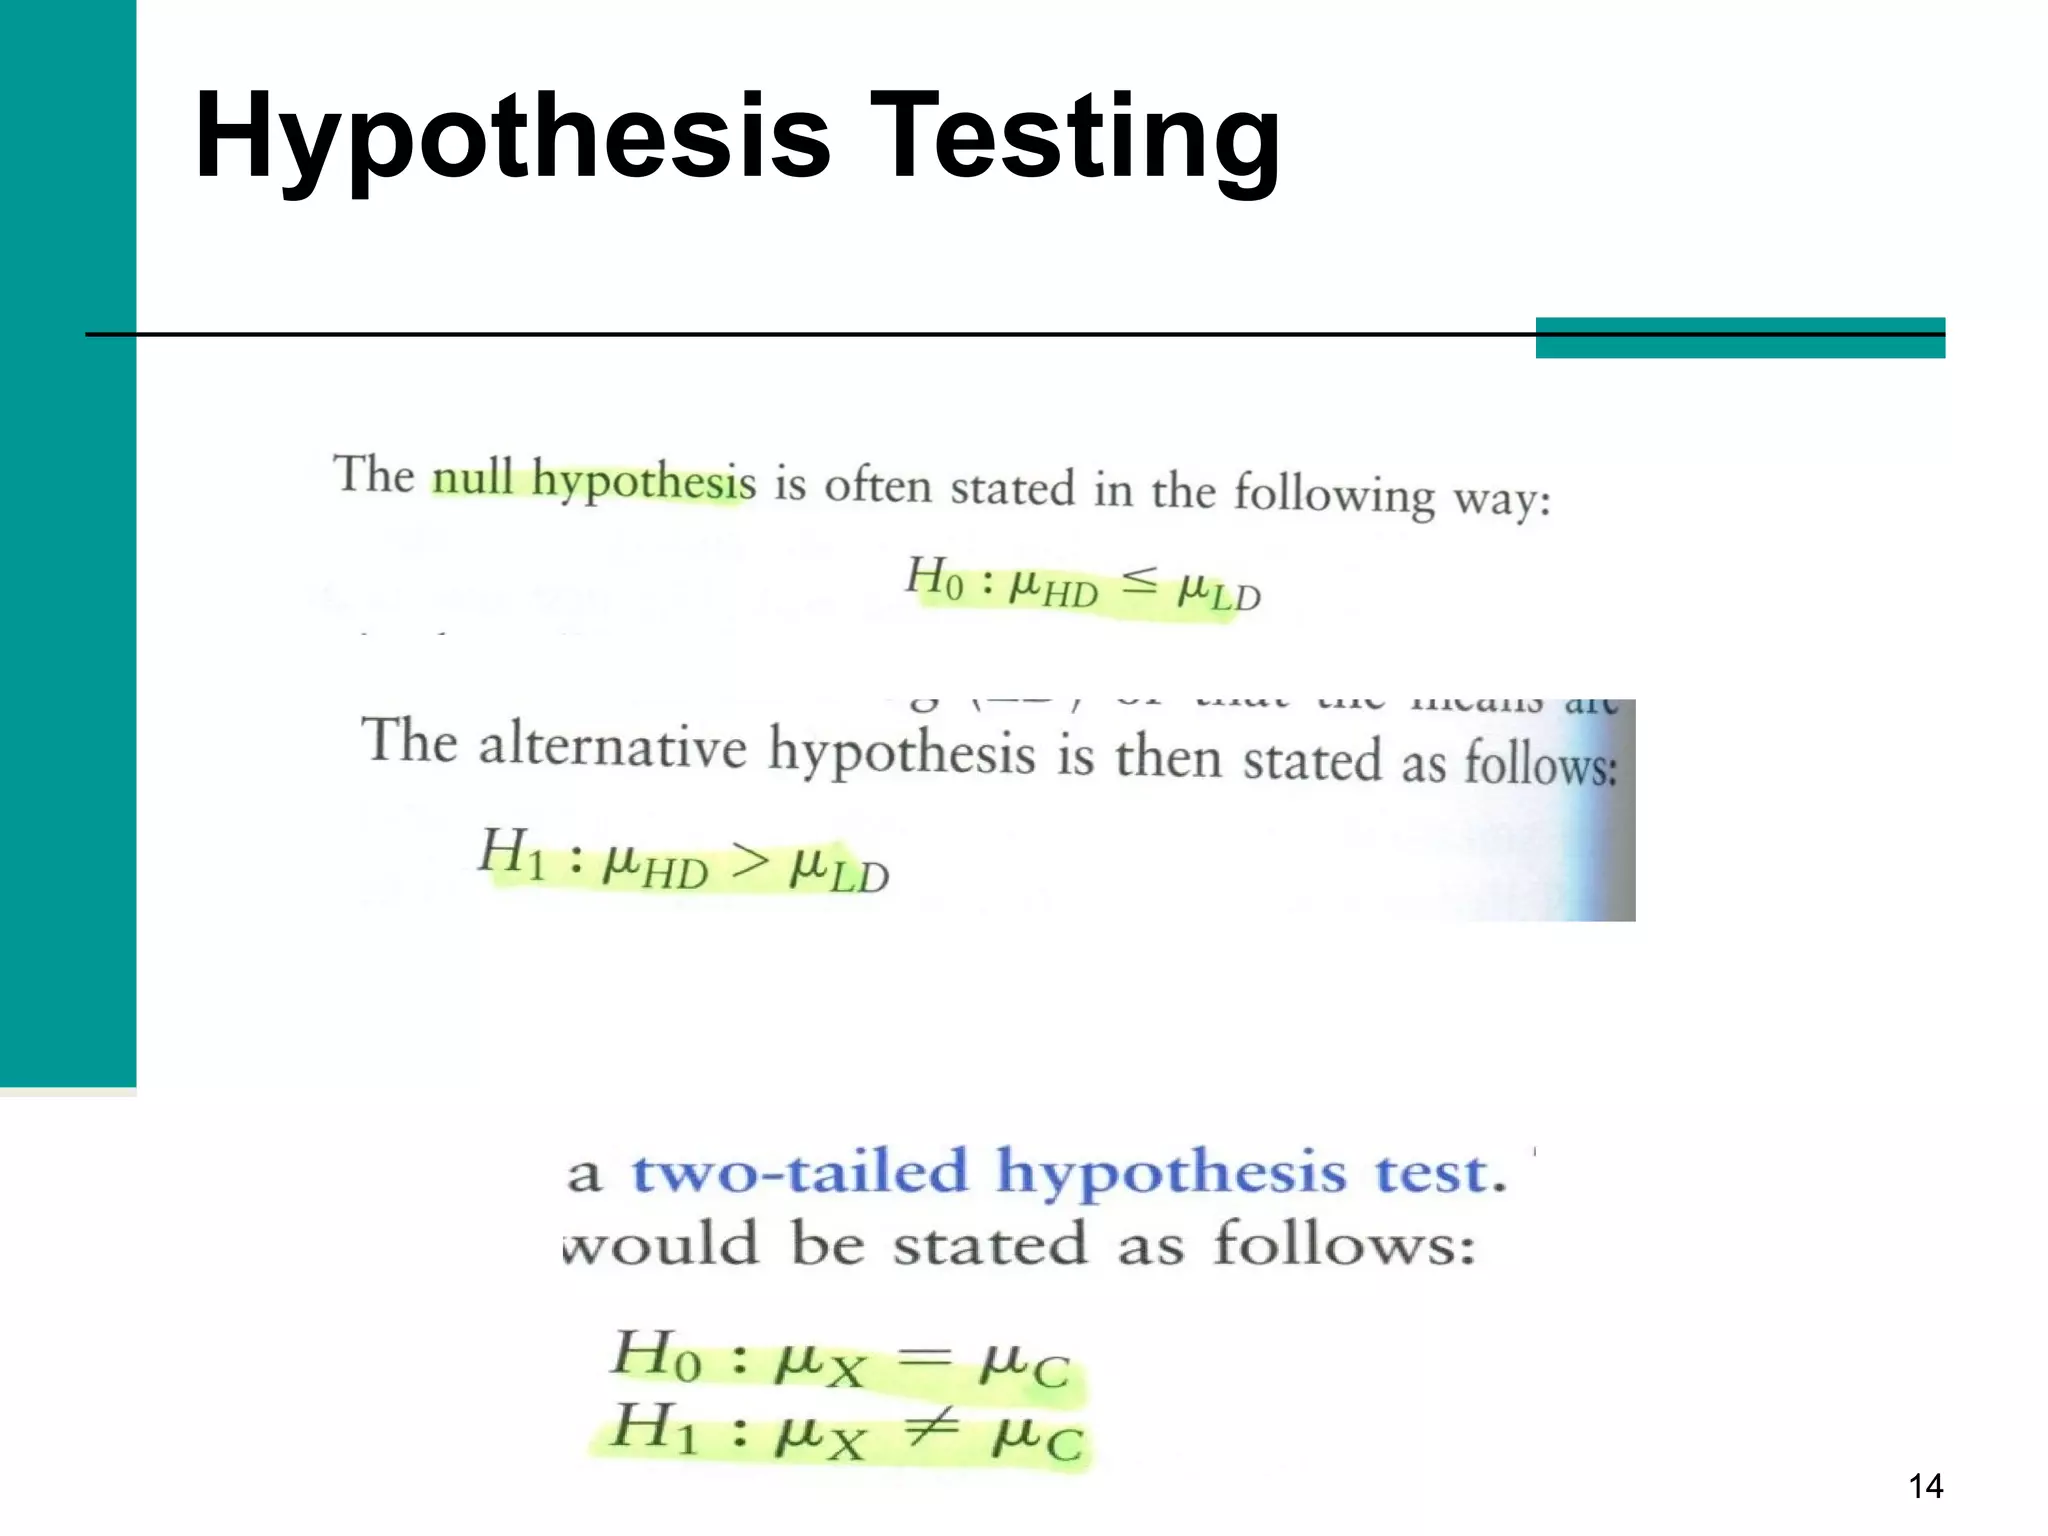
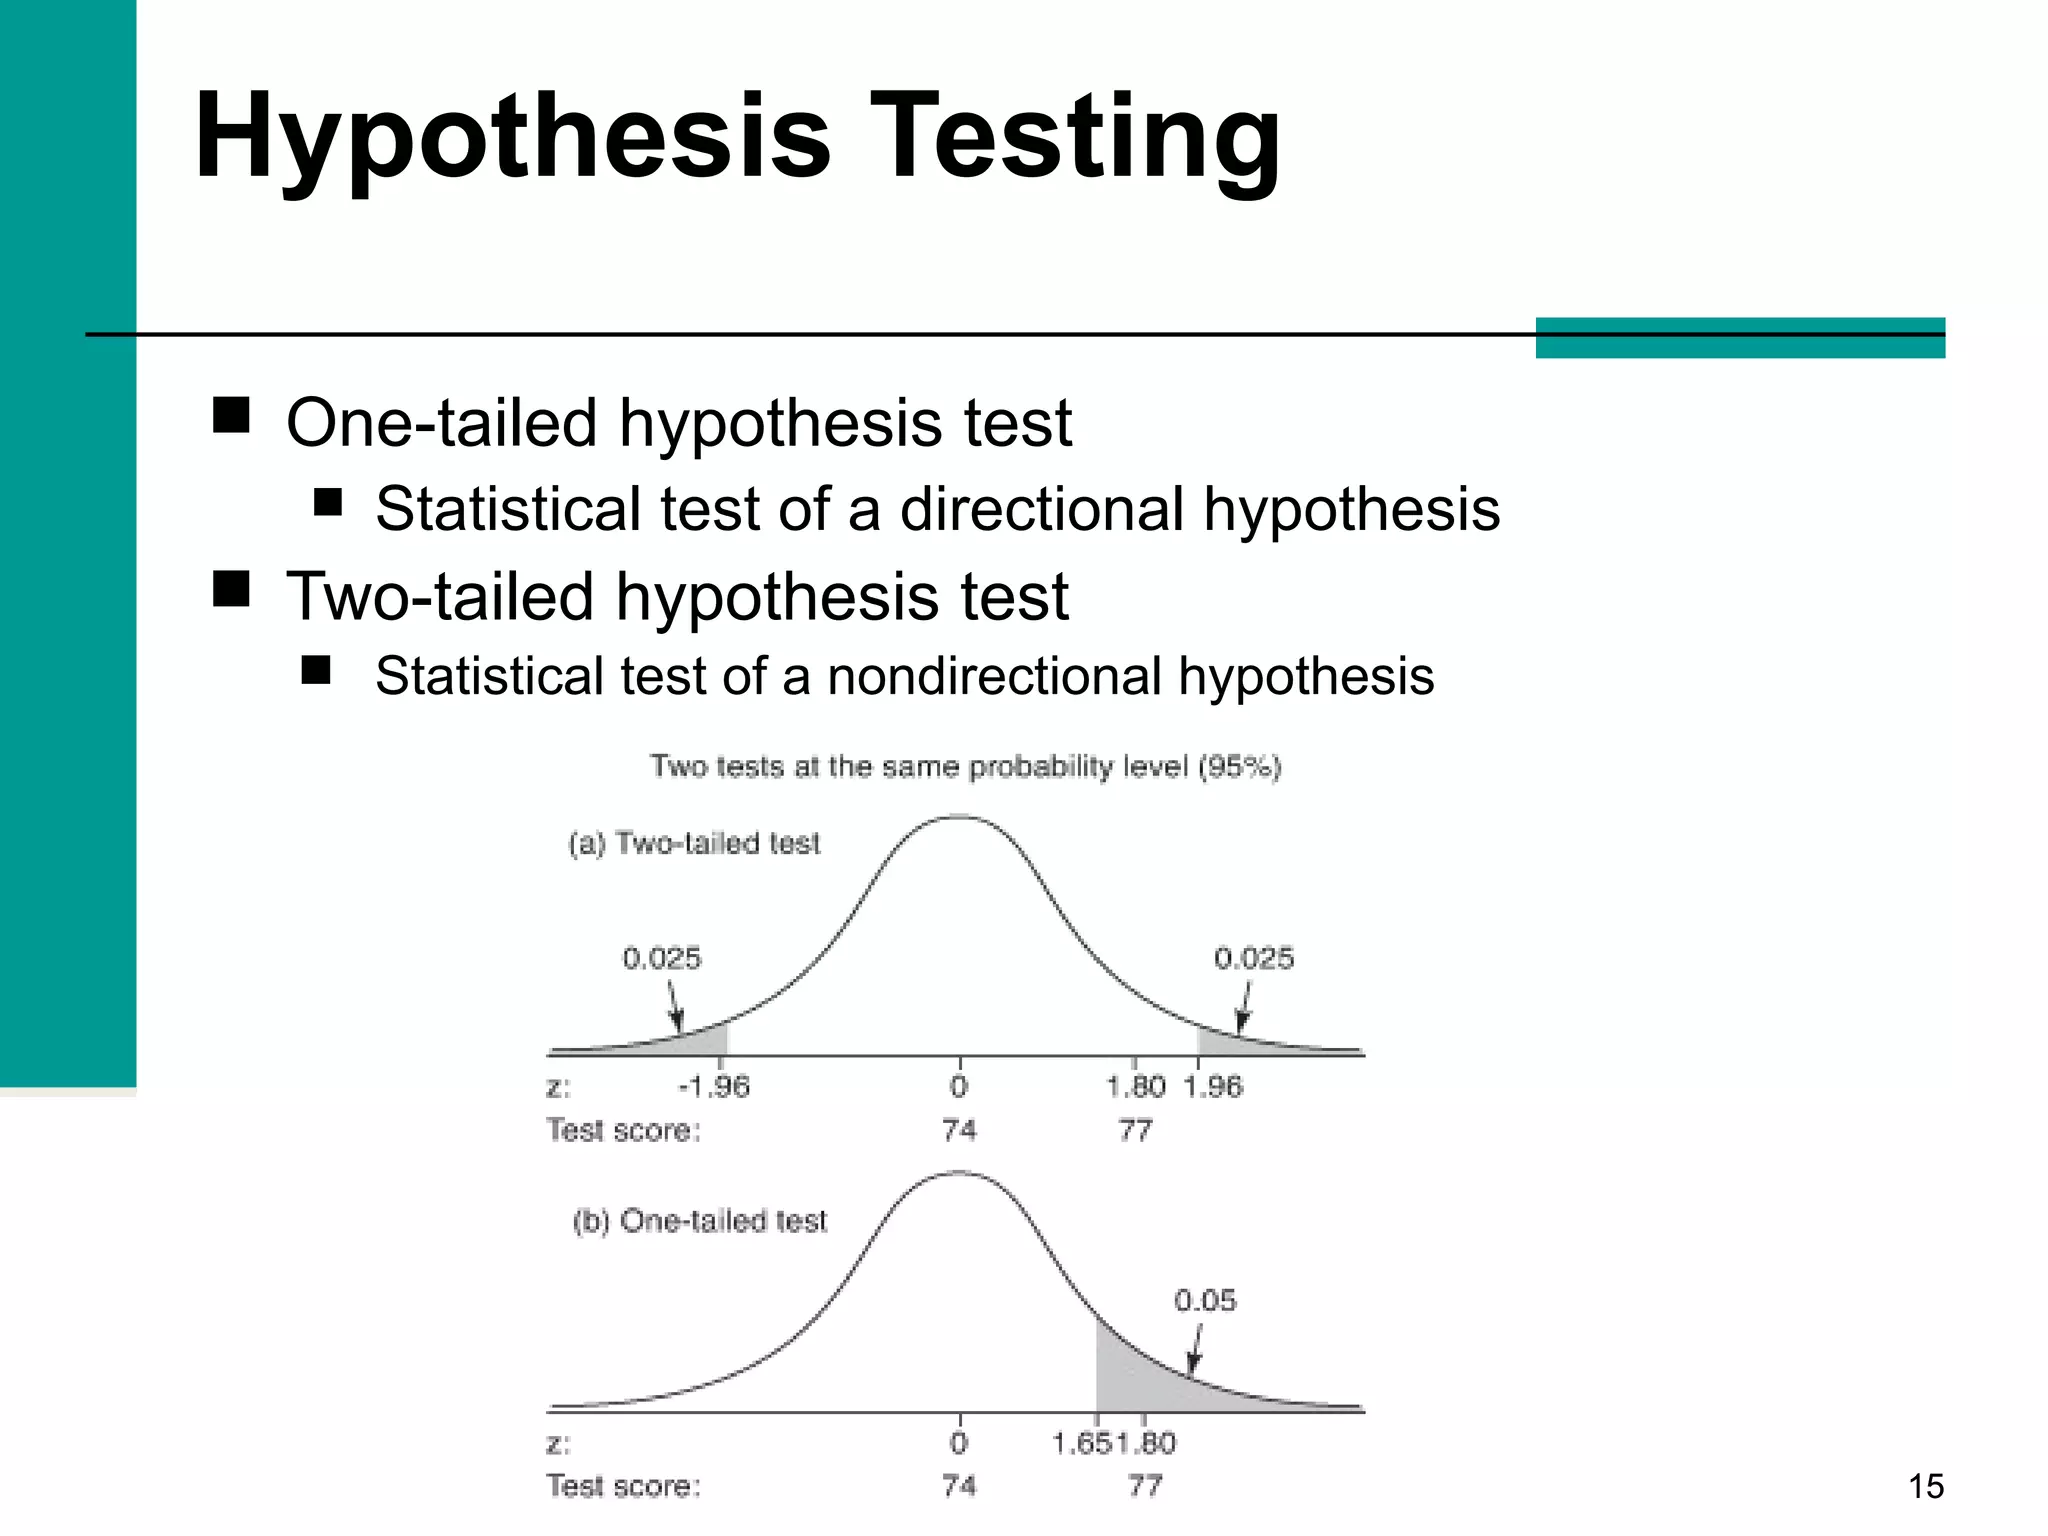
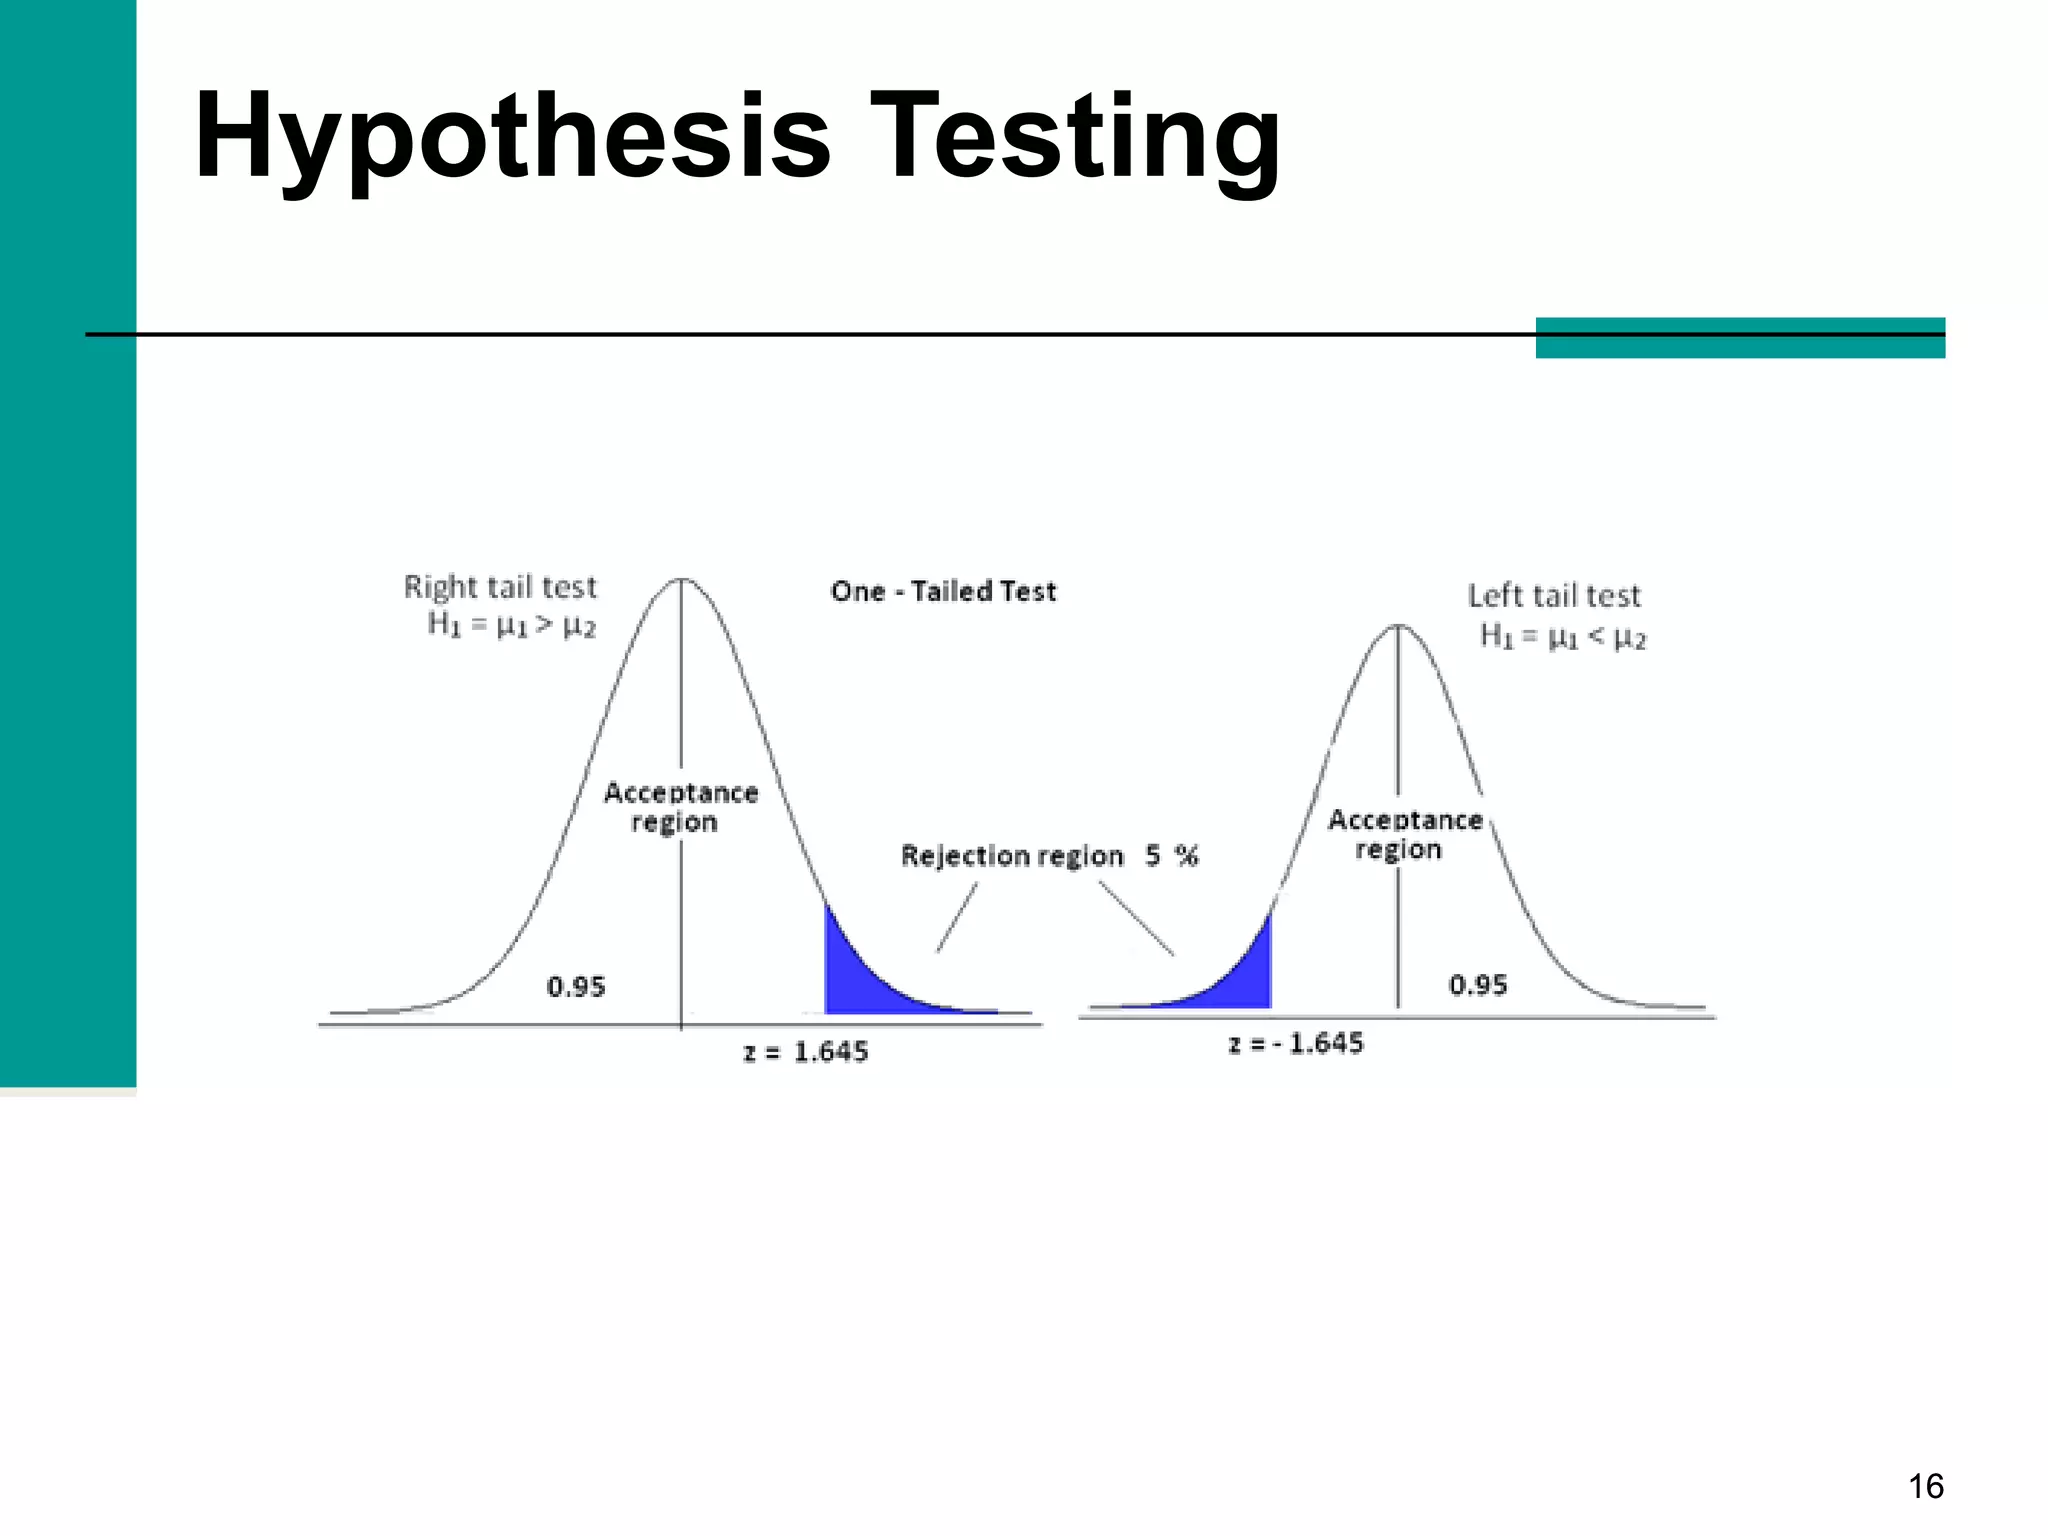
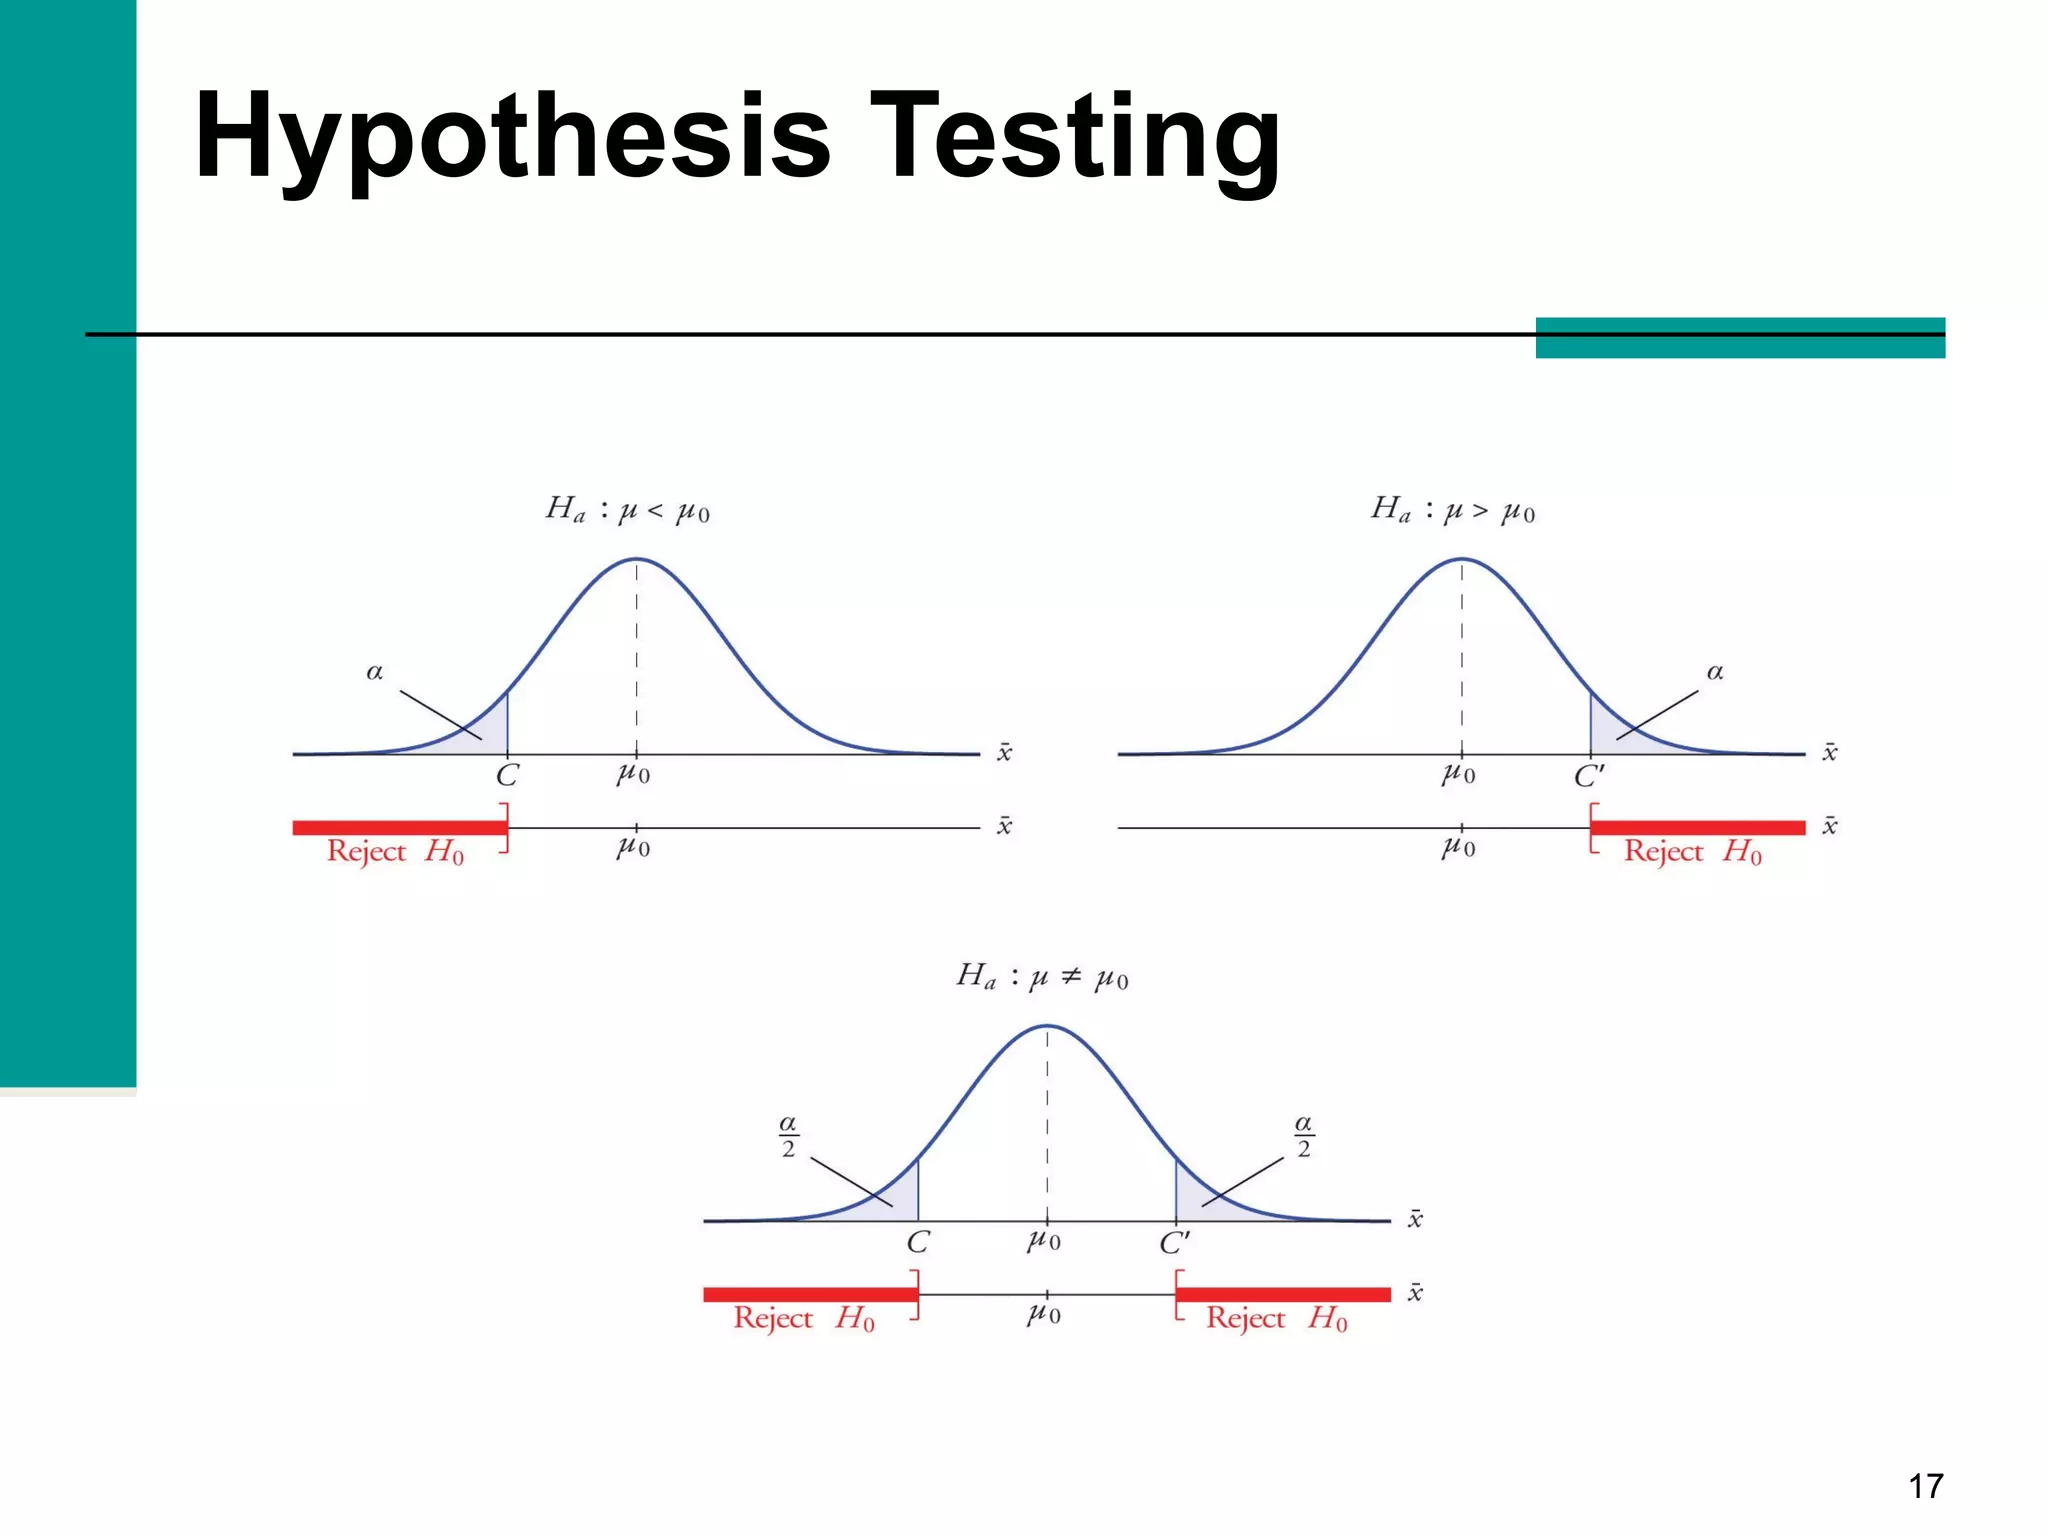
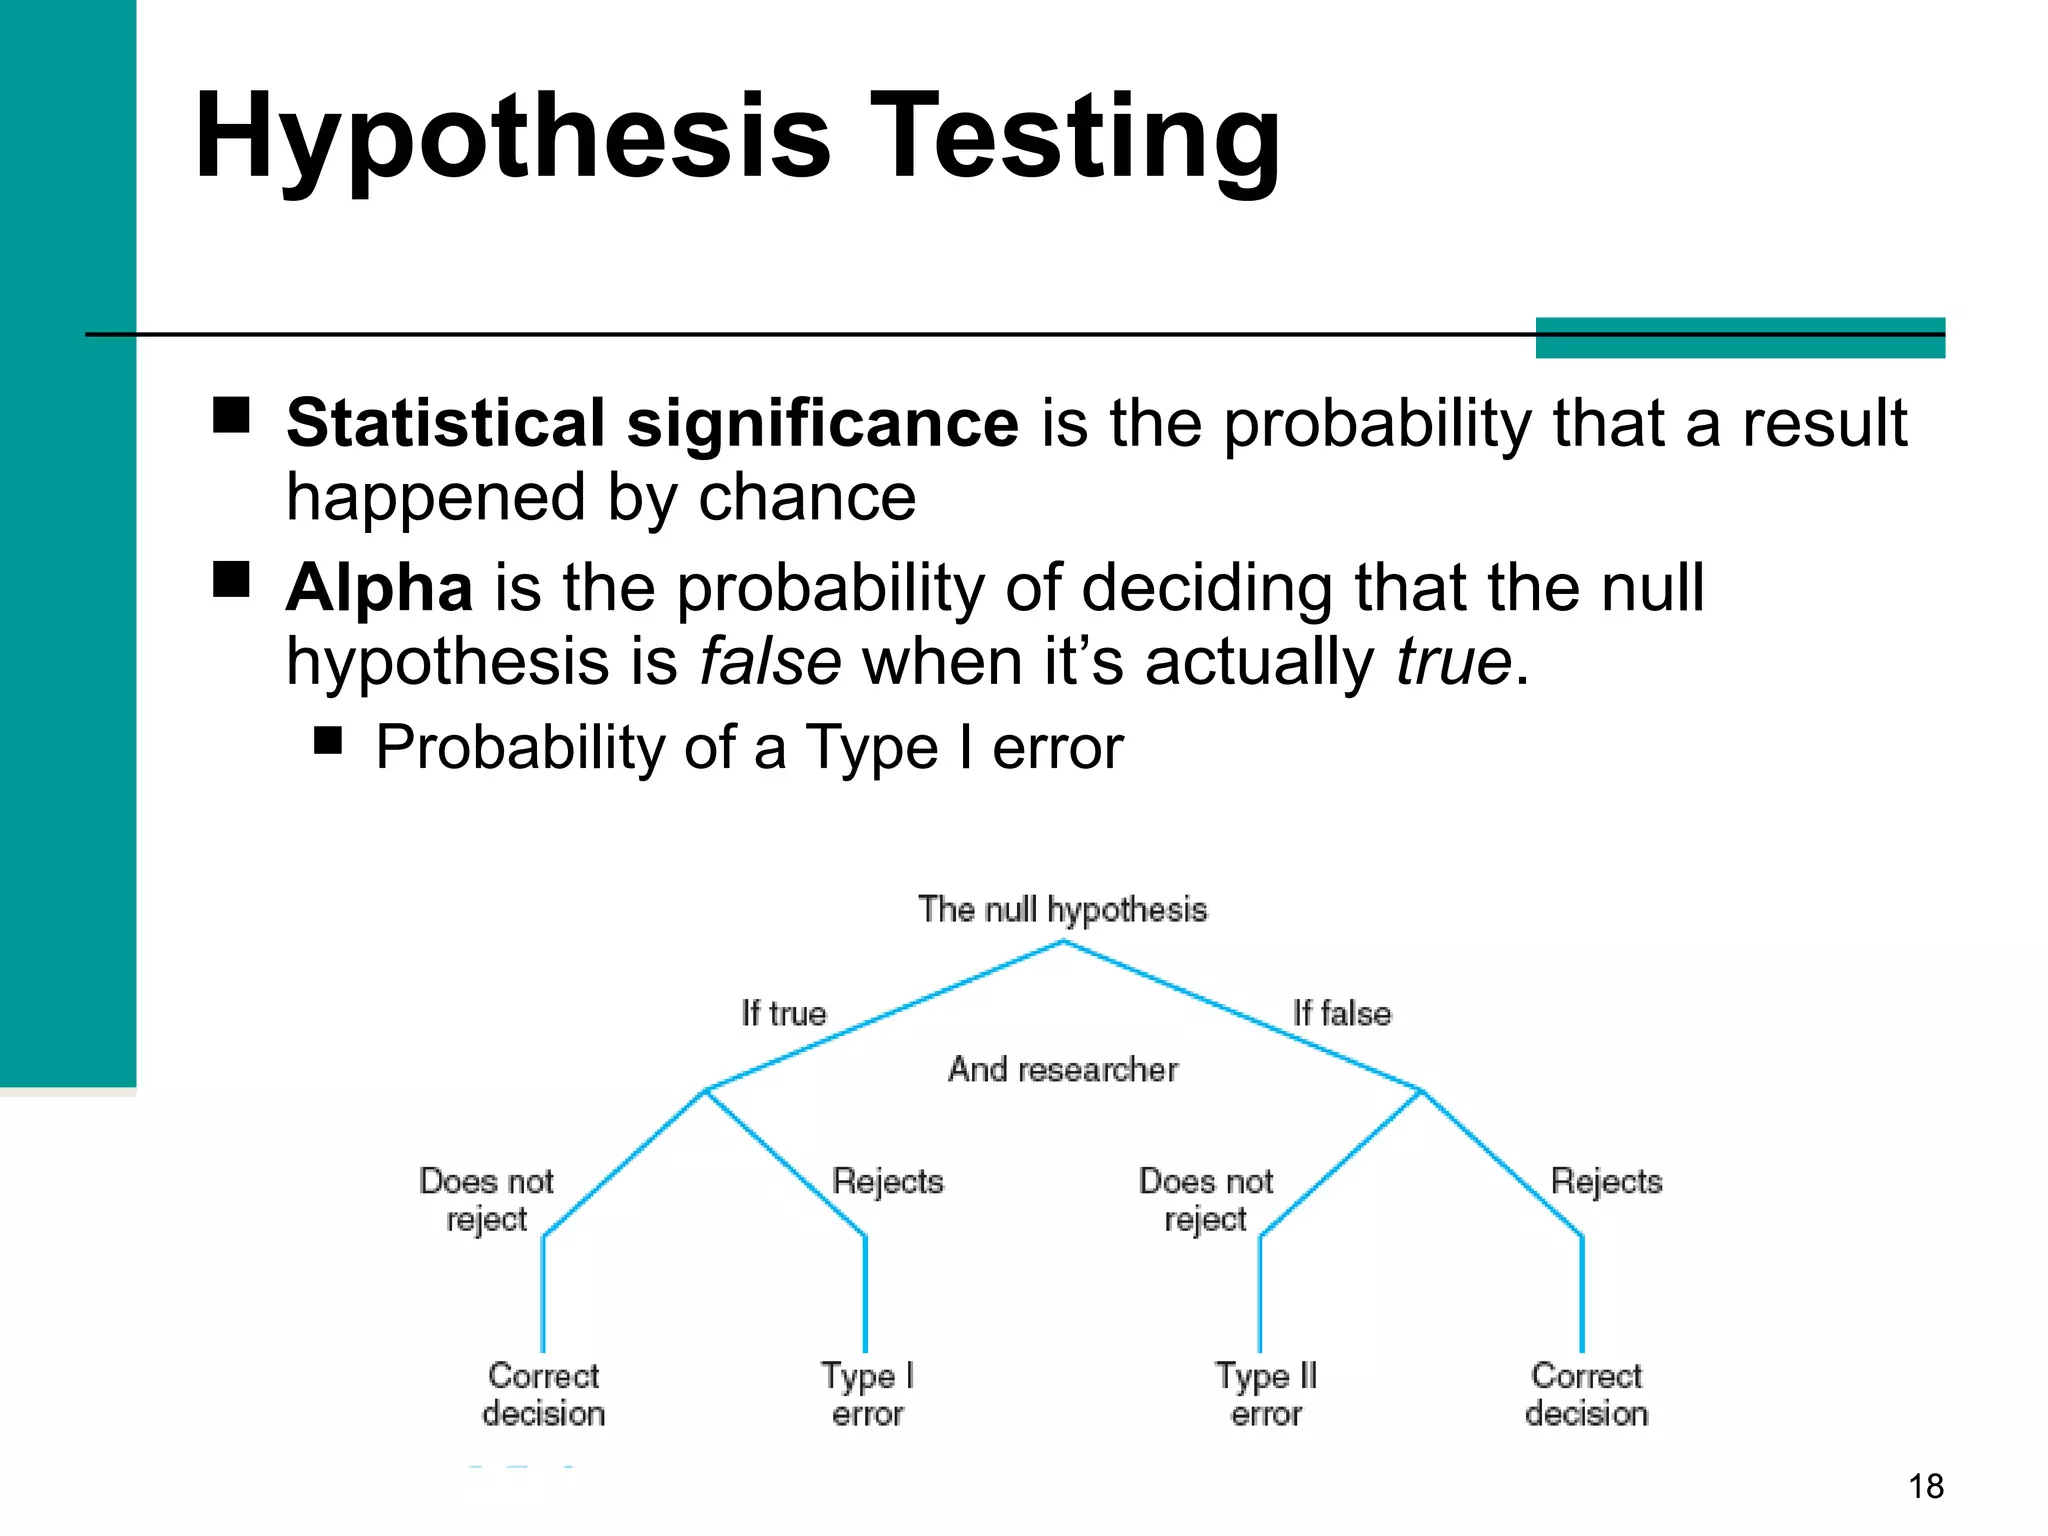
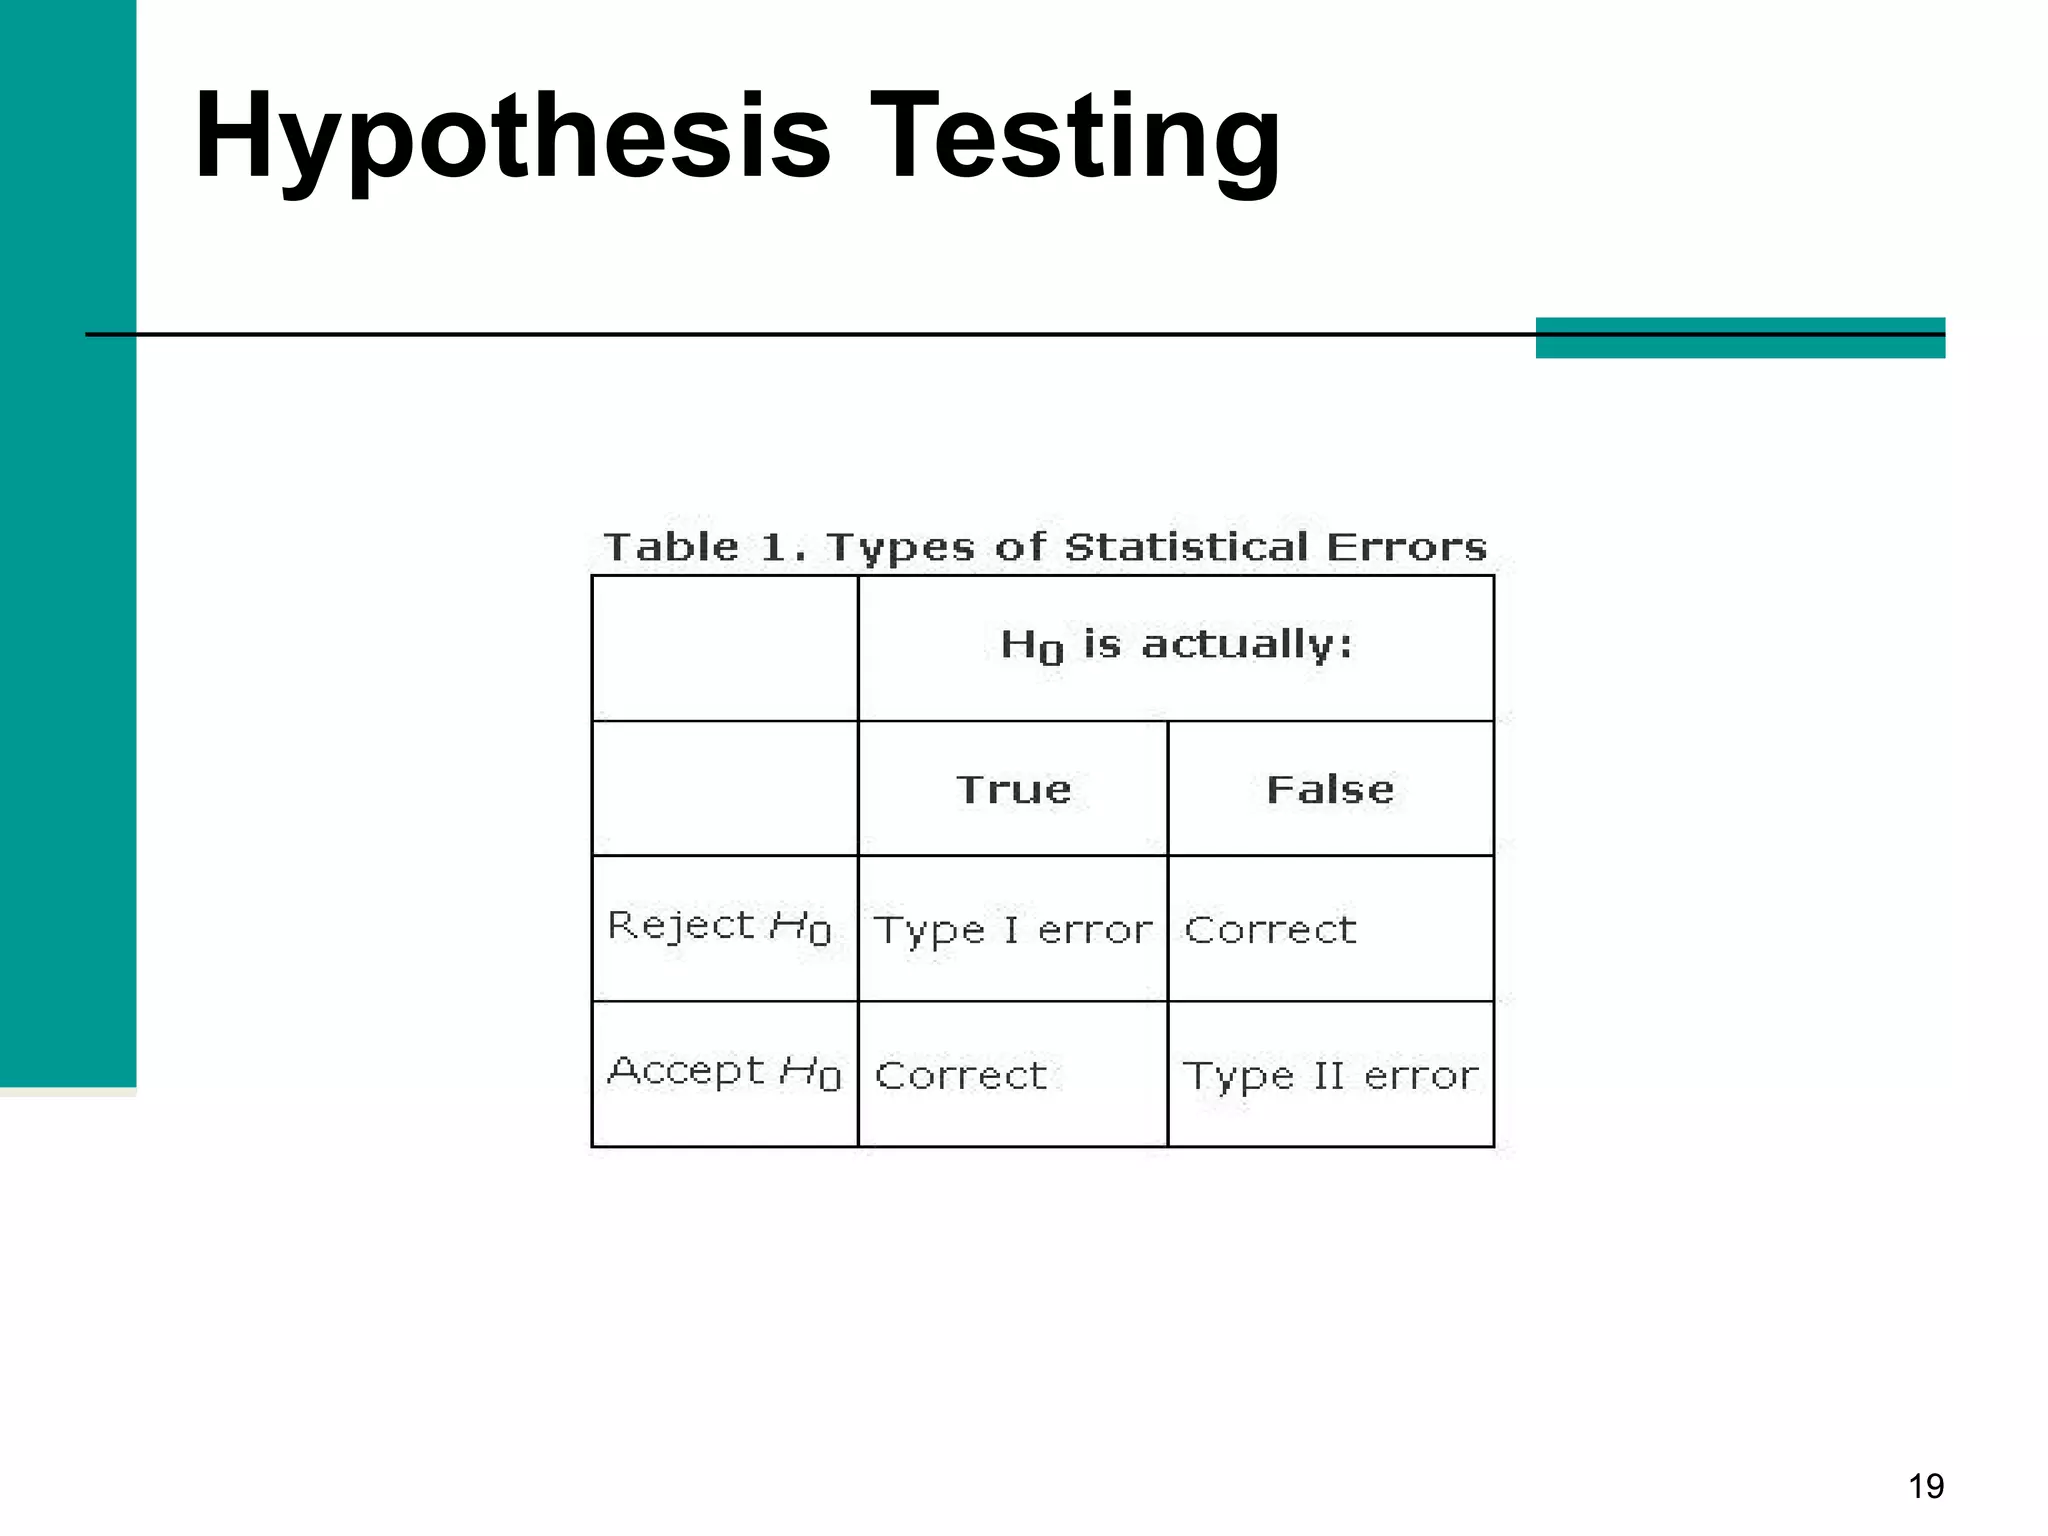
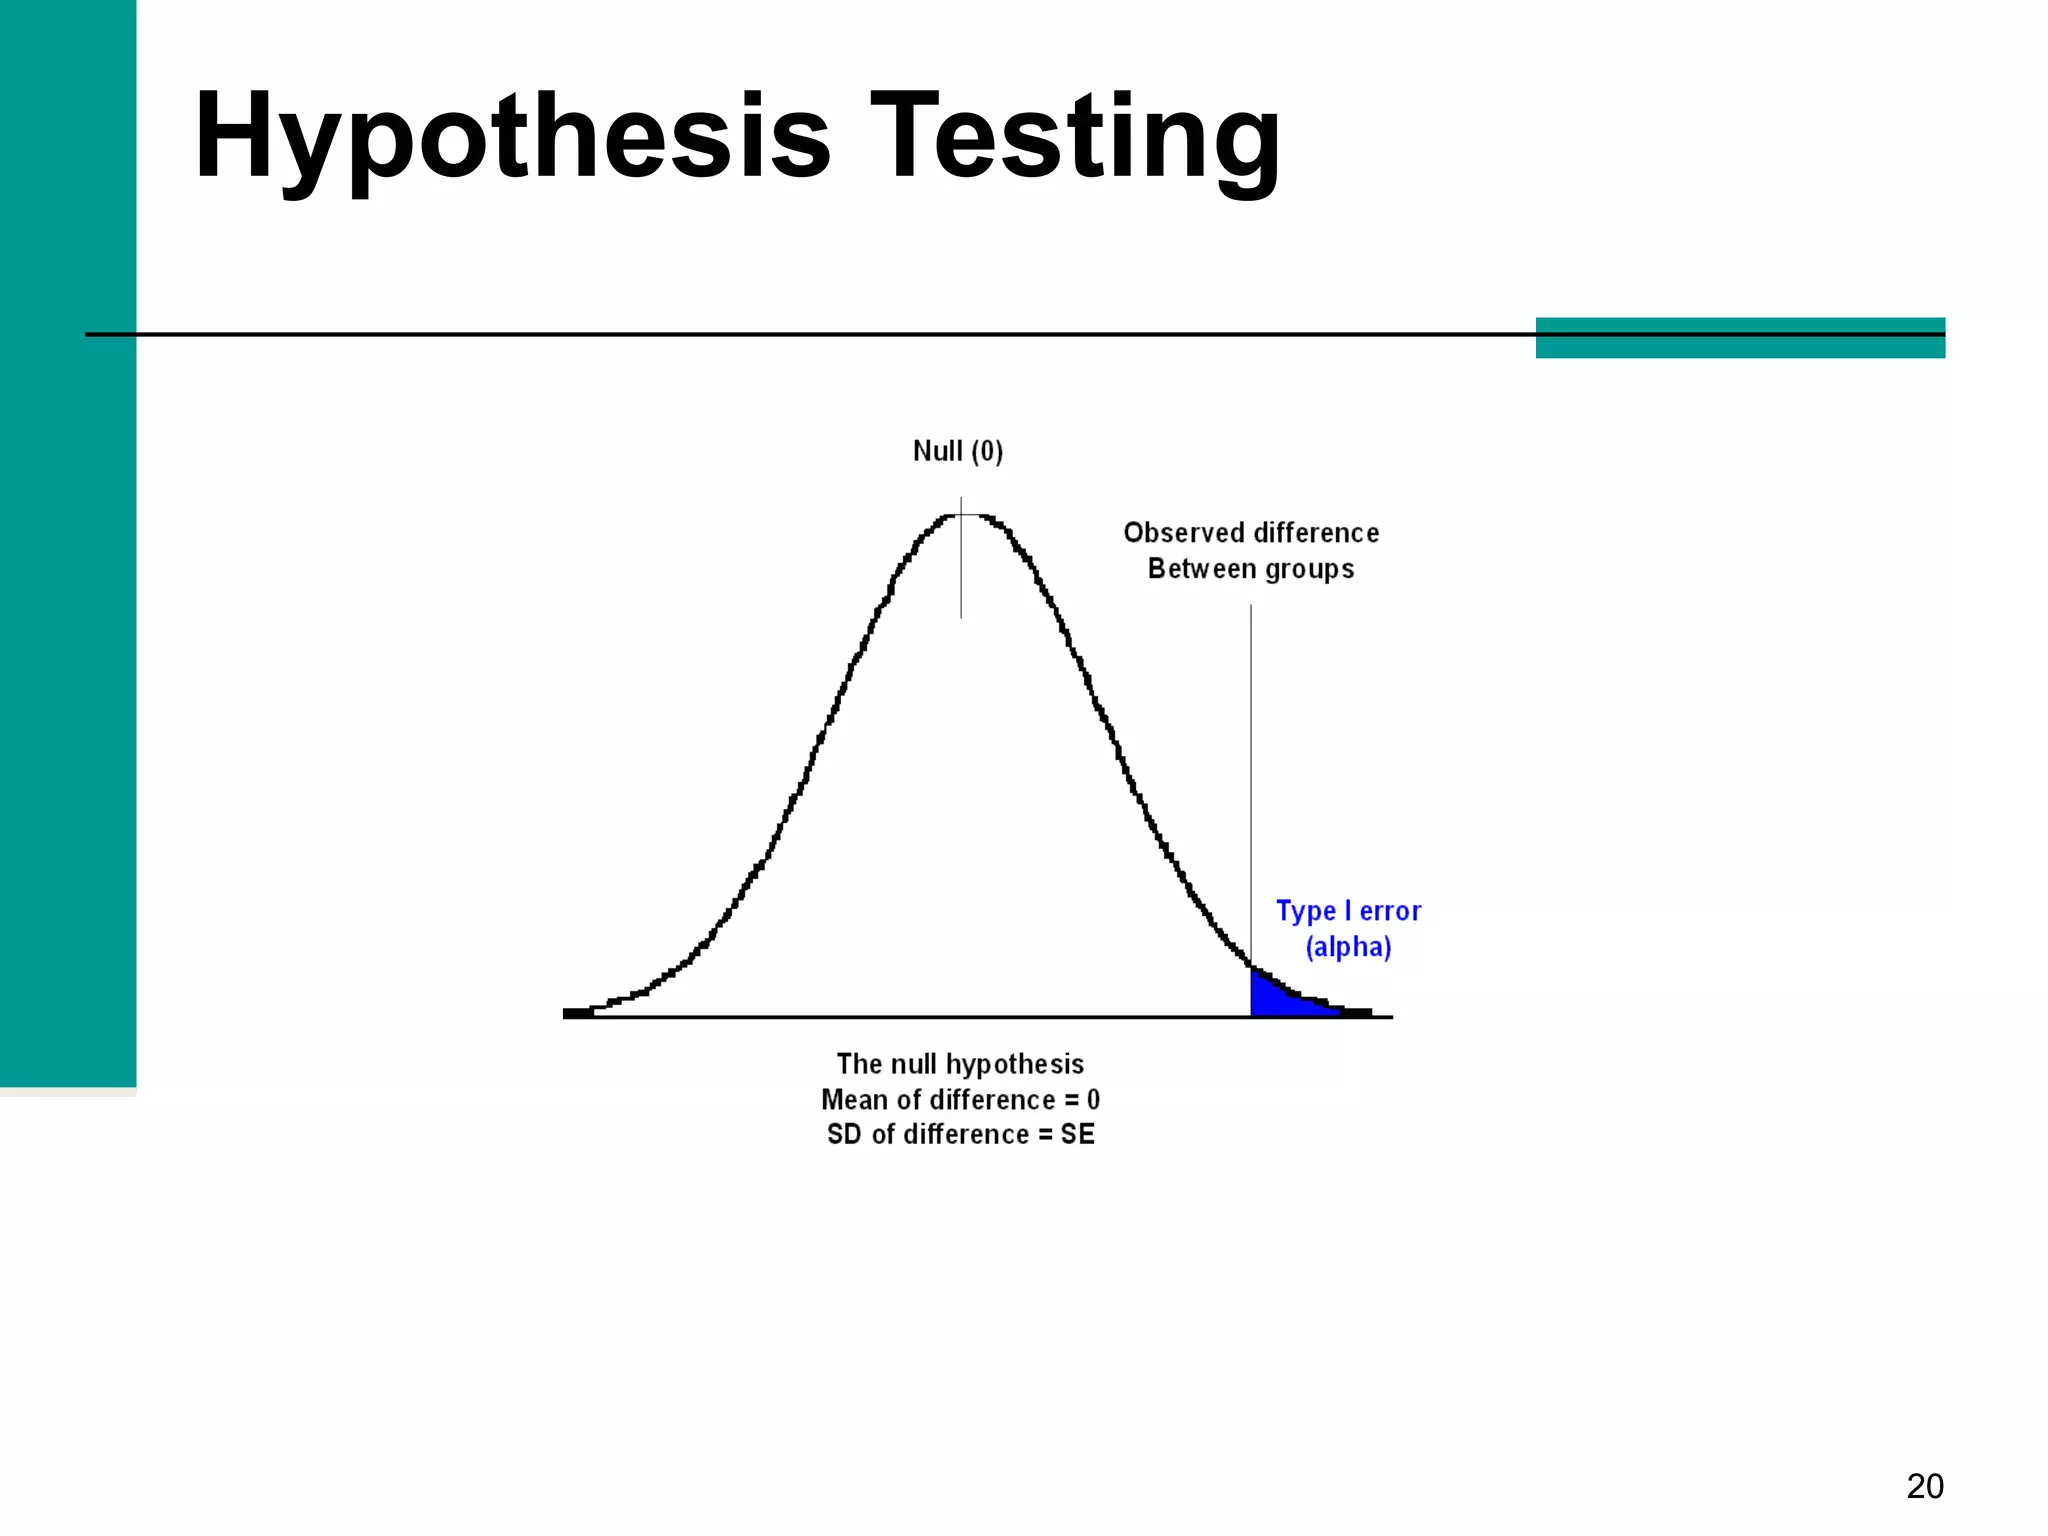
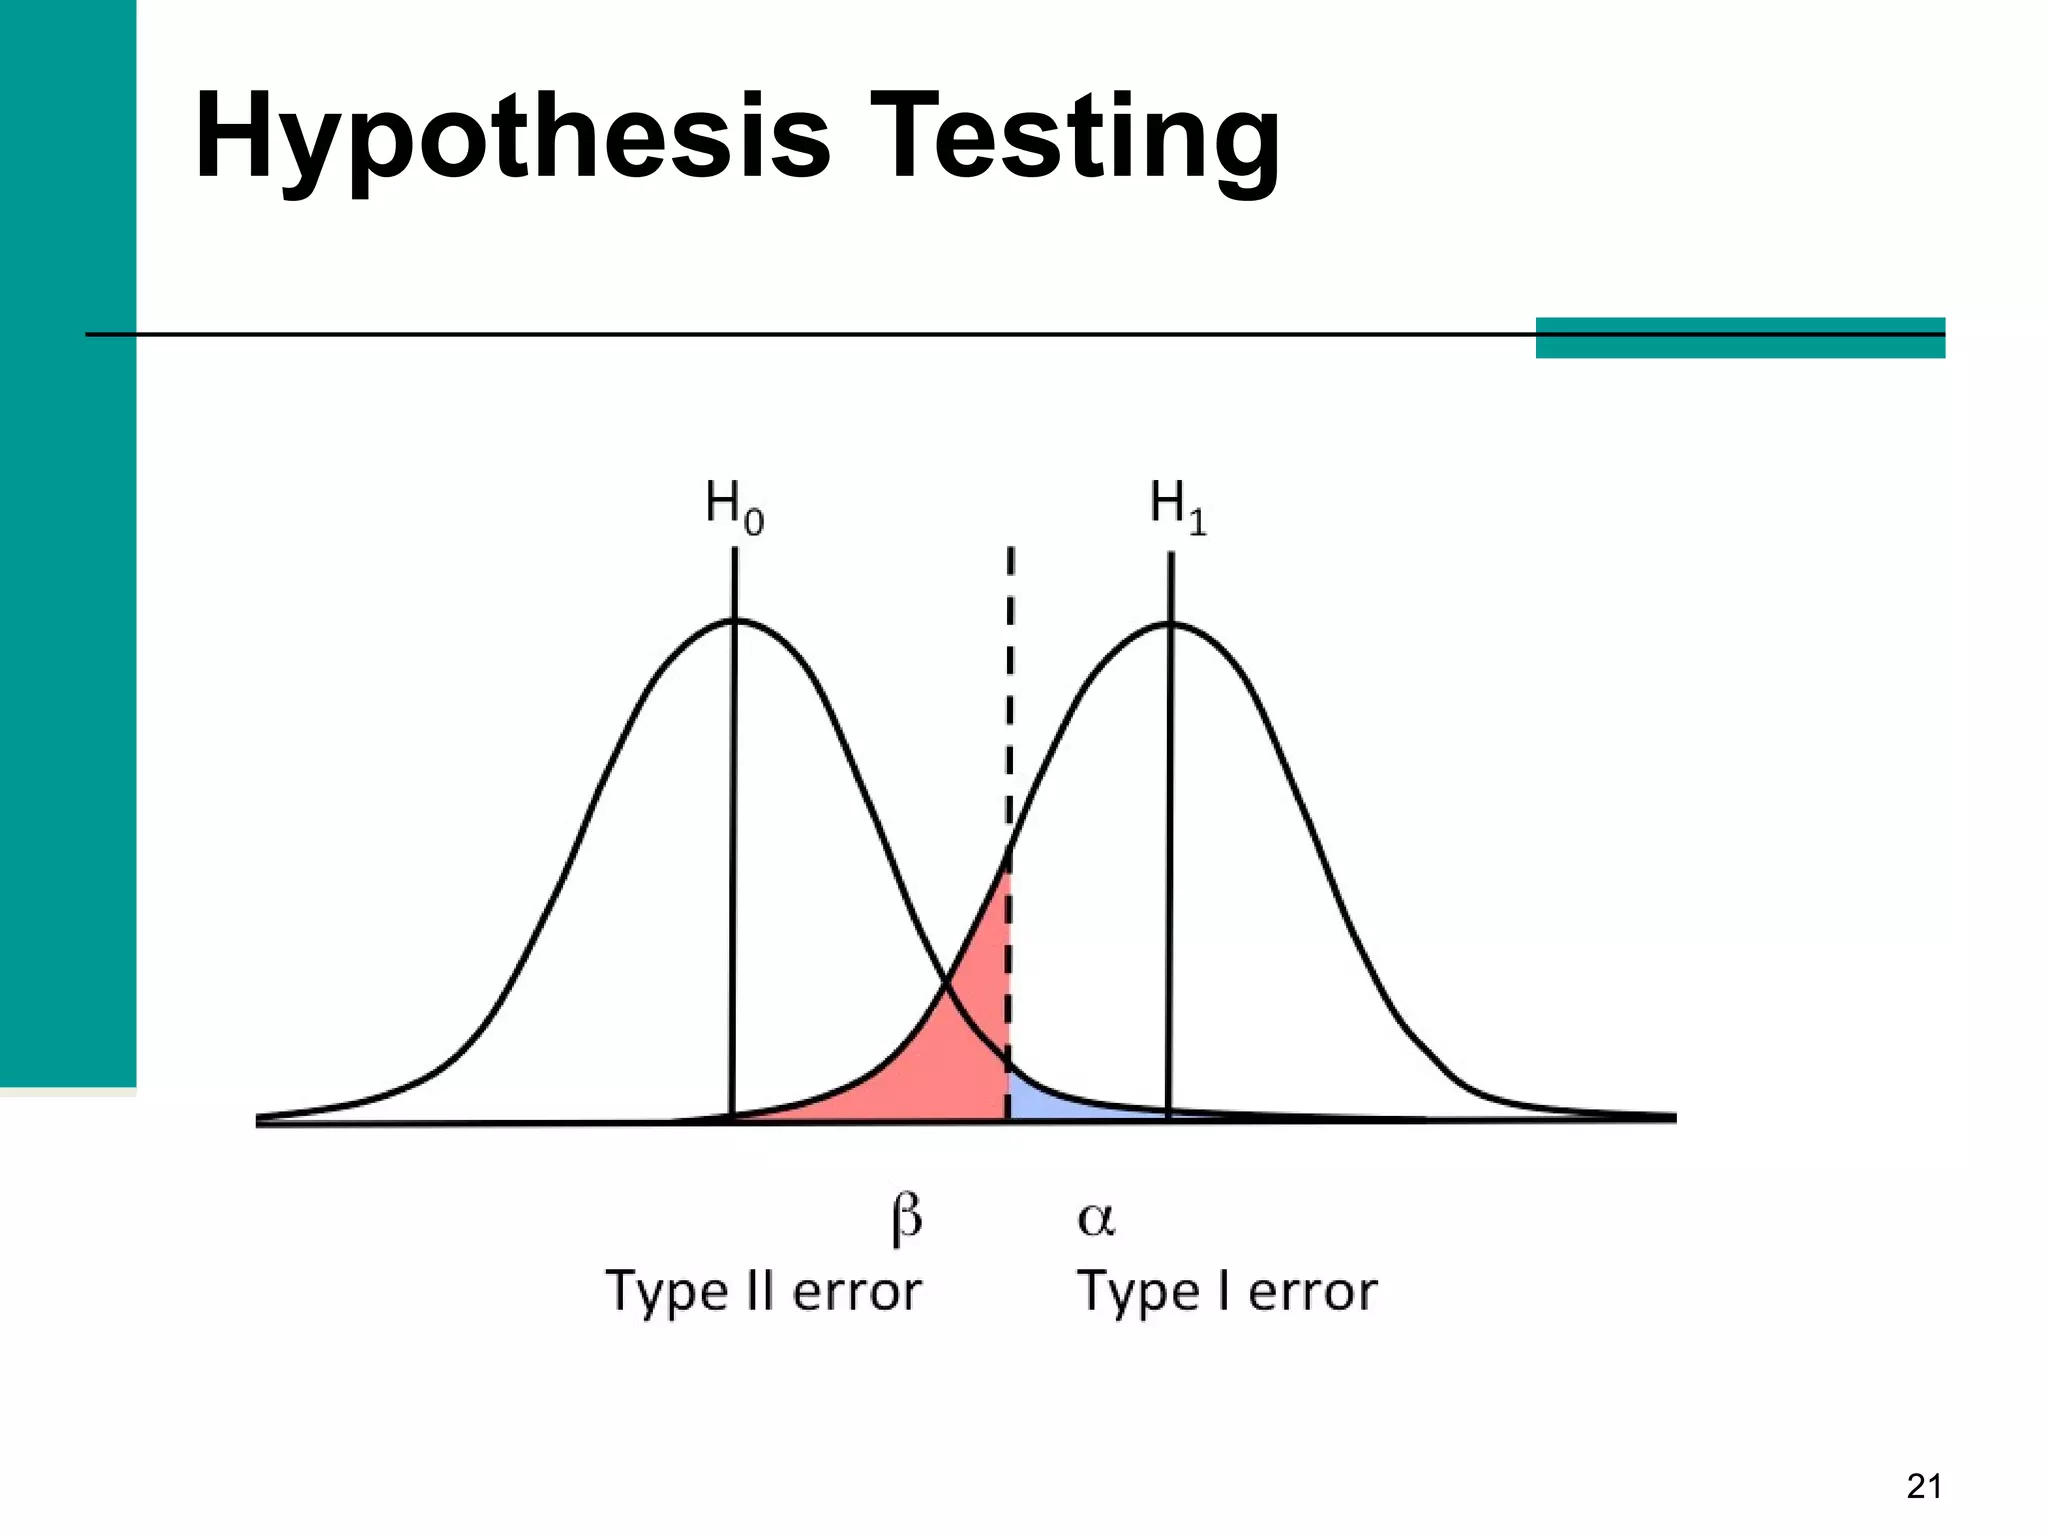
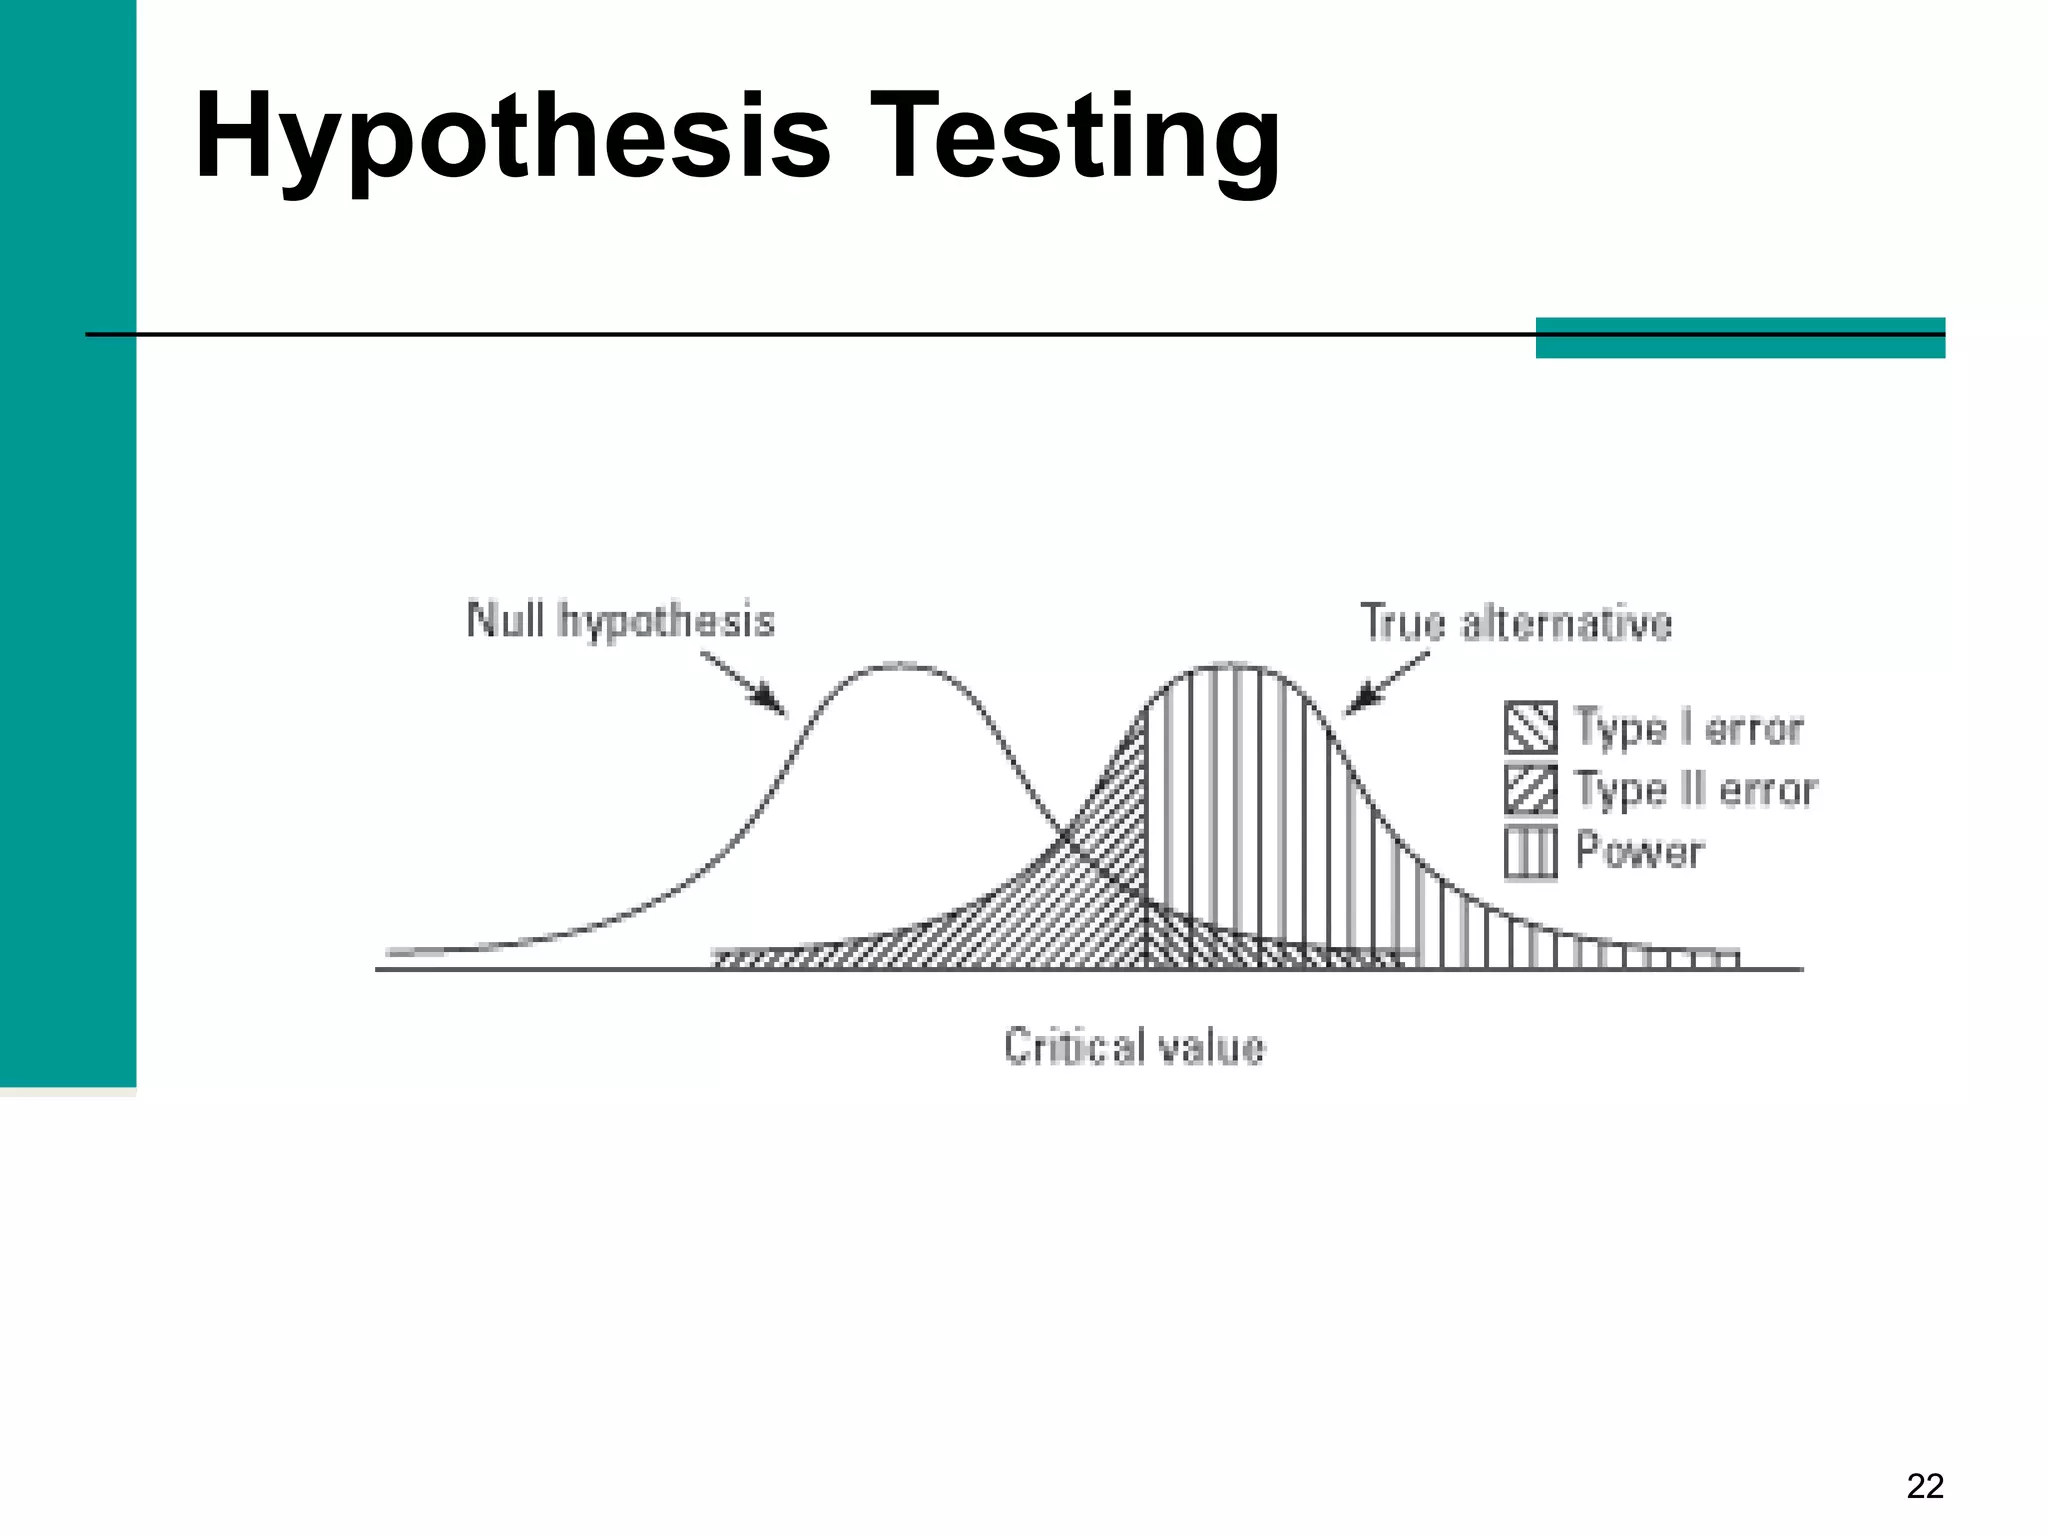
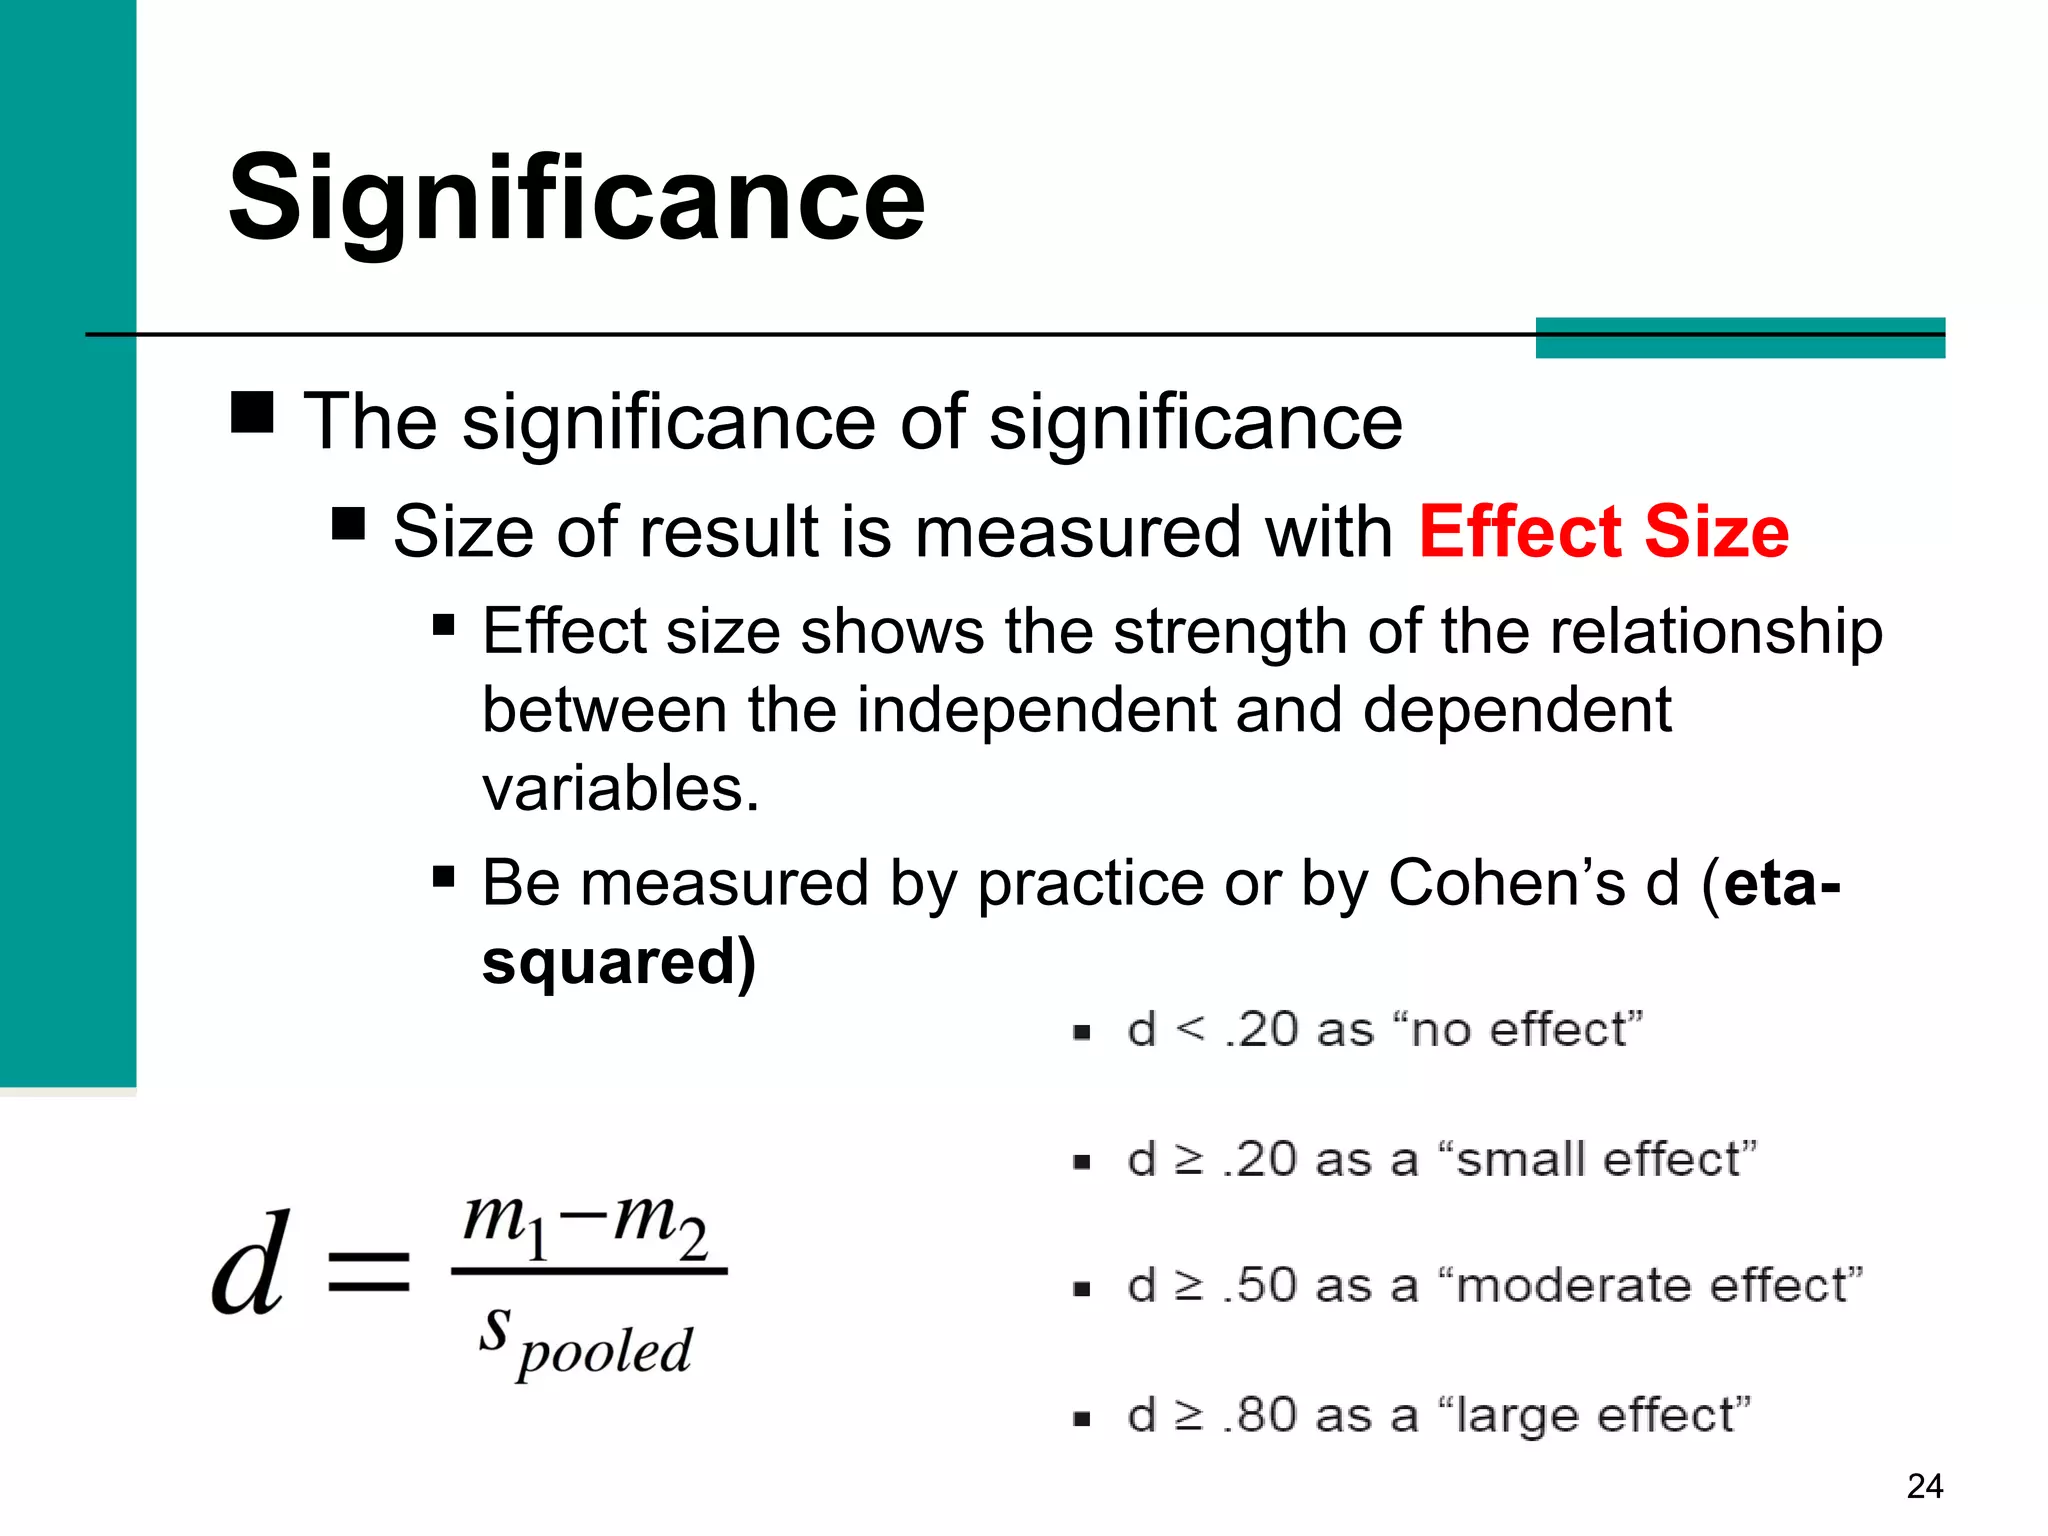
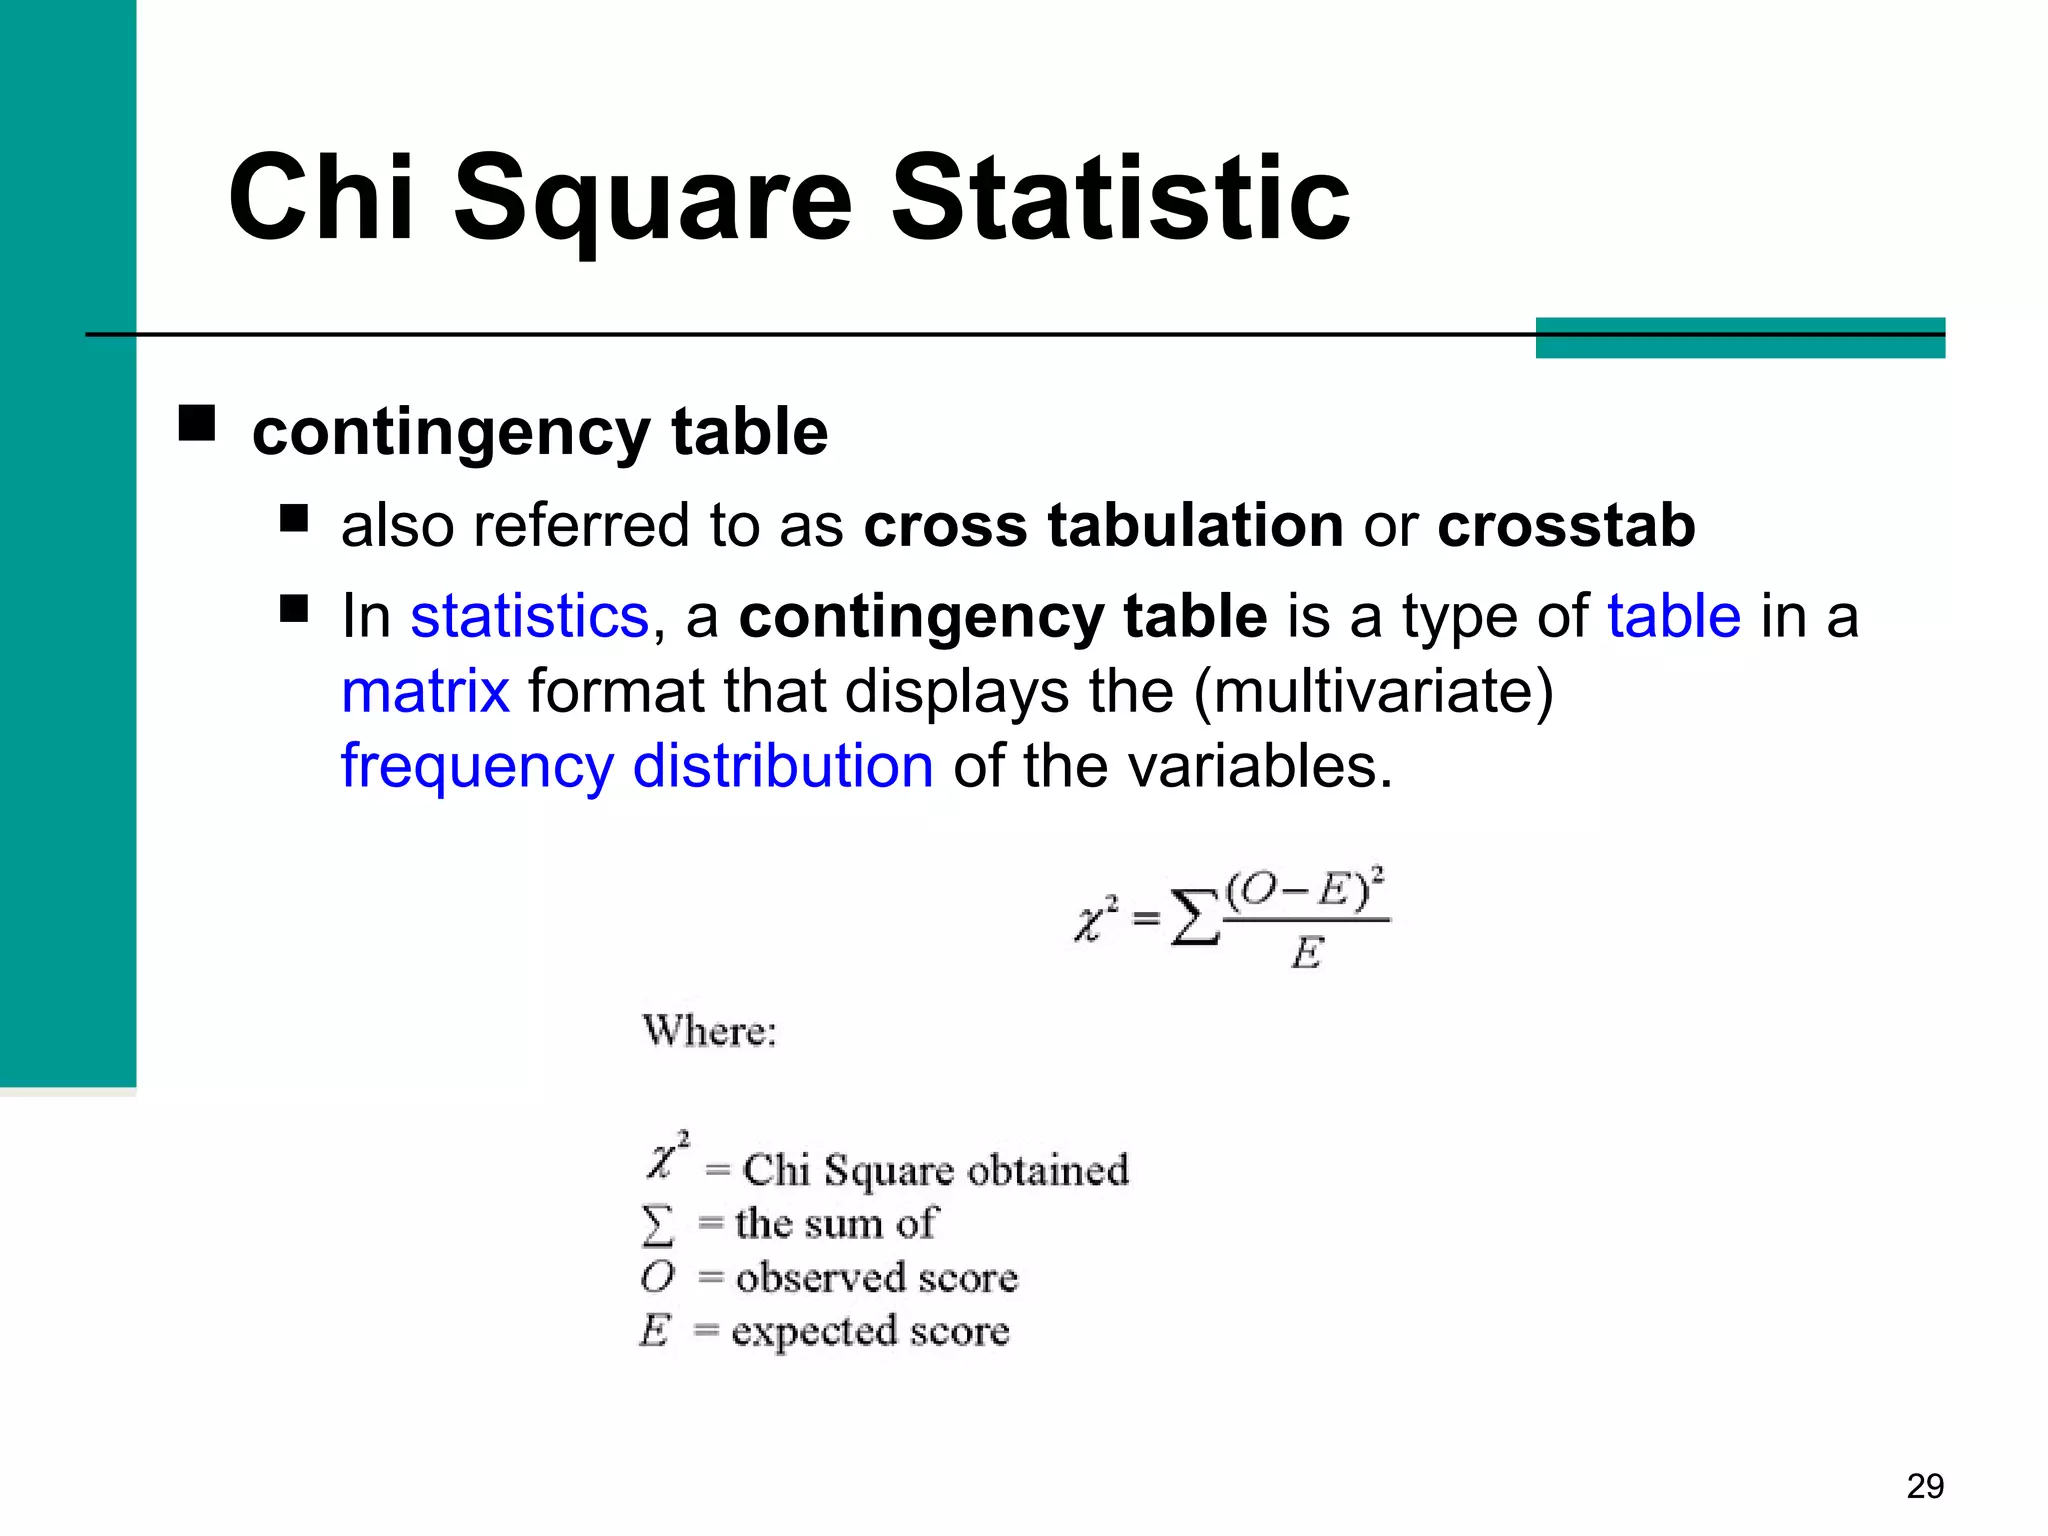
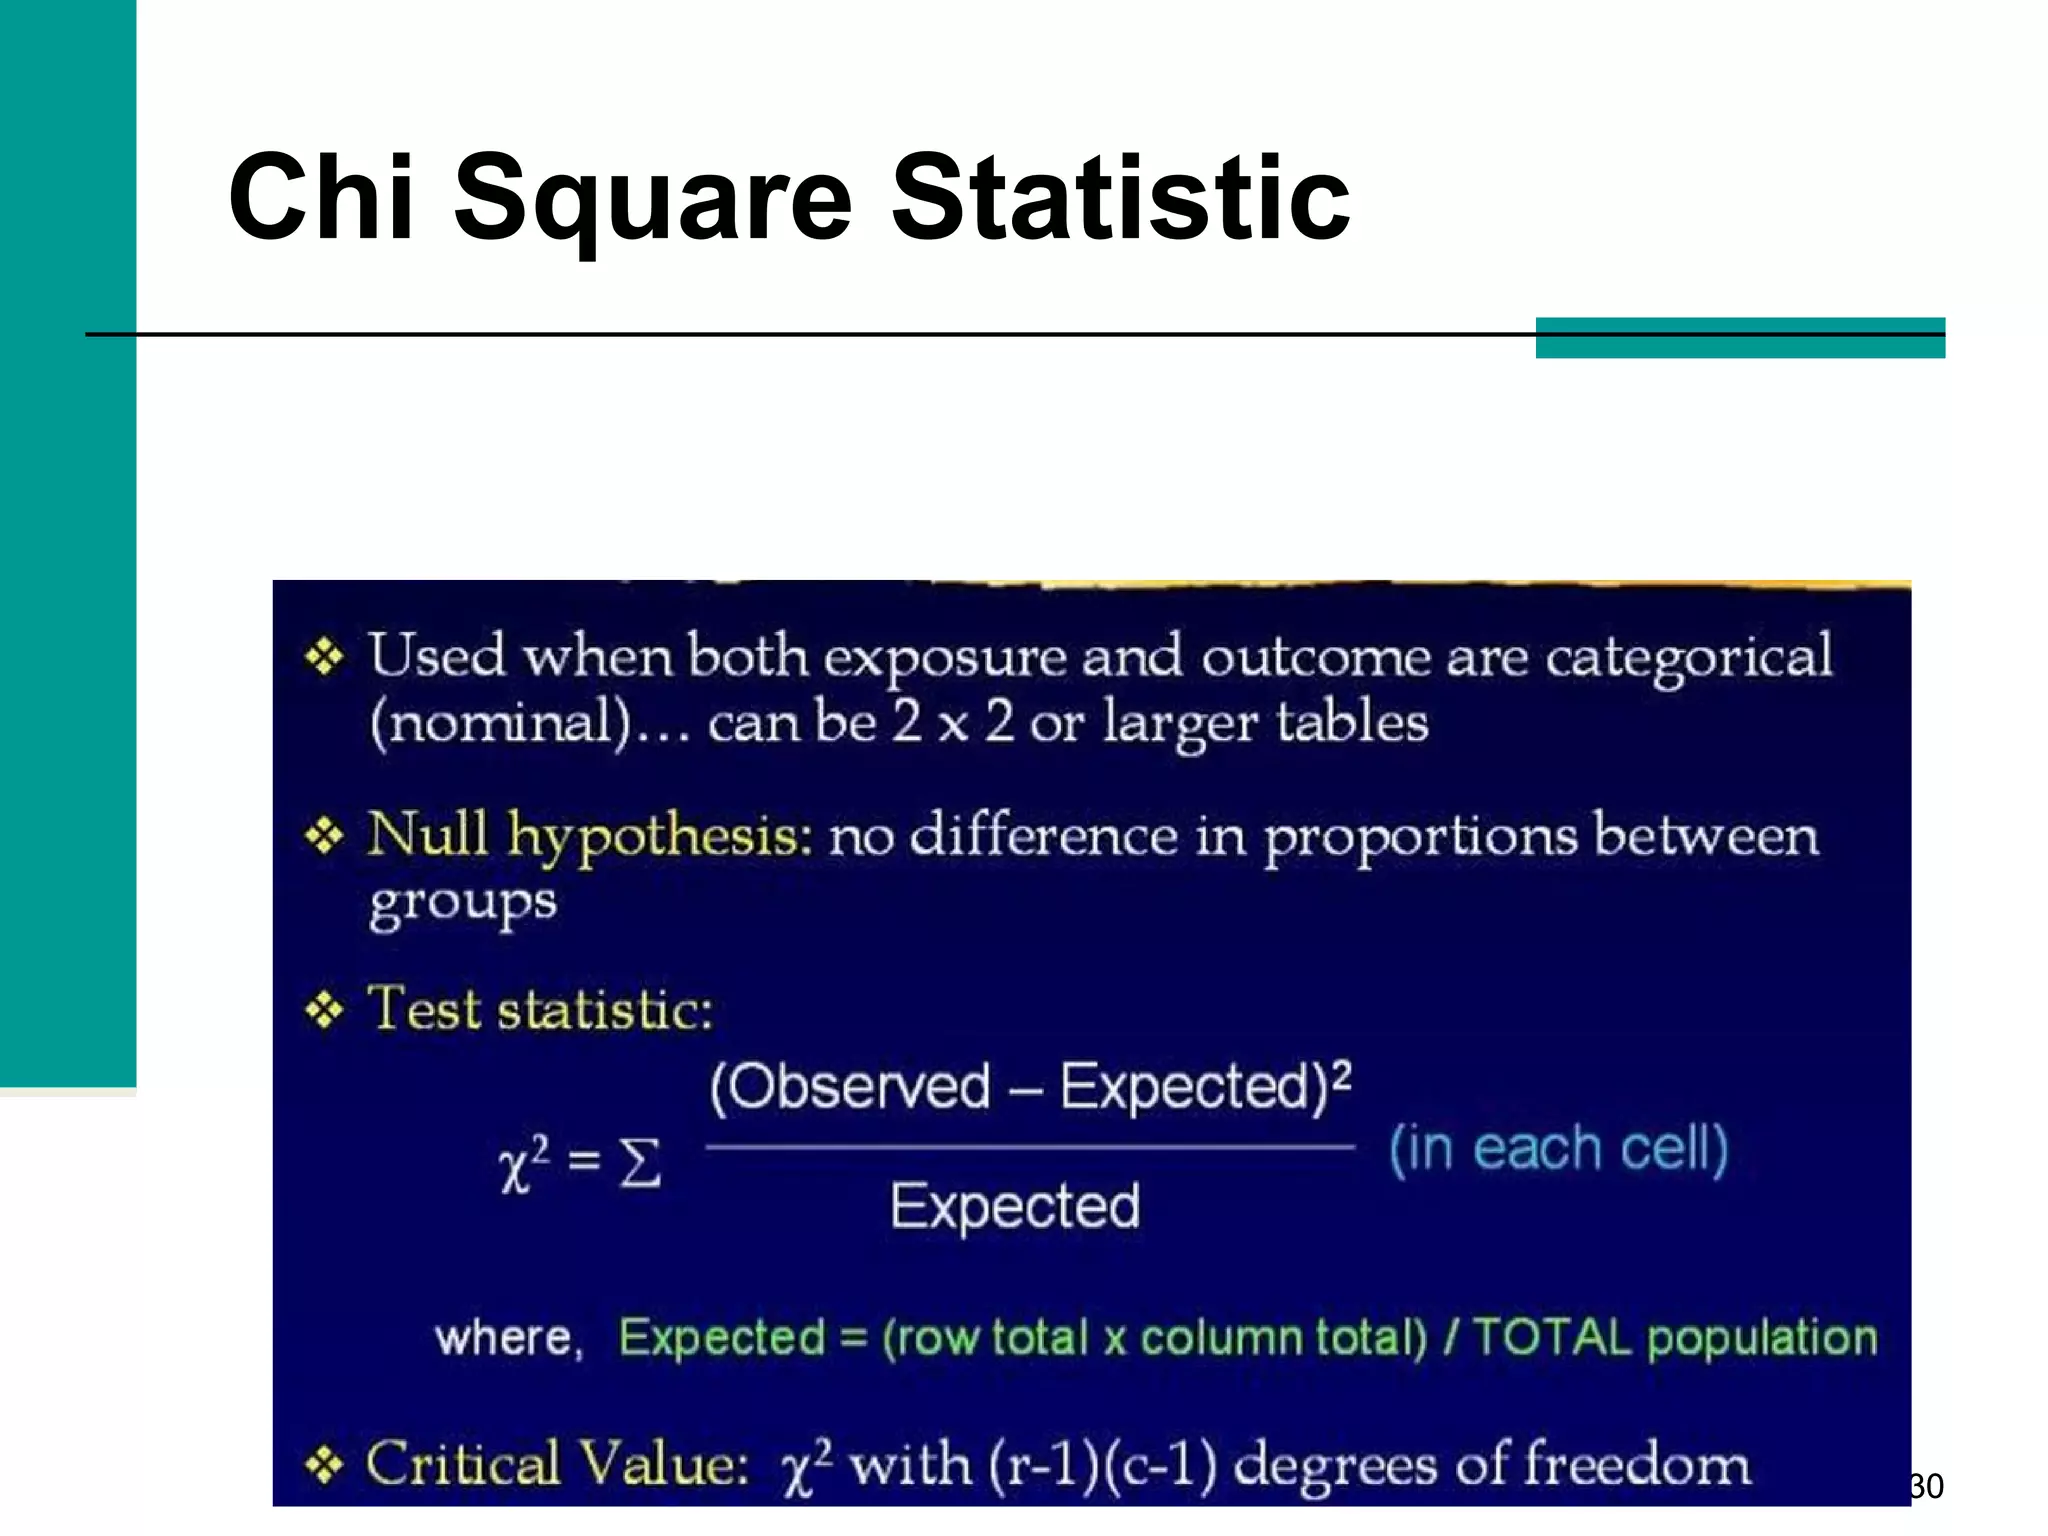
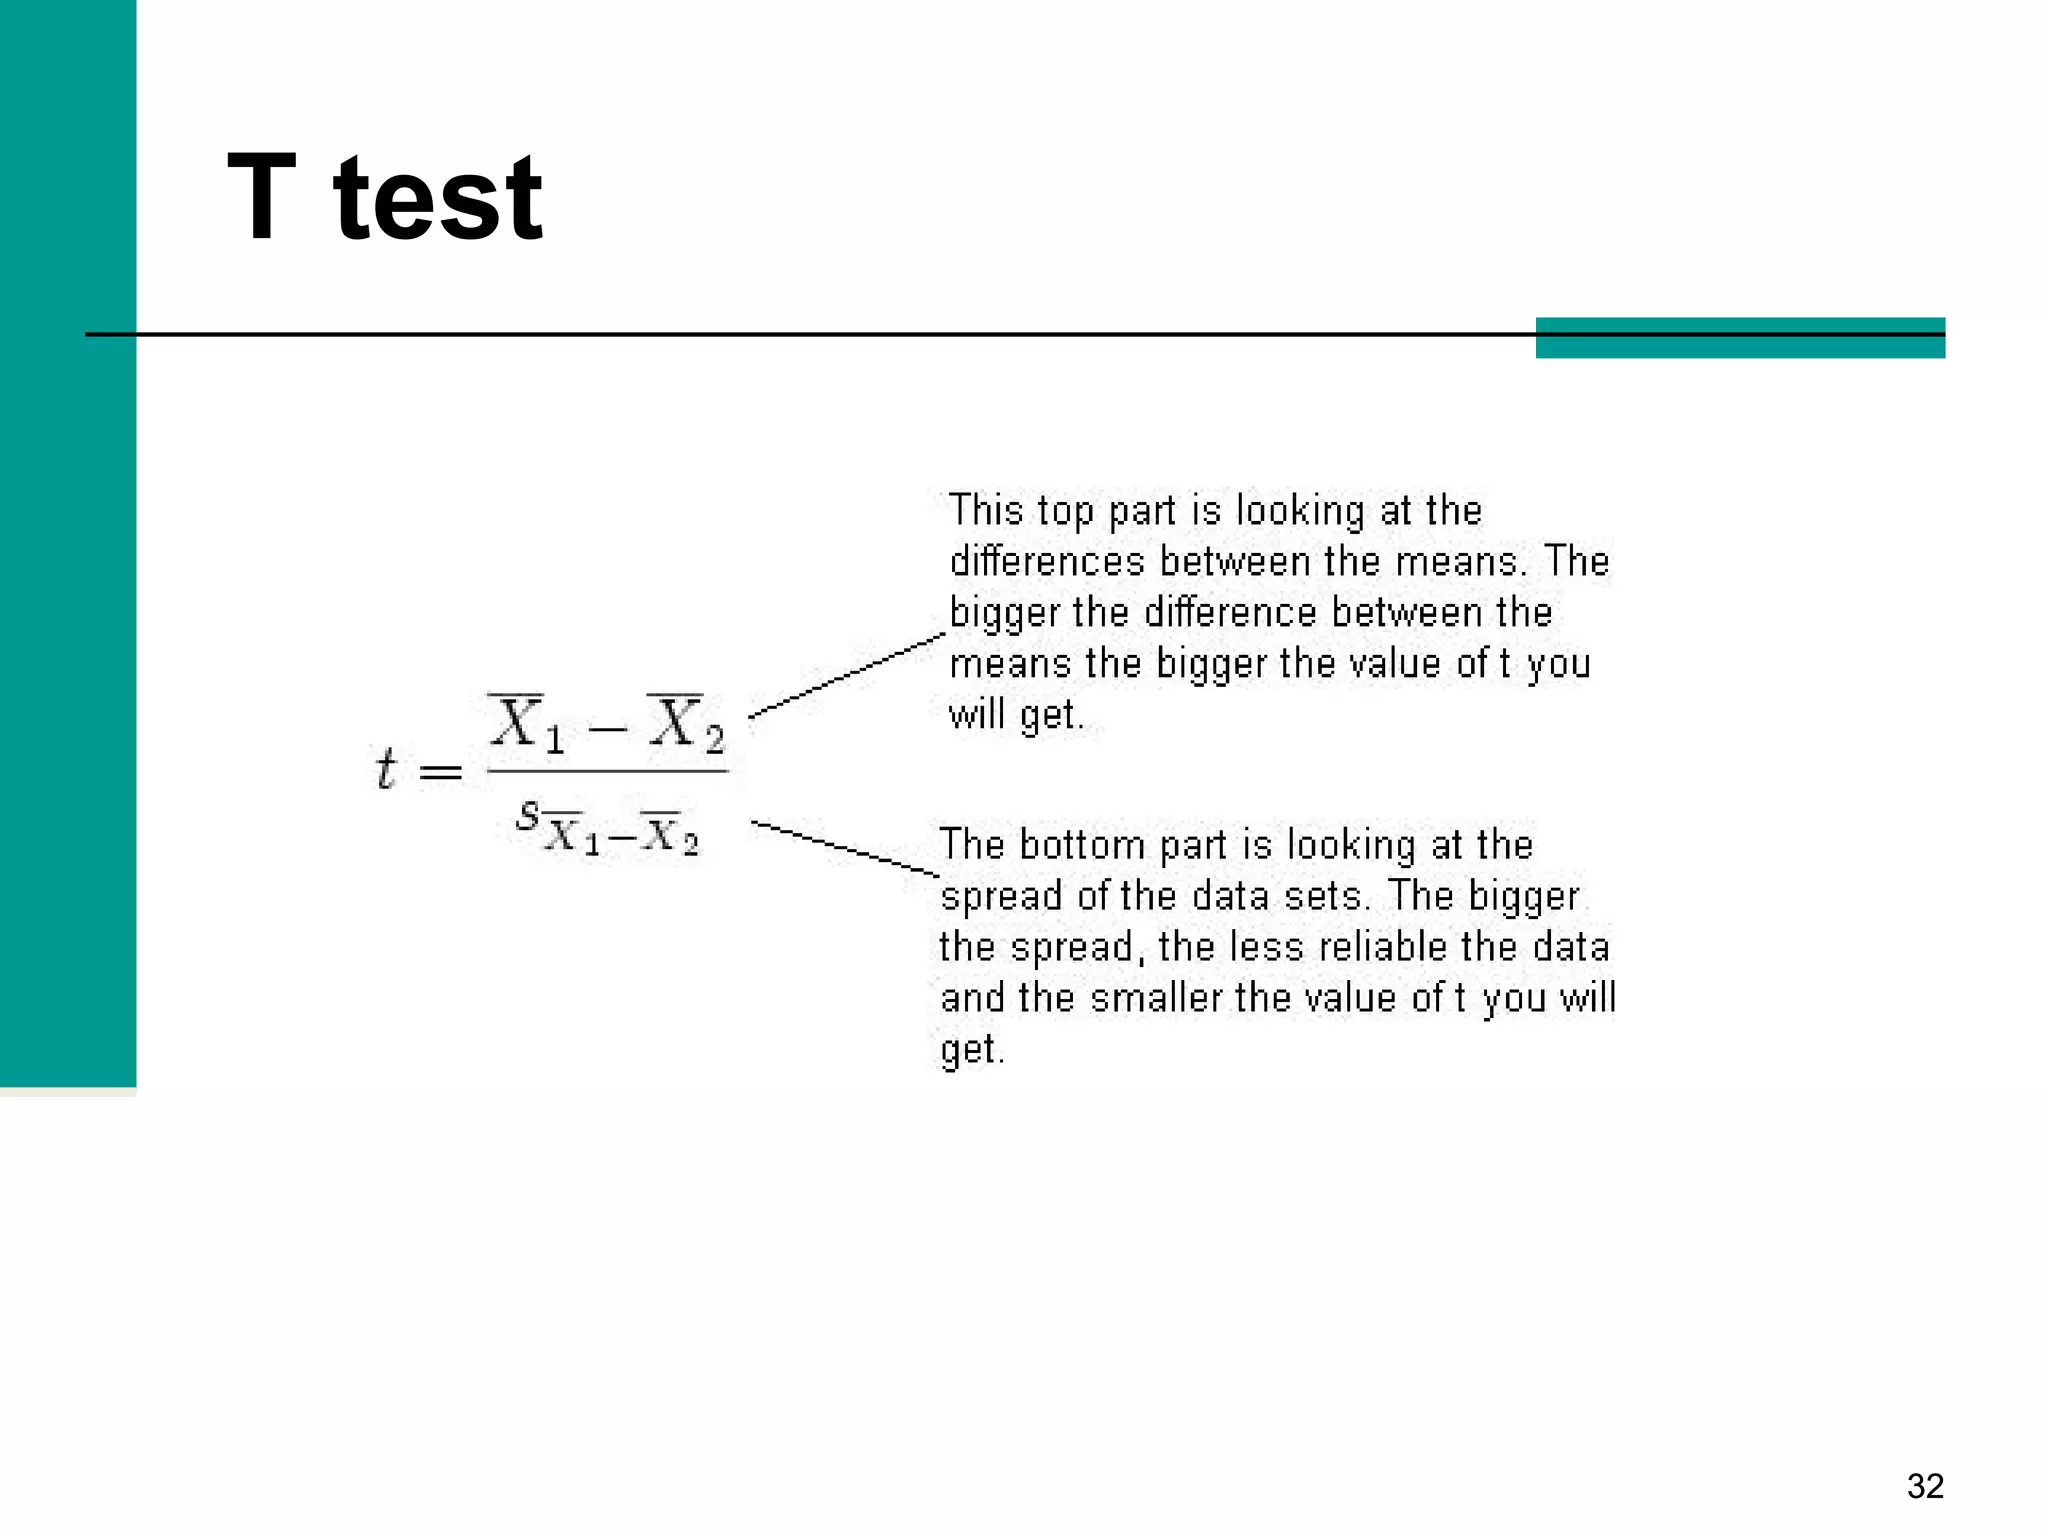
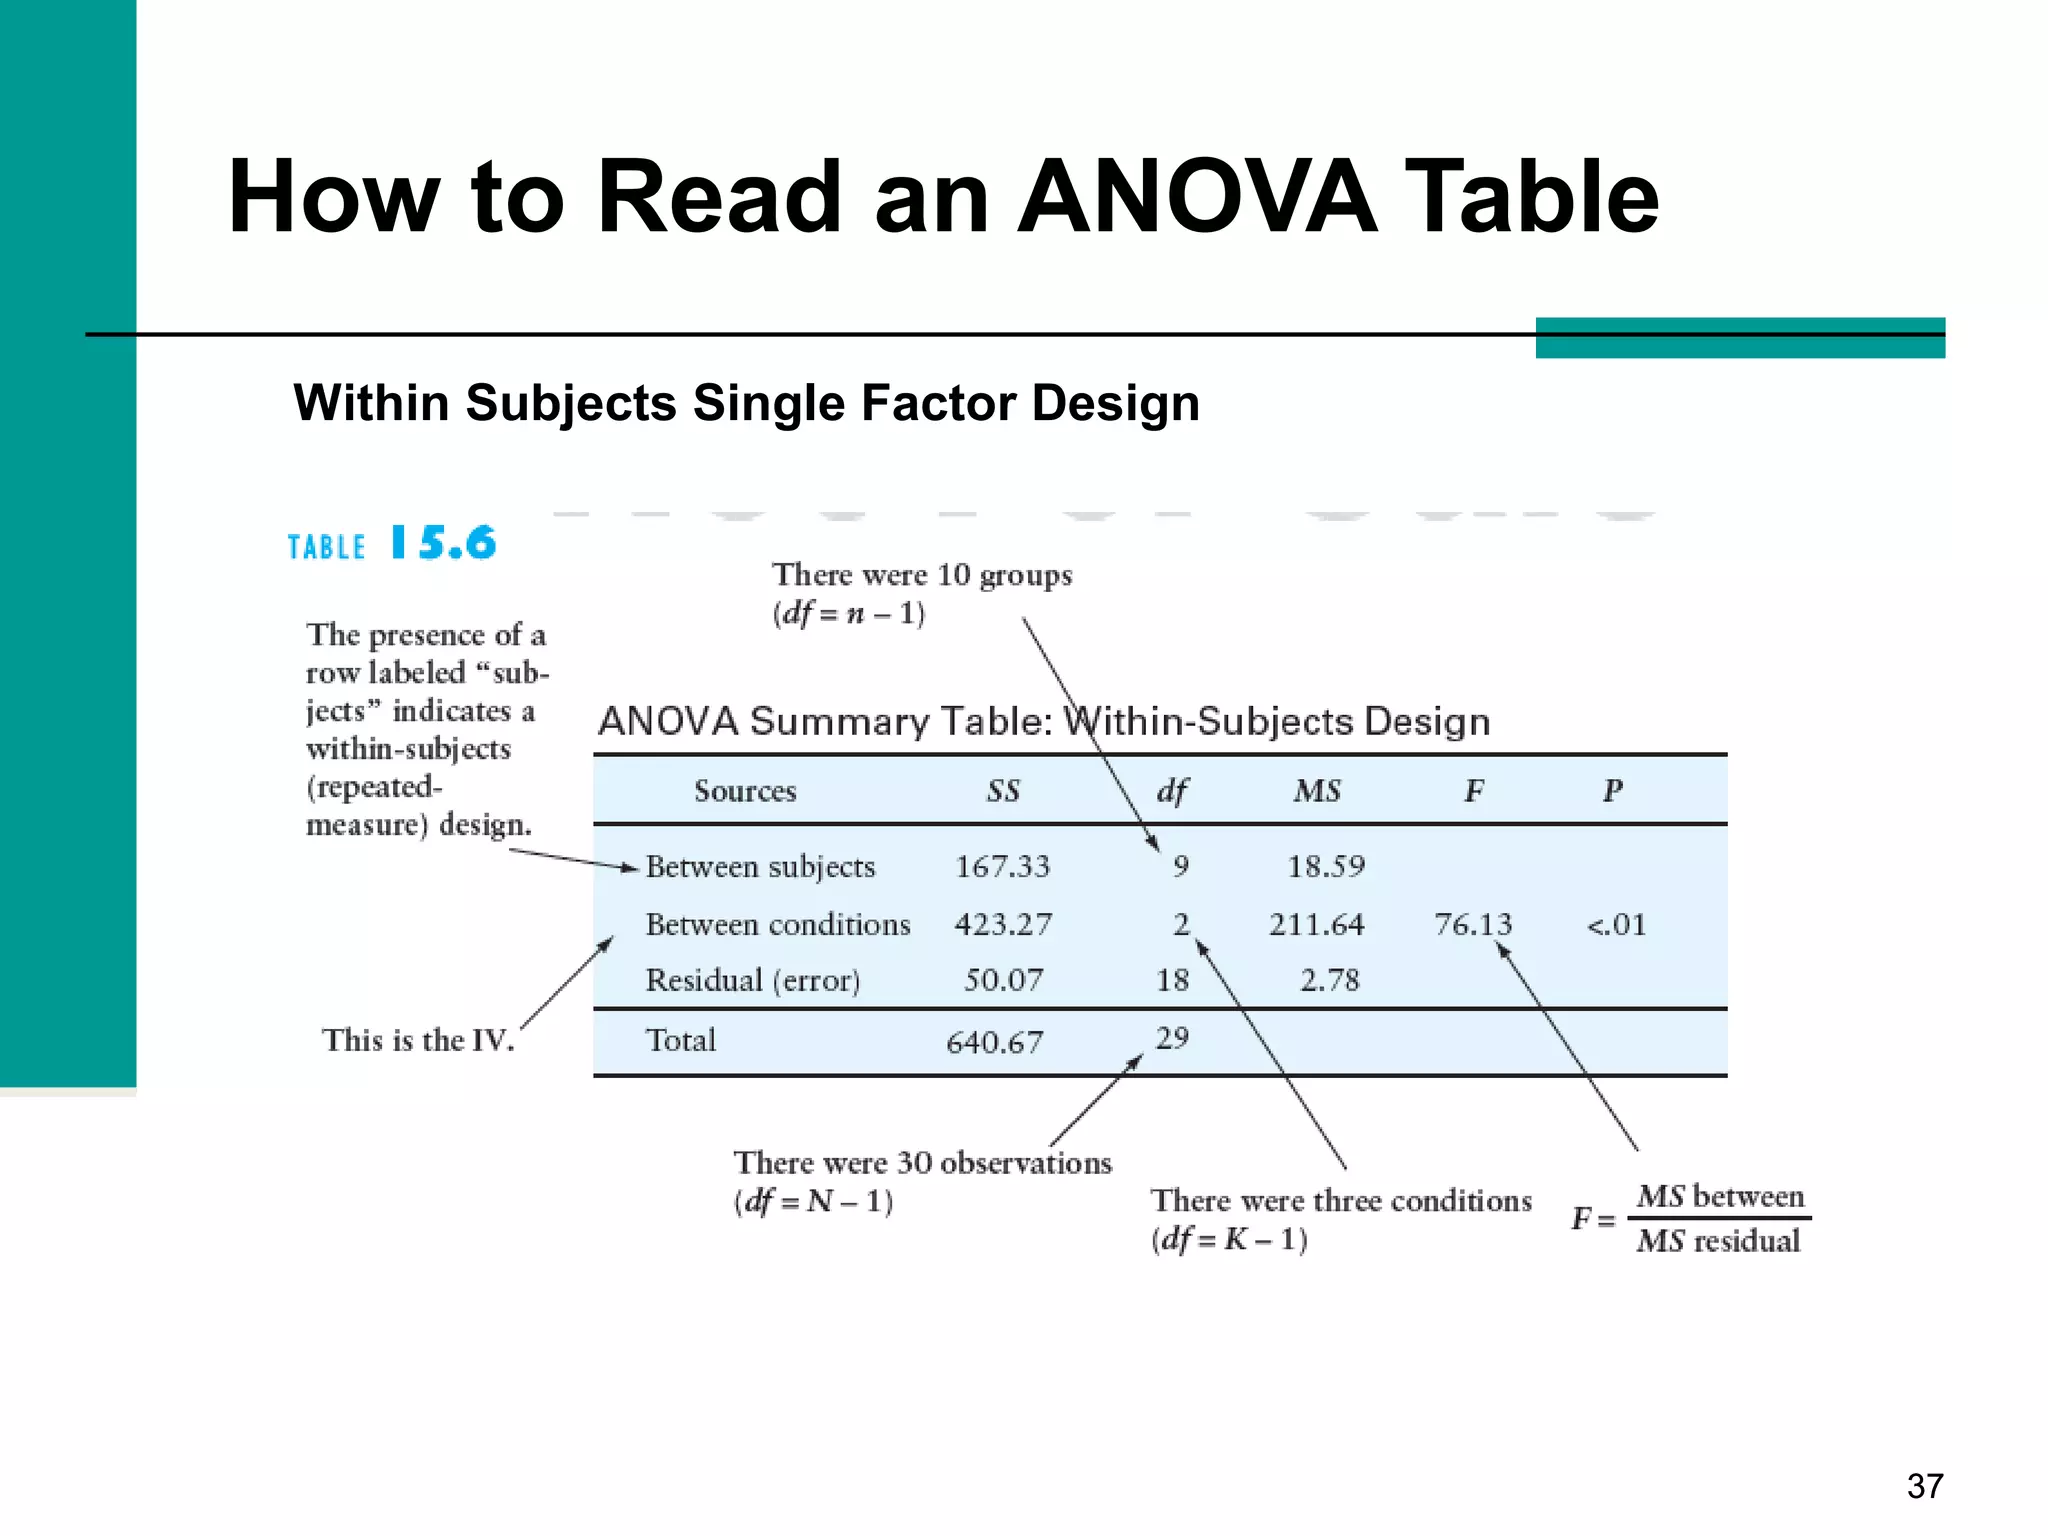
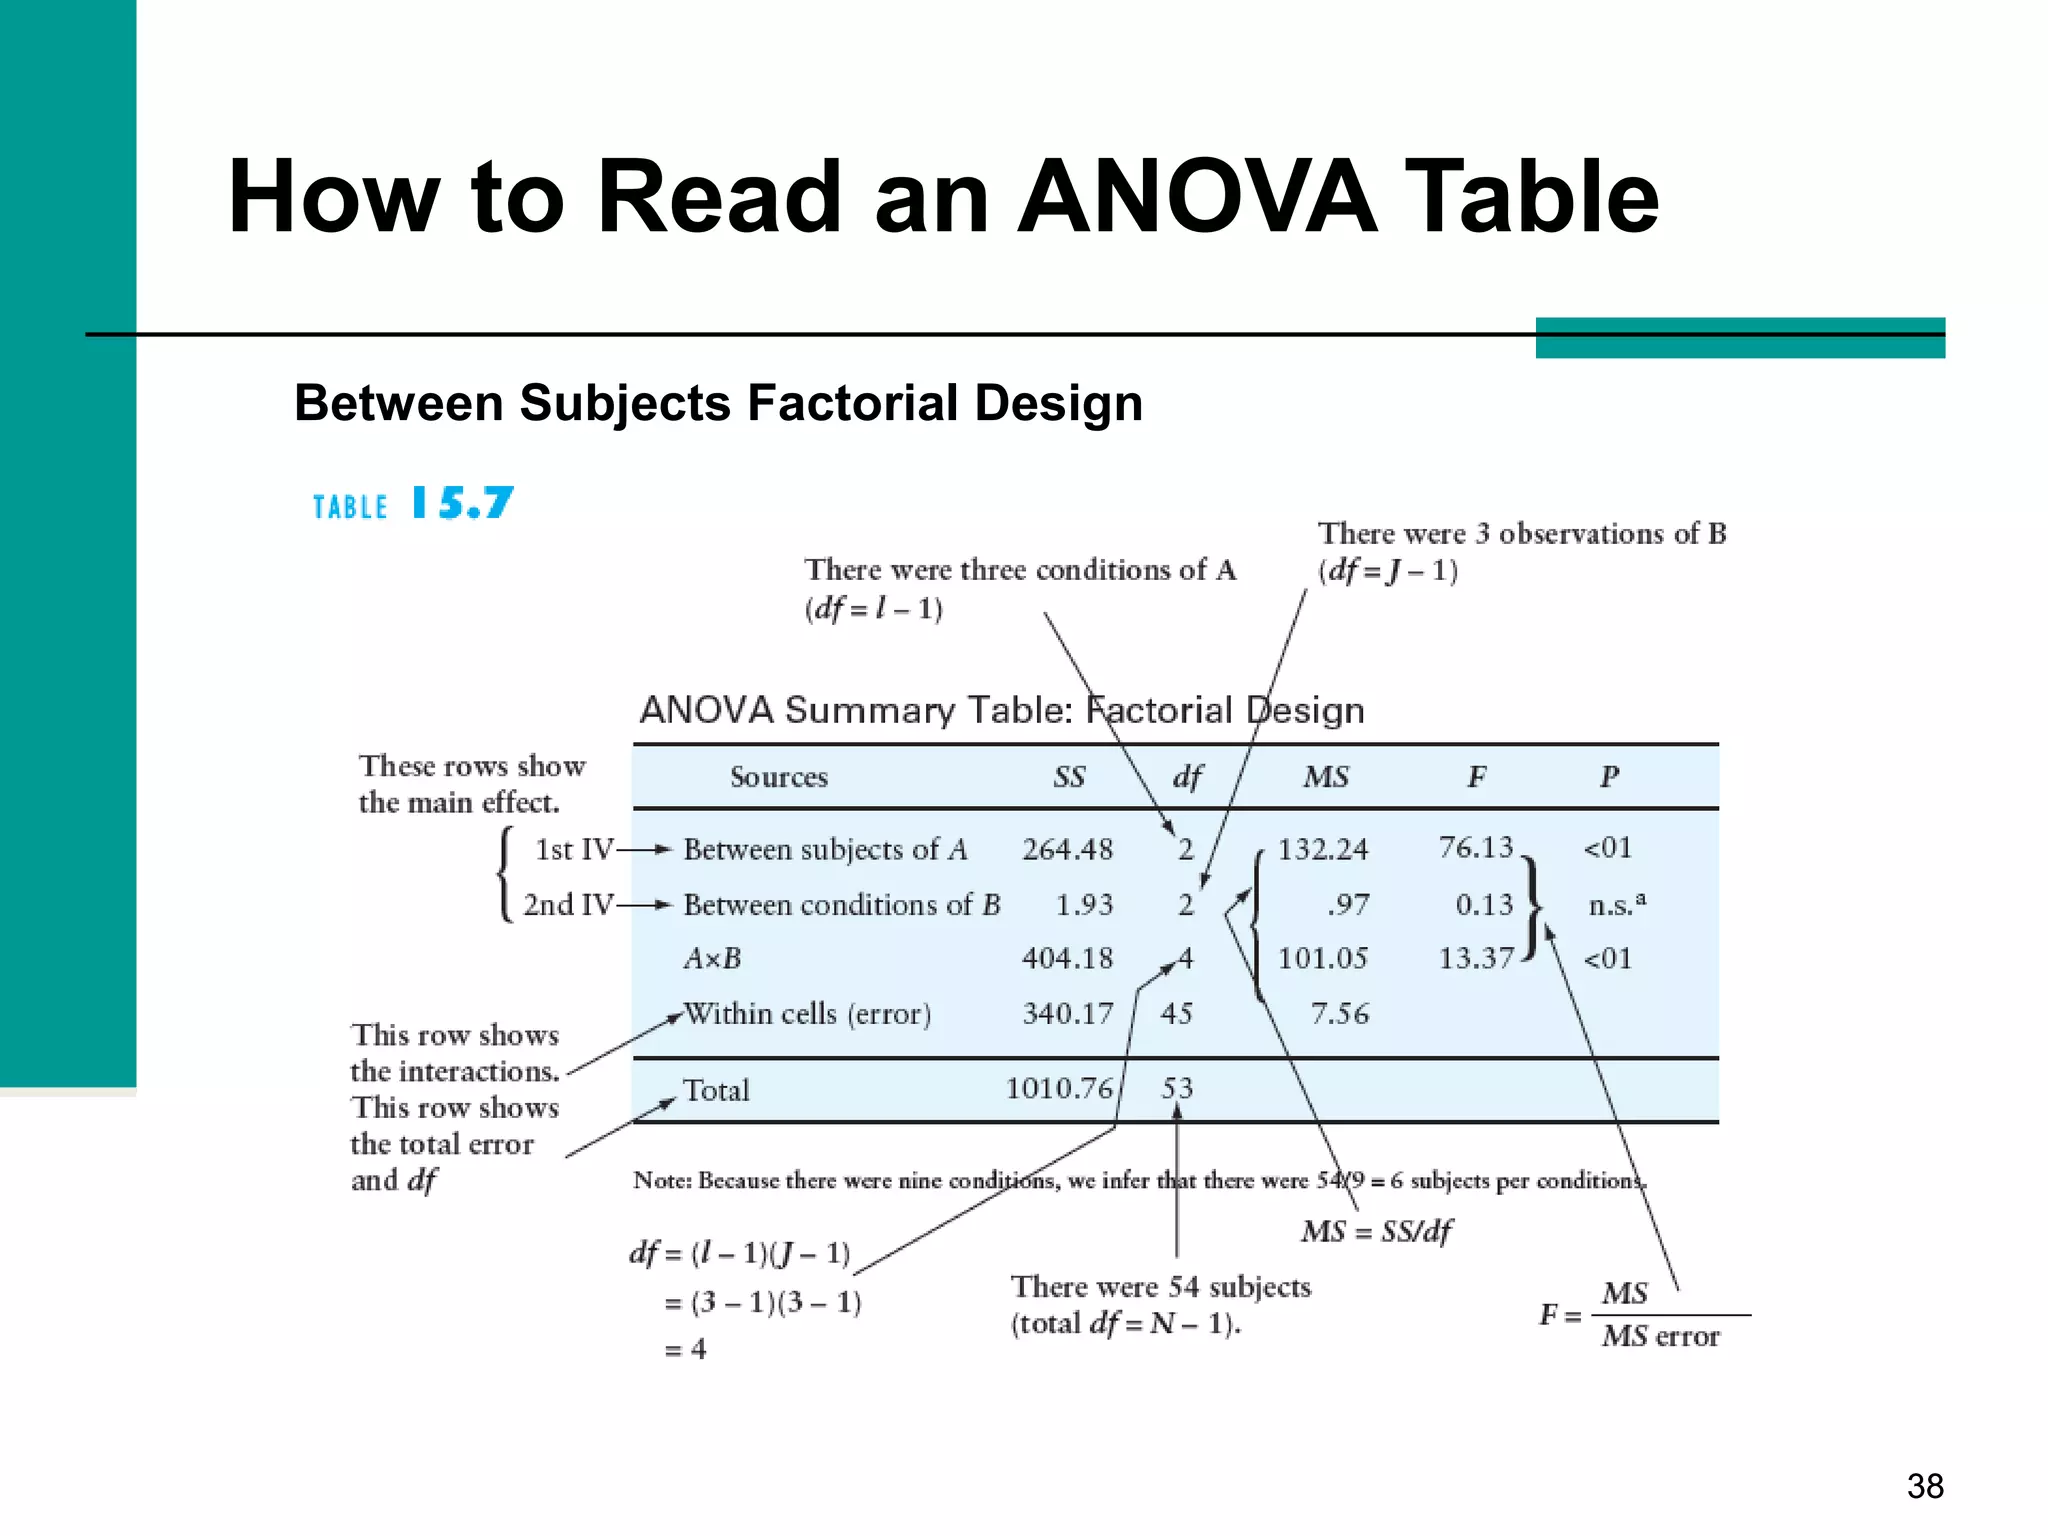
Research Methods, 9th Edition
Theresa L. White and Donald H. McBurney
Chapter 15
Data Exploration Part 2:
Inferential Statistics
22
Some basic terms
 Empirical data
 Facts derived from experience
 Population
 All members of some group
 Sample
 A subset of a population
 Statistic
 A quantity computed from a sample
 Parameter
 A quantity computed from a population
33
Statistics
 Descriptive Statistics
 Summarize a set of data
 Chapter 14
 Inferential Statistics
 Assist in drawing conclusions about
populations by examining a sample drawn
from the population.
44
Sampling Distributions
 Distribution of
means of samples
from a population
 Standard Error of
the Mean
 Standard
Deviation of a
sampling
distribution
55
Sampling Distributions
 Three properties:
 The sampling distribution has the same
mean as the original distribution.
 The sampling distribution has a smaller
standard deviation than the population
distribution.
 The larger the size of the samples that are
drawn from the population, the smaller the
standard deviation of the sample distribution.
66
Sampling Distributions
 The standard error of the mean is the standard
deviation of the population divided by the
square root of the sample size
 The sample size becomes larger, the shape
of the distribution approaches a normal
distribution, regardless of the shape of the
population from which the samples are
drawn.
77
Hypothesis Testing
 H1 (Alternative) vs H0 (Null)
88
Hypothesis Testing
 H1 (Alternative) vs H0 (Null)
99
Hypothesis Testing
 H1 (Alternative) vs H0 (Null)
1010
Hypothesis Testing
 H1 (Alternative) vs H0 (Null)
1111
Hypothesis Testing
 Directional hypothesis
 An alternative hypothesis that predicts that the results of
one condition will be greater (or less) than another, rather
than a prediction that they will simply differ.
1212
Hypothesis Testing
1313
Hypothesis Testing
1414
Hypothesis Testing
1515
Hypothesis Testing
 One-tailed hypothesis test
 Statistical test of a directional hypothesis
 Two-tailed hypothesis test
 Statistical test of a nondirectional hypothesis
1616
Hypothesis Testing
1717
Hypothesis Testing
1818
Hypothesis Testing
 Statistical significance is the probability that a result
happened by chance
 Alpha is the probability of deciding that the null
hypothesis is false when it’s actually true.
 Probability of a Type I error
1919
Hypothesis Testing
2020
Hypothesis Testing
2121
Hypothesis Testing
2222
Hypothesis Testing
2323
Significance
 Probability that an experimental result
happened by chance
 Generally alpha less than .05 (statistical
significance)
 Does not necessarily mean that the result
was important or large
2424
Significance
 The significance of significance
 Size of result is measured with Effect Size
 Effect size shows the strength of the relationship
between the independent and dependent
variables.
 Be measured by practice or by Cohen’s d (eta-
squared)
2525
Significance
2626
Power of the Test of the Null
Hypothesis Against the Alternative
 Power is the probability of rejecting the null
hypothesis when it actually IS false
2727
Power of the Test of the Null
Hypothesis Against the Alternative
 Power
 Three things influence the power of a test
 The value of alpha
 The smaller your alpha level, the smaller your power.
 Experimental error
 Sample sizes
2828
Chi Square Statistic
 Tests Frequency
Data to
determine
whether two
categorical
variables are
related.
 Expected
Frequency vs
Observed
Frequency
2929
Chi Square Statistic
 contingency table
 also referred to as cross tabulation or crosstab
 In statistics, a contingency table is a type of table in a
matrix format that displays the (multivariate)
frequency distribution of the variables.
3030
Chi Square Statistic
3131
ANOVA
 Compares more than two conditions
 For only two, use a t-test
 Tests the significance of a difference among
several conditions in an experiment by
making two different estimates of the
variability that would be expected if the null
hypothesis is true.
 Between variability
 Within variability
3232
T test
3333
ANOVA
Ha: at least two means differ
(Note the alternative hypothesis is sometimes stated as "at least one
mean differs")
3434
ANOVA
3535
ANOVA
3636
How to Read an ANOVA Table
Between Subjects Single Factor Design
3737
How to Read an ANOVA Table
Within Subjects Single Factor Design
3838
How to Read an ANOVA Table
Between Subjects Factorial Design

Ch15 data exploration (ii)