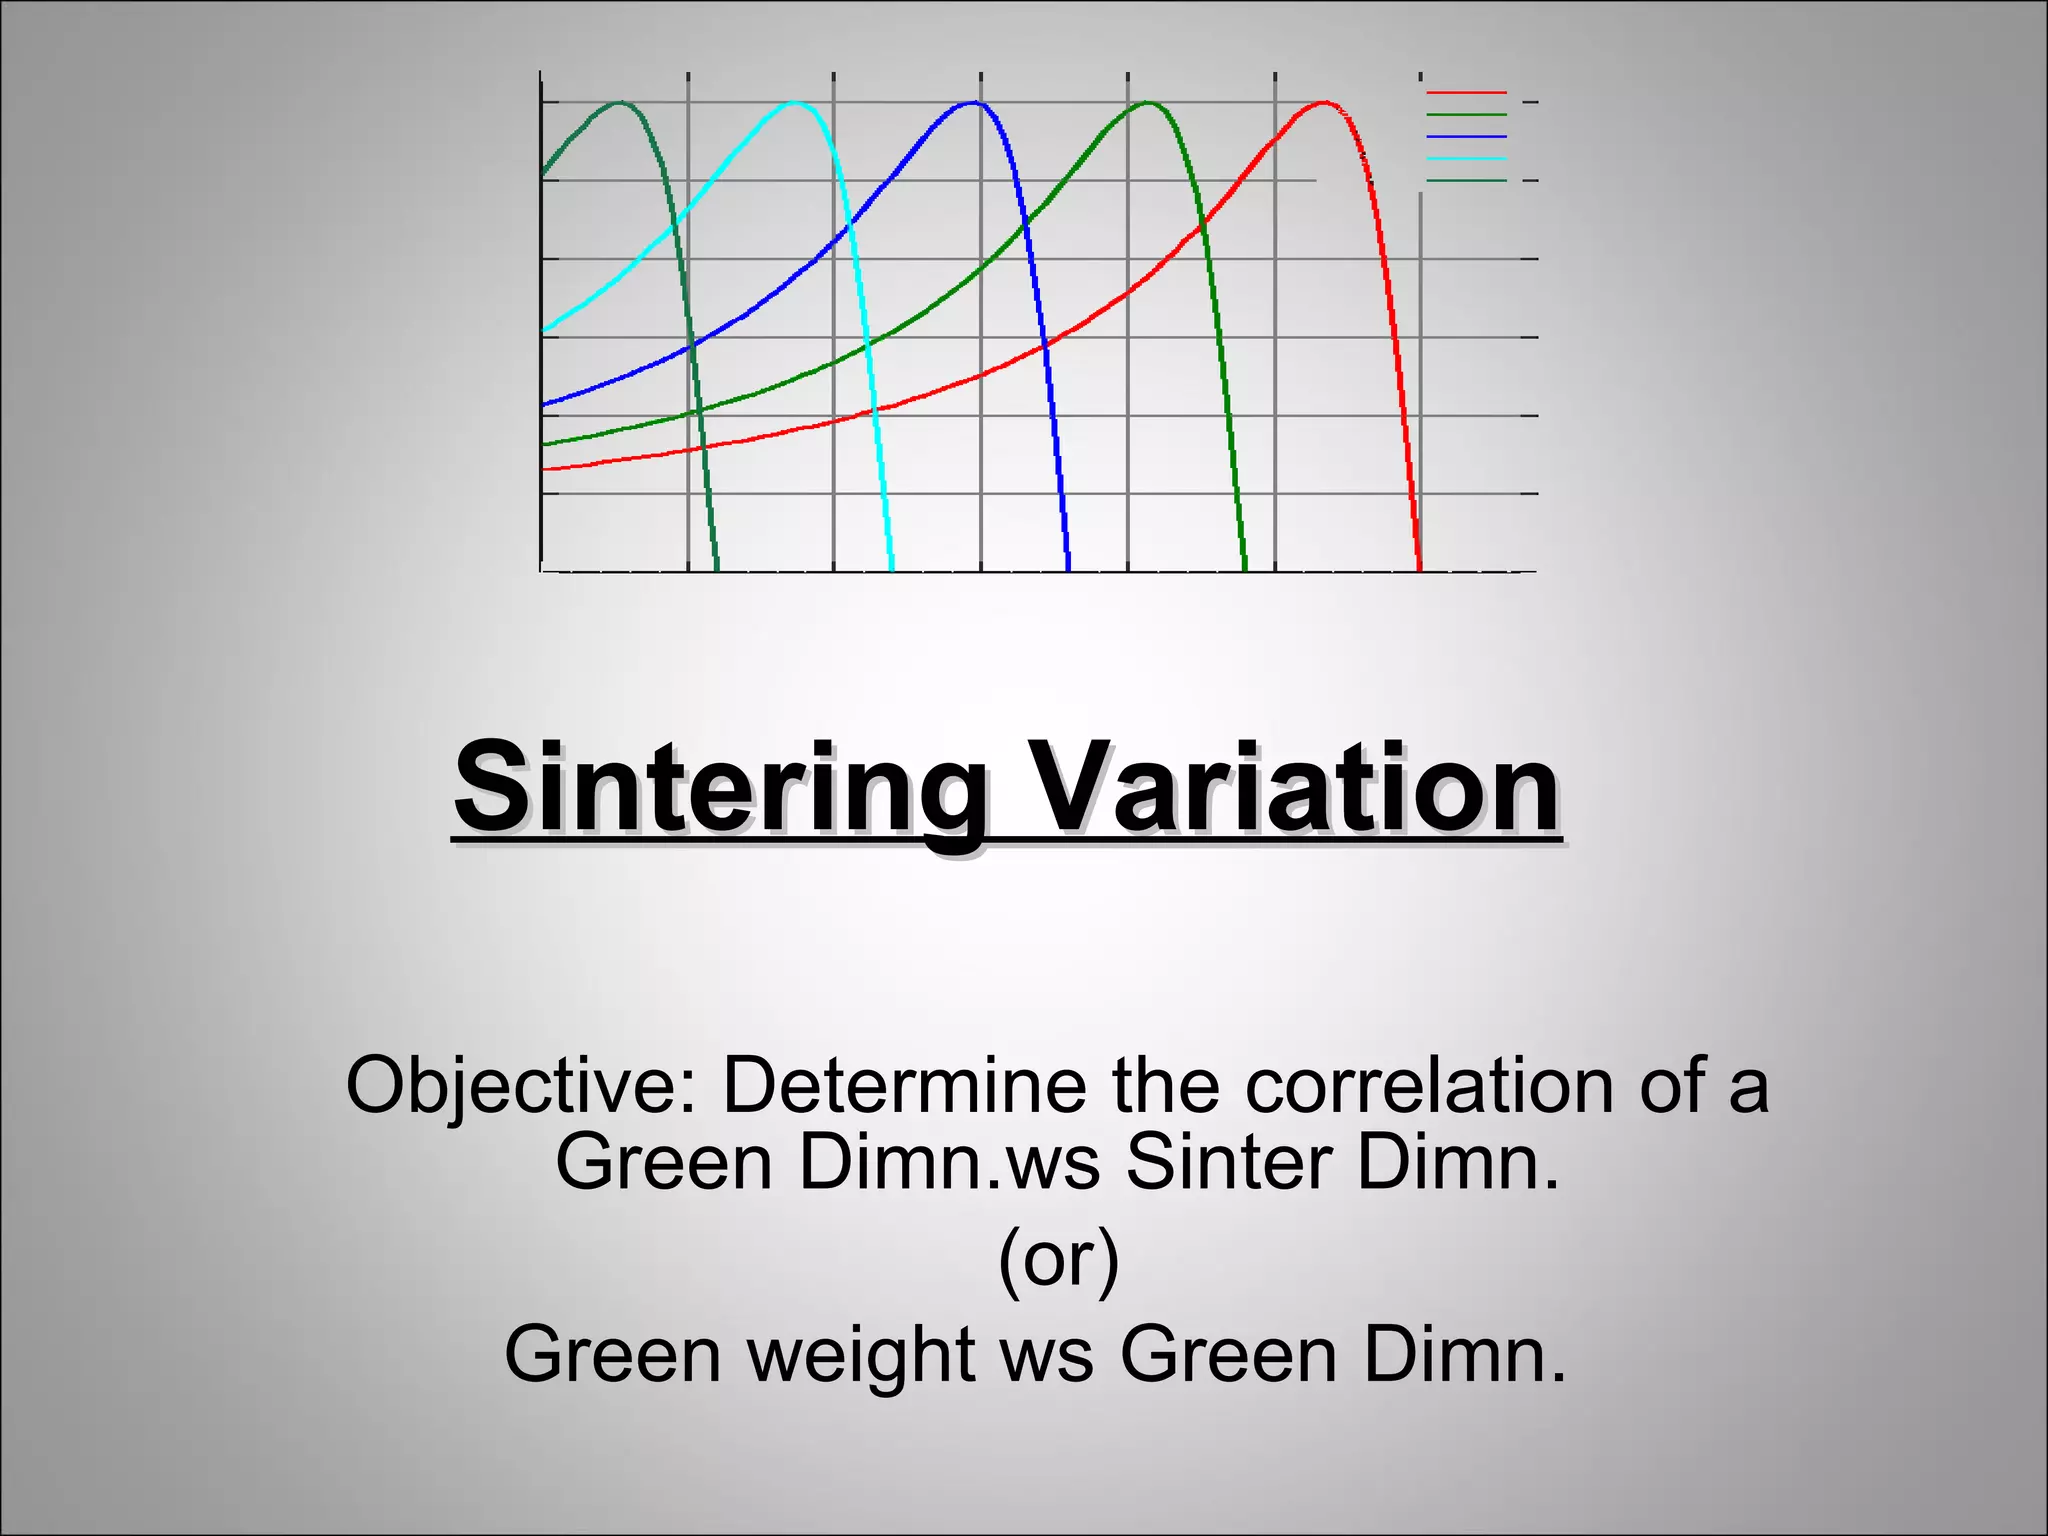
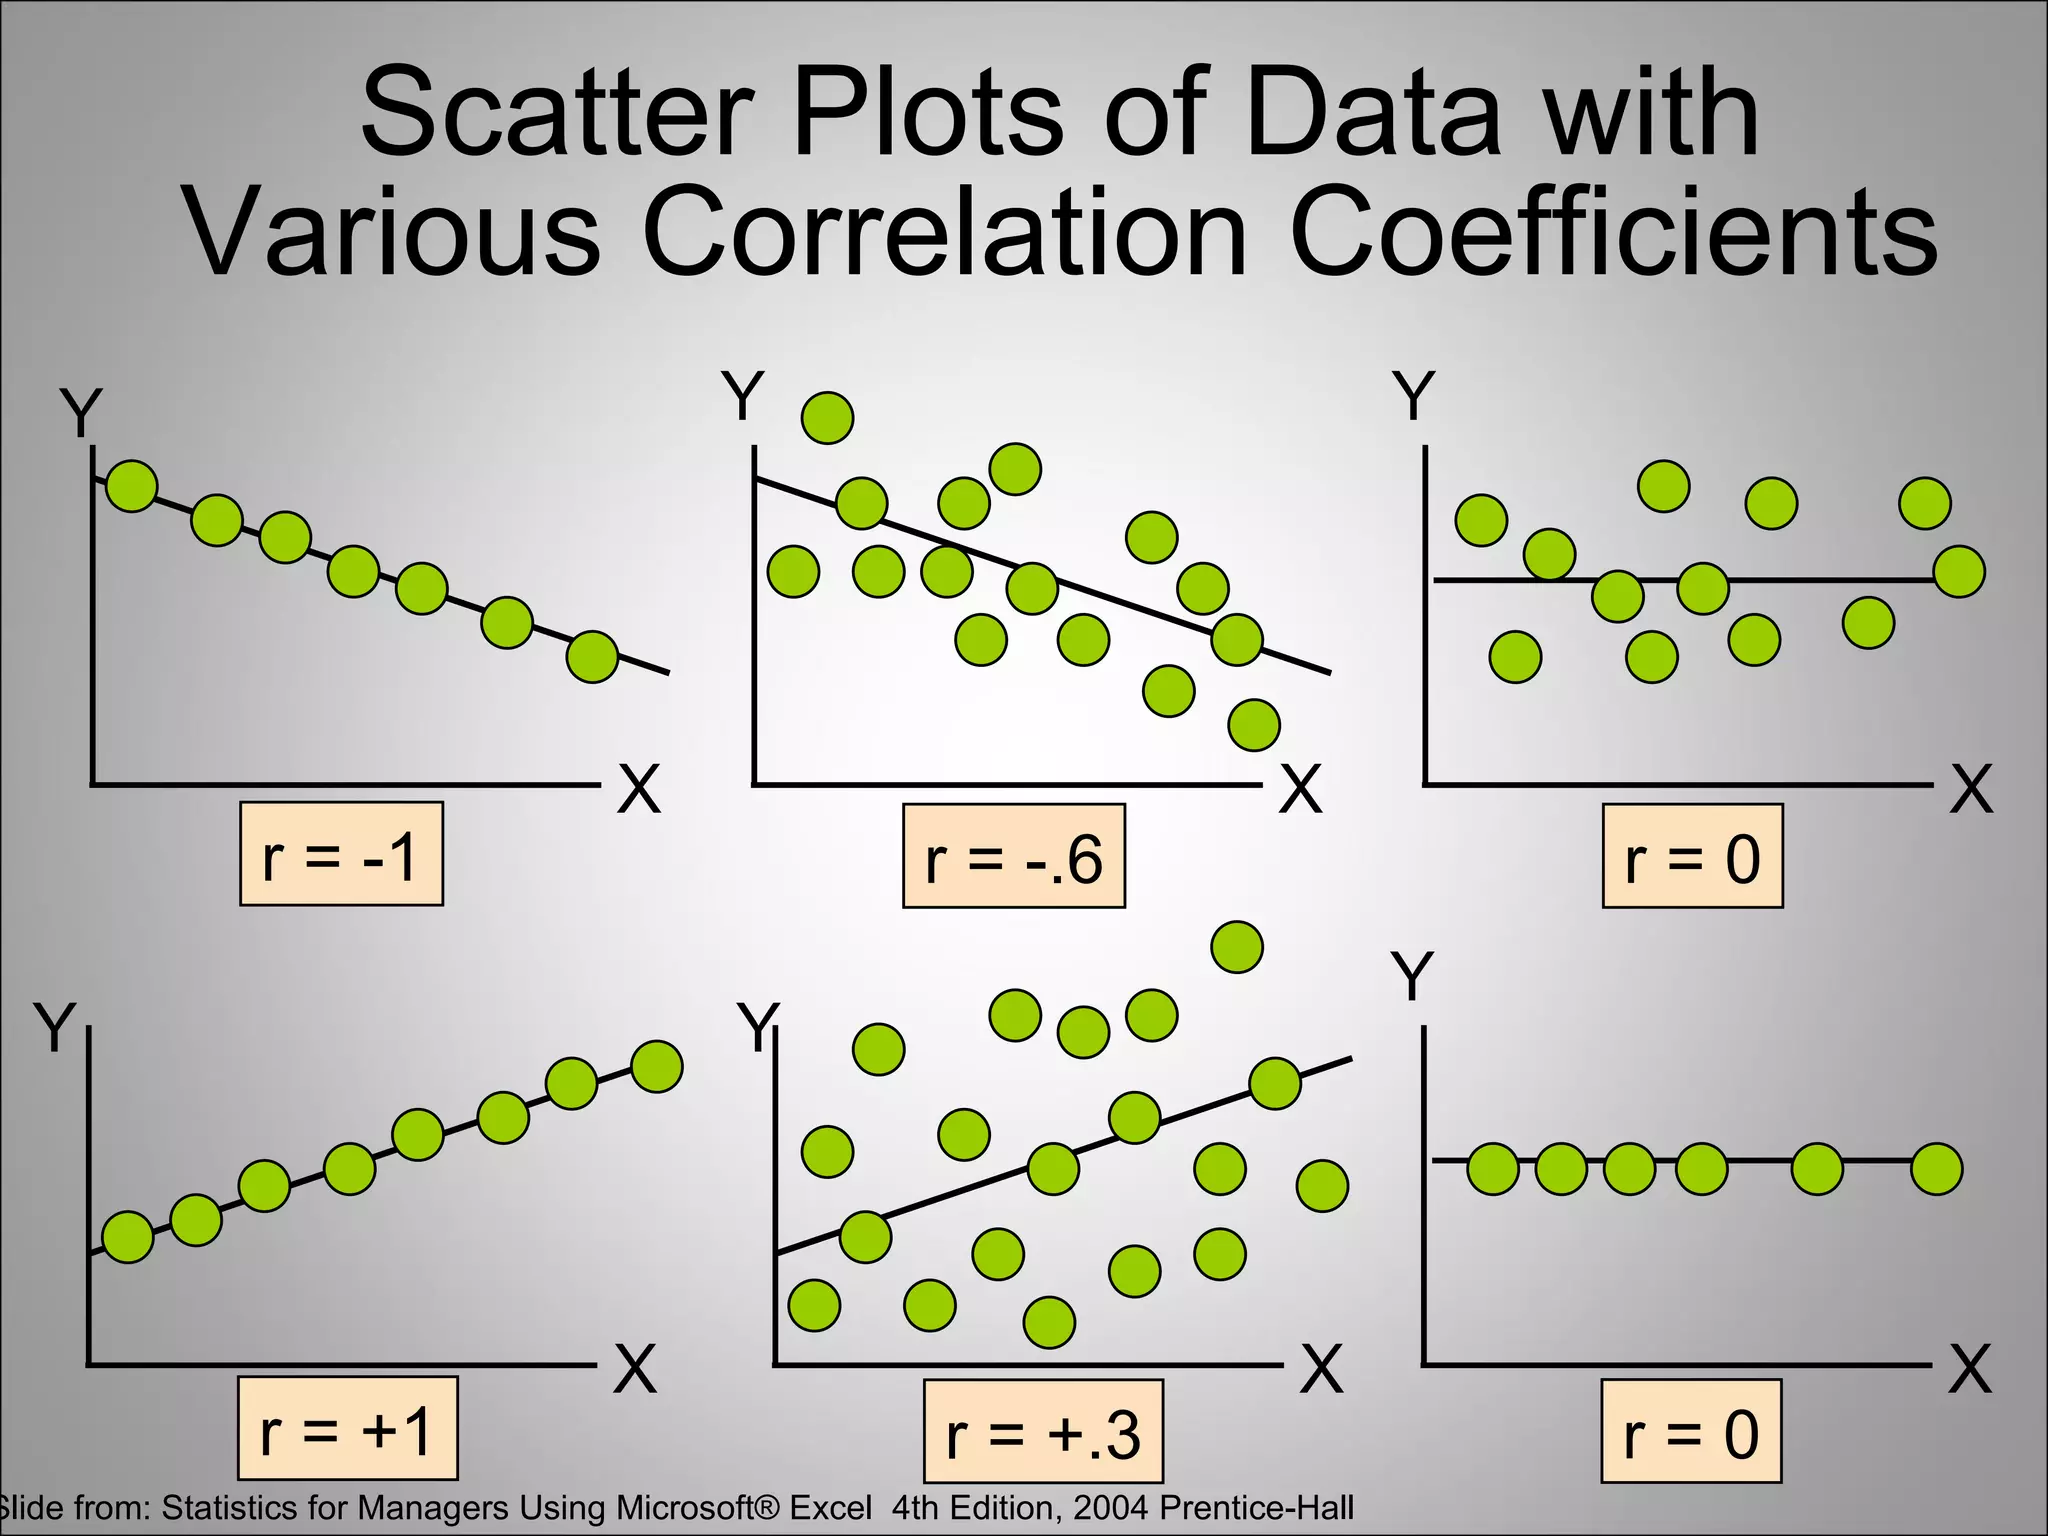
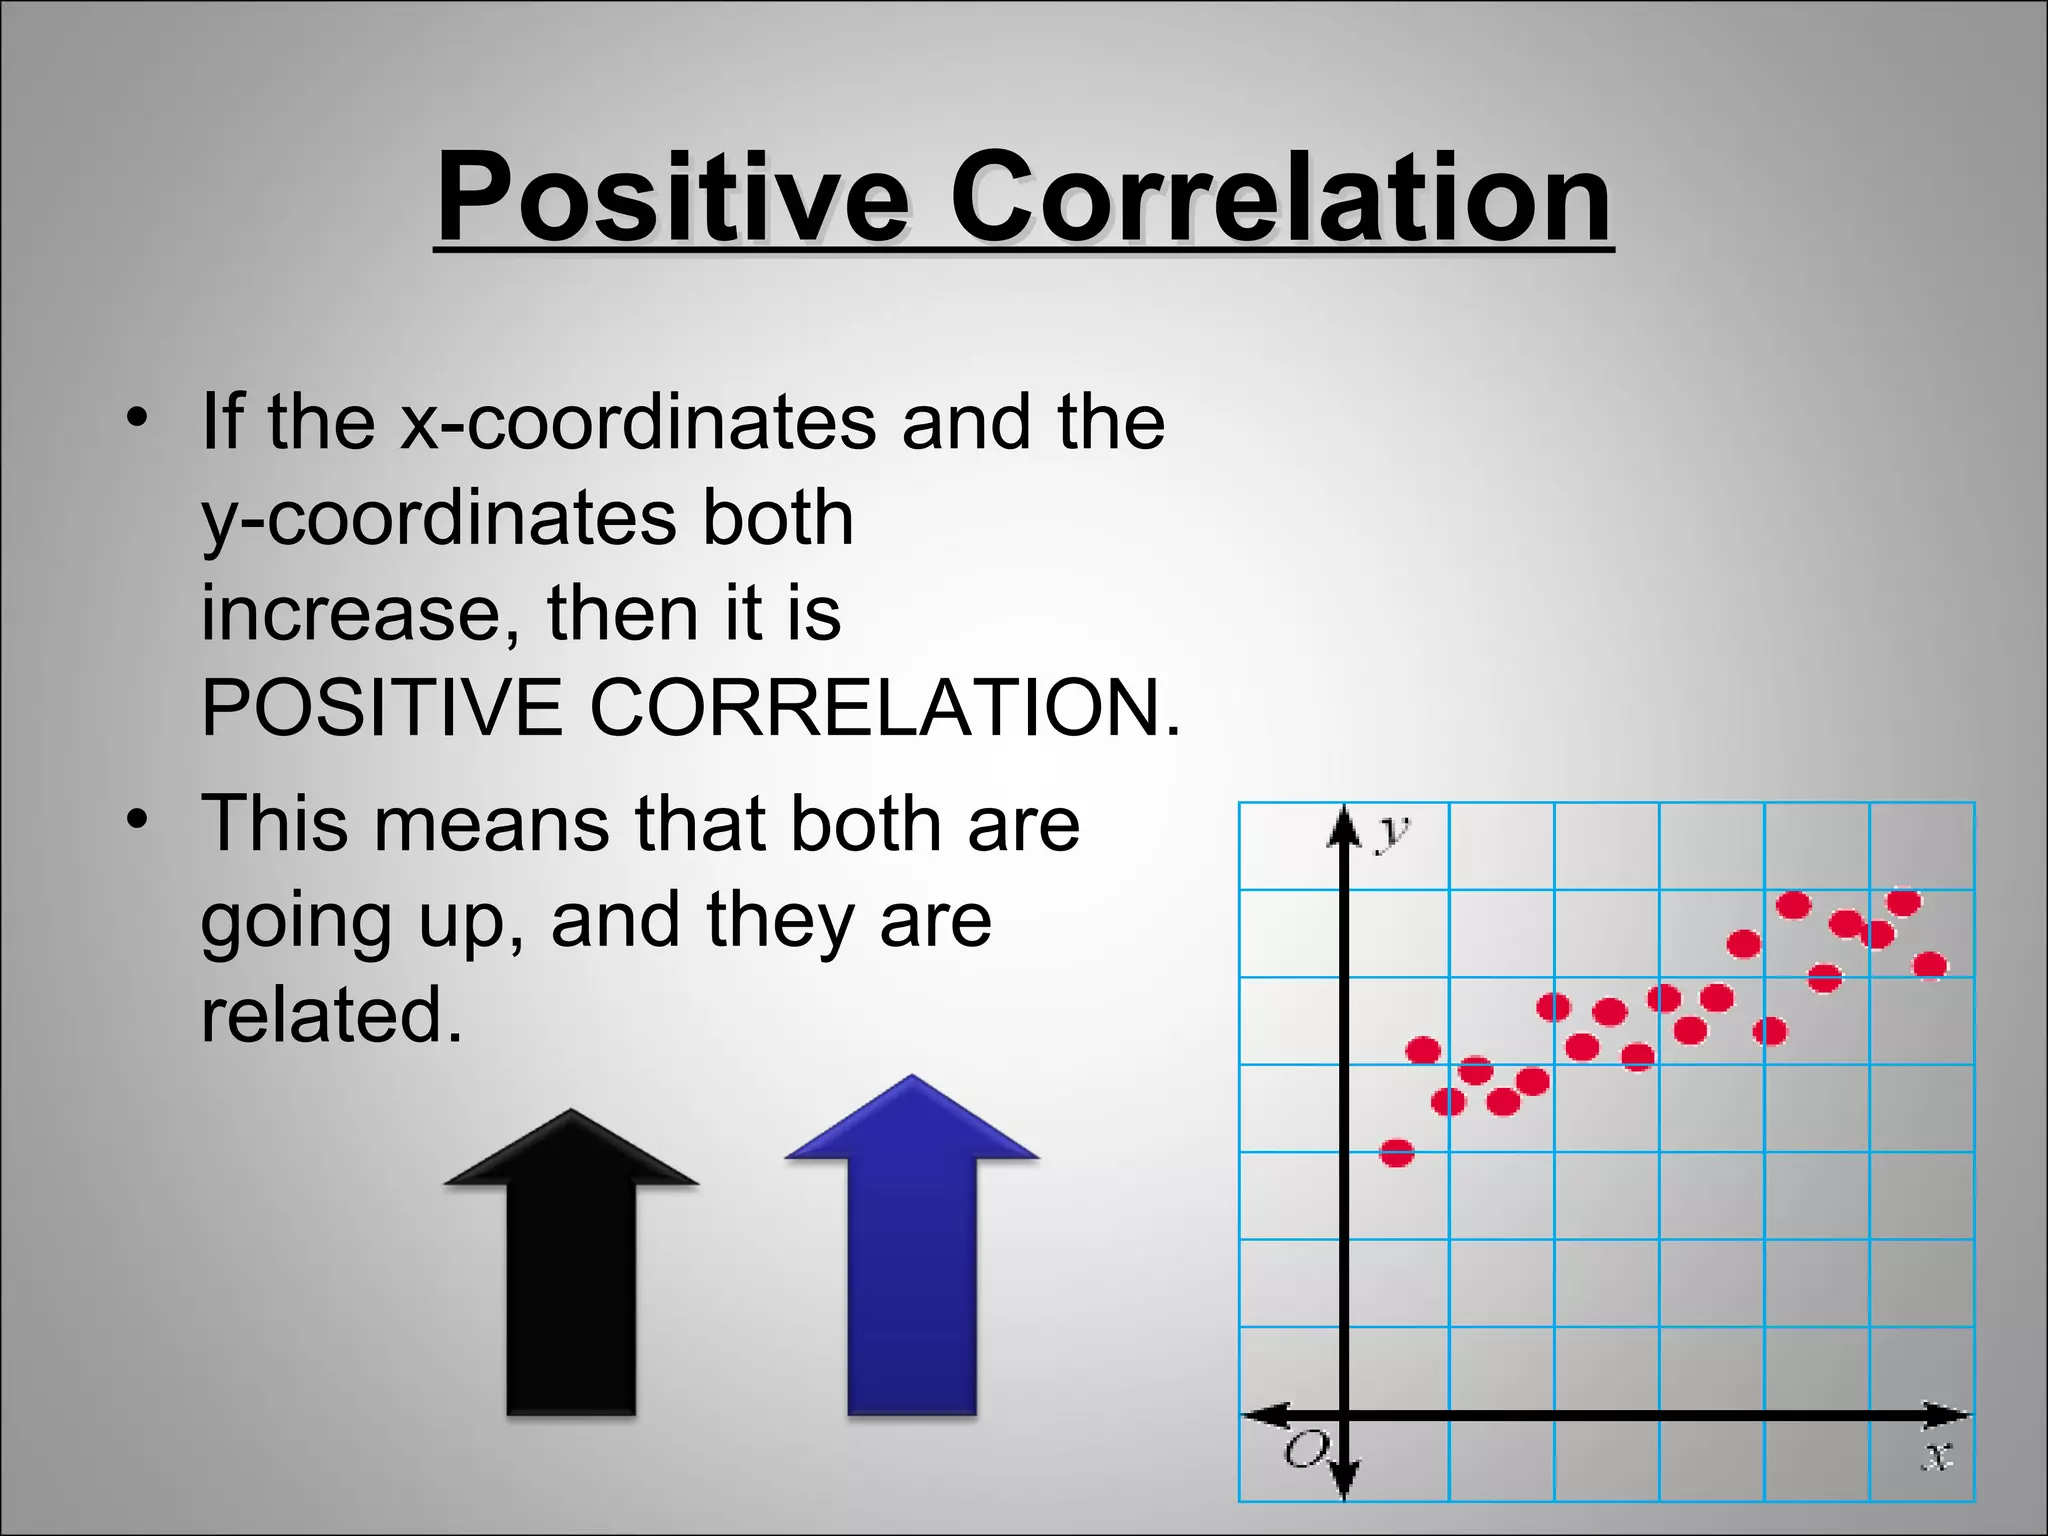
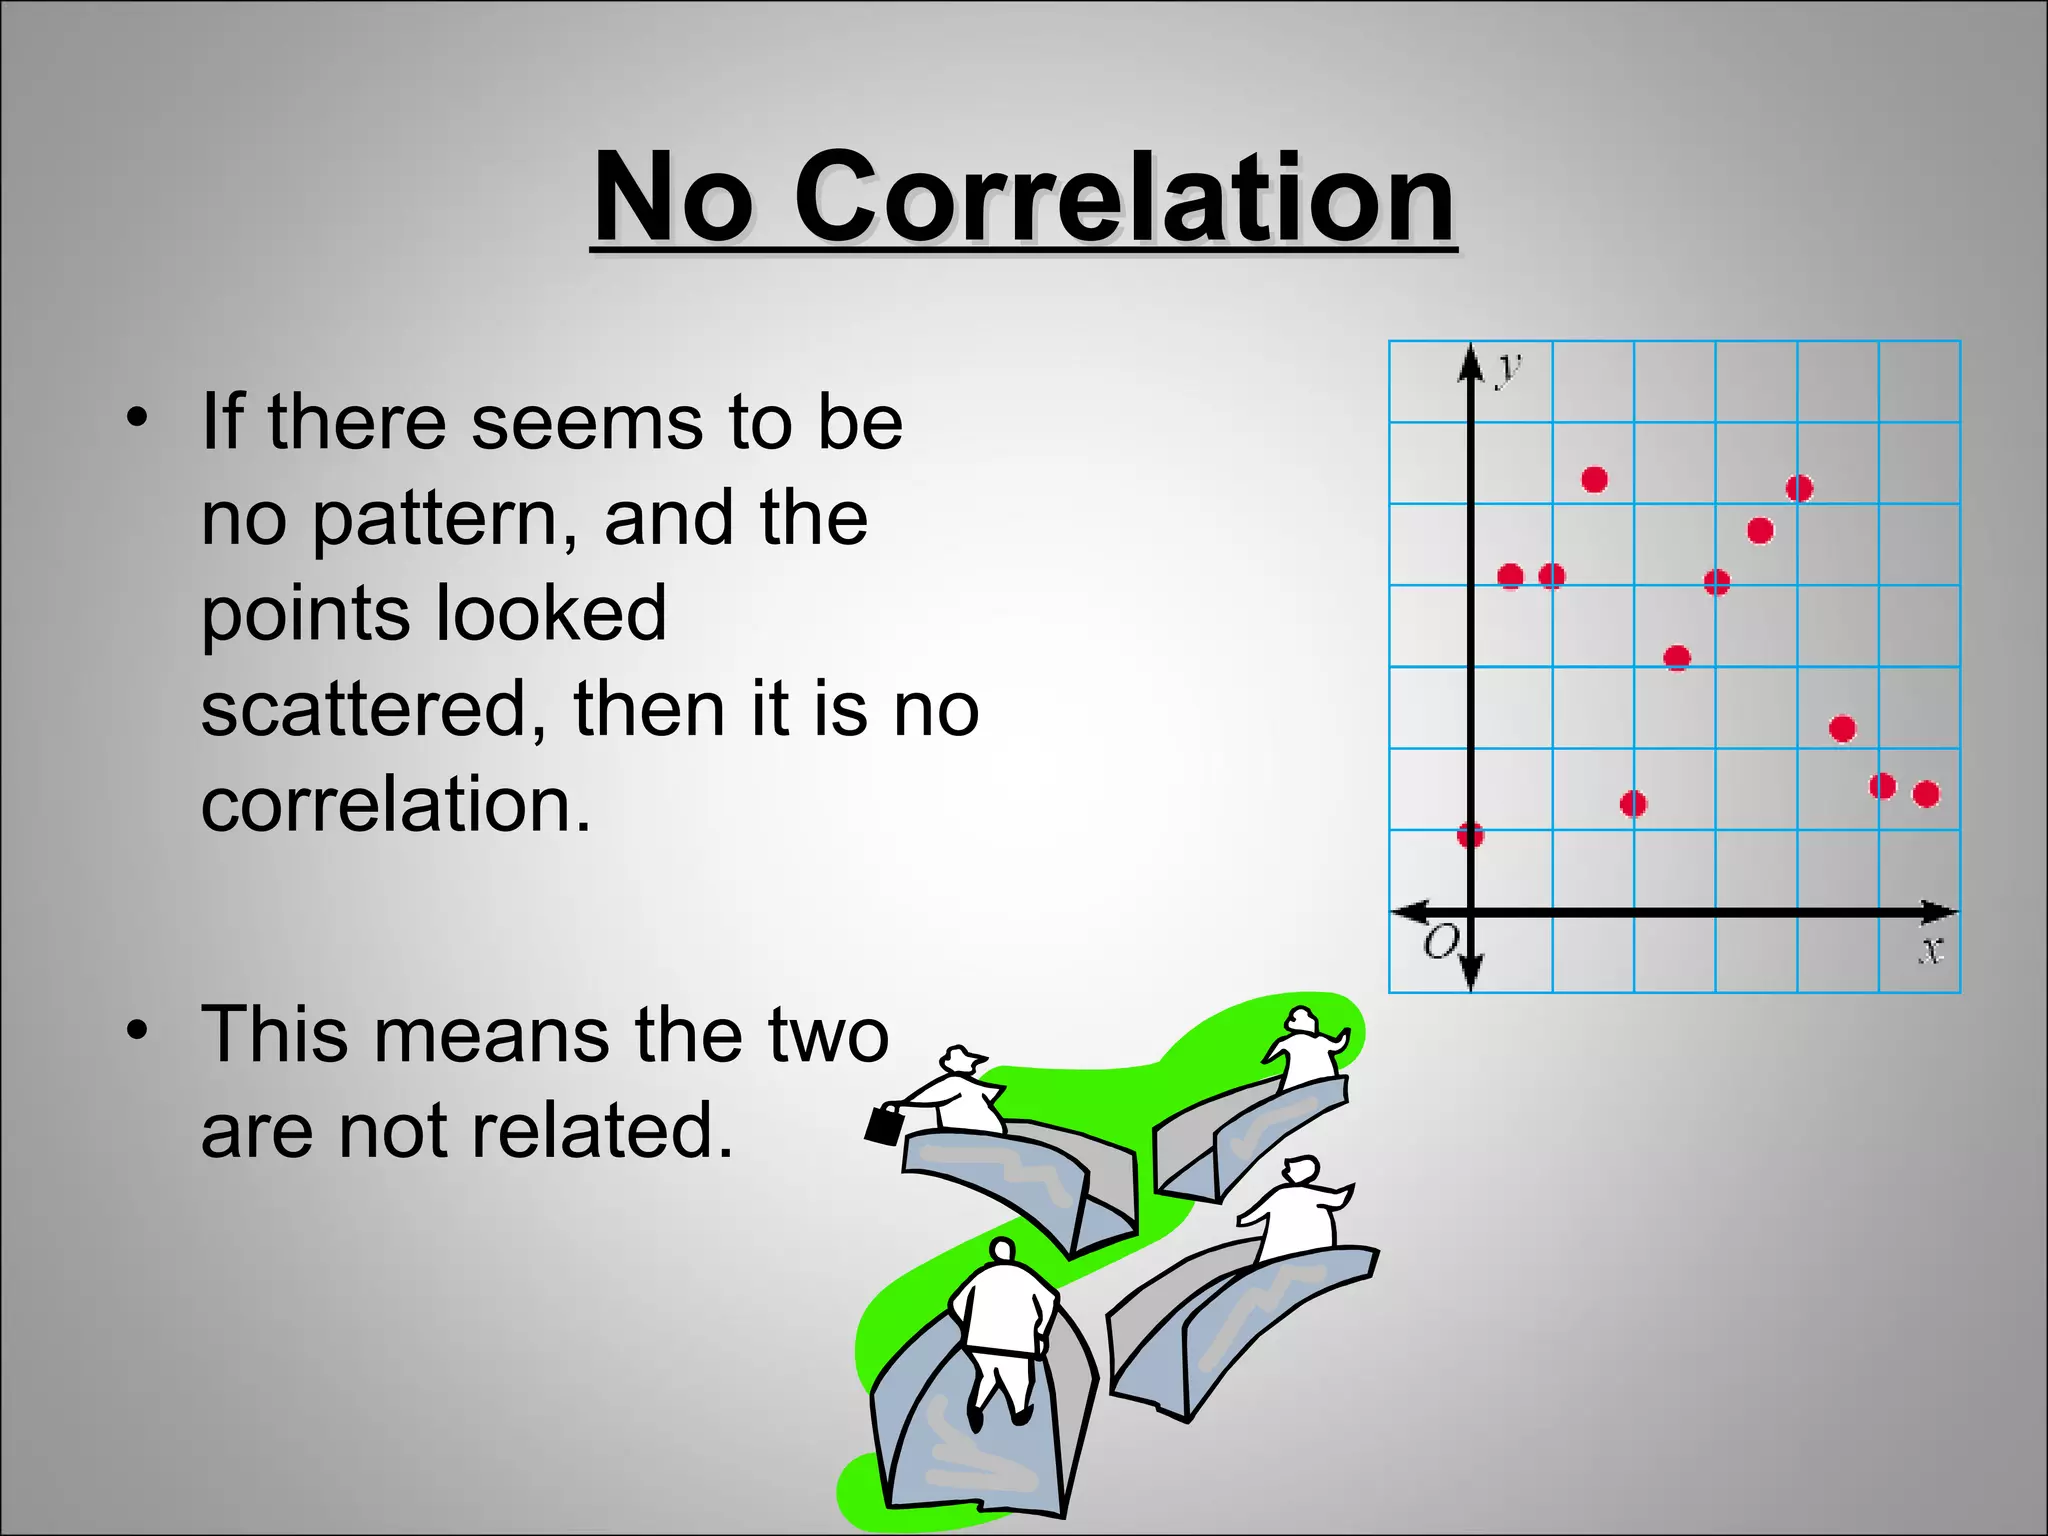
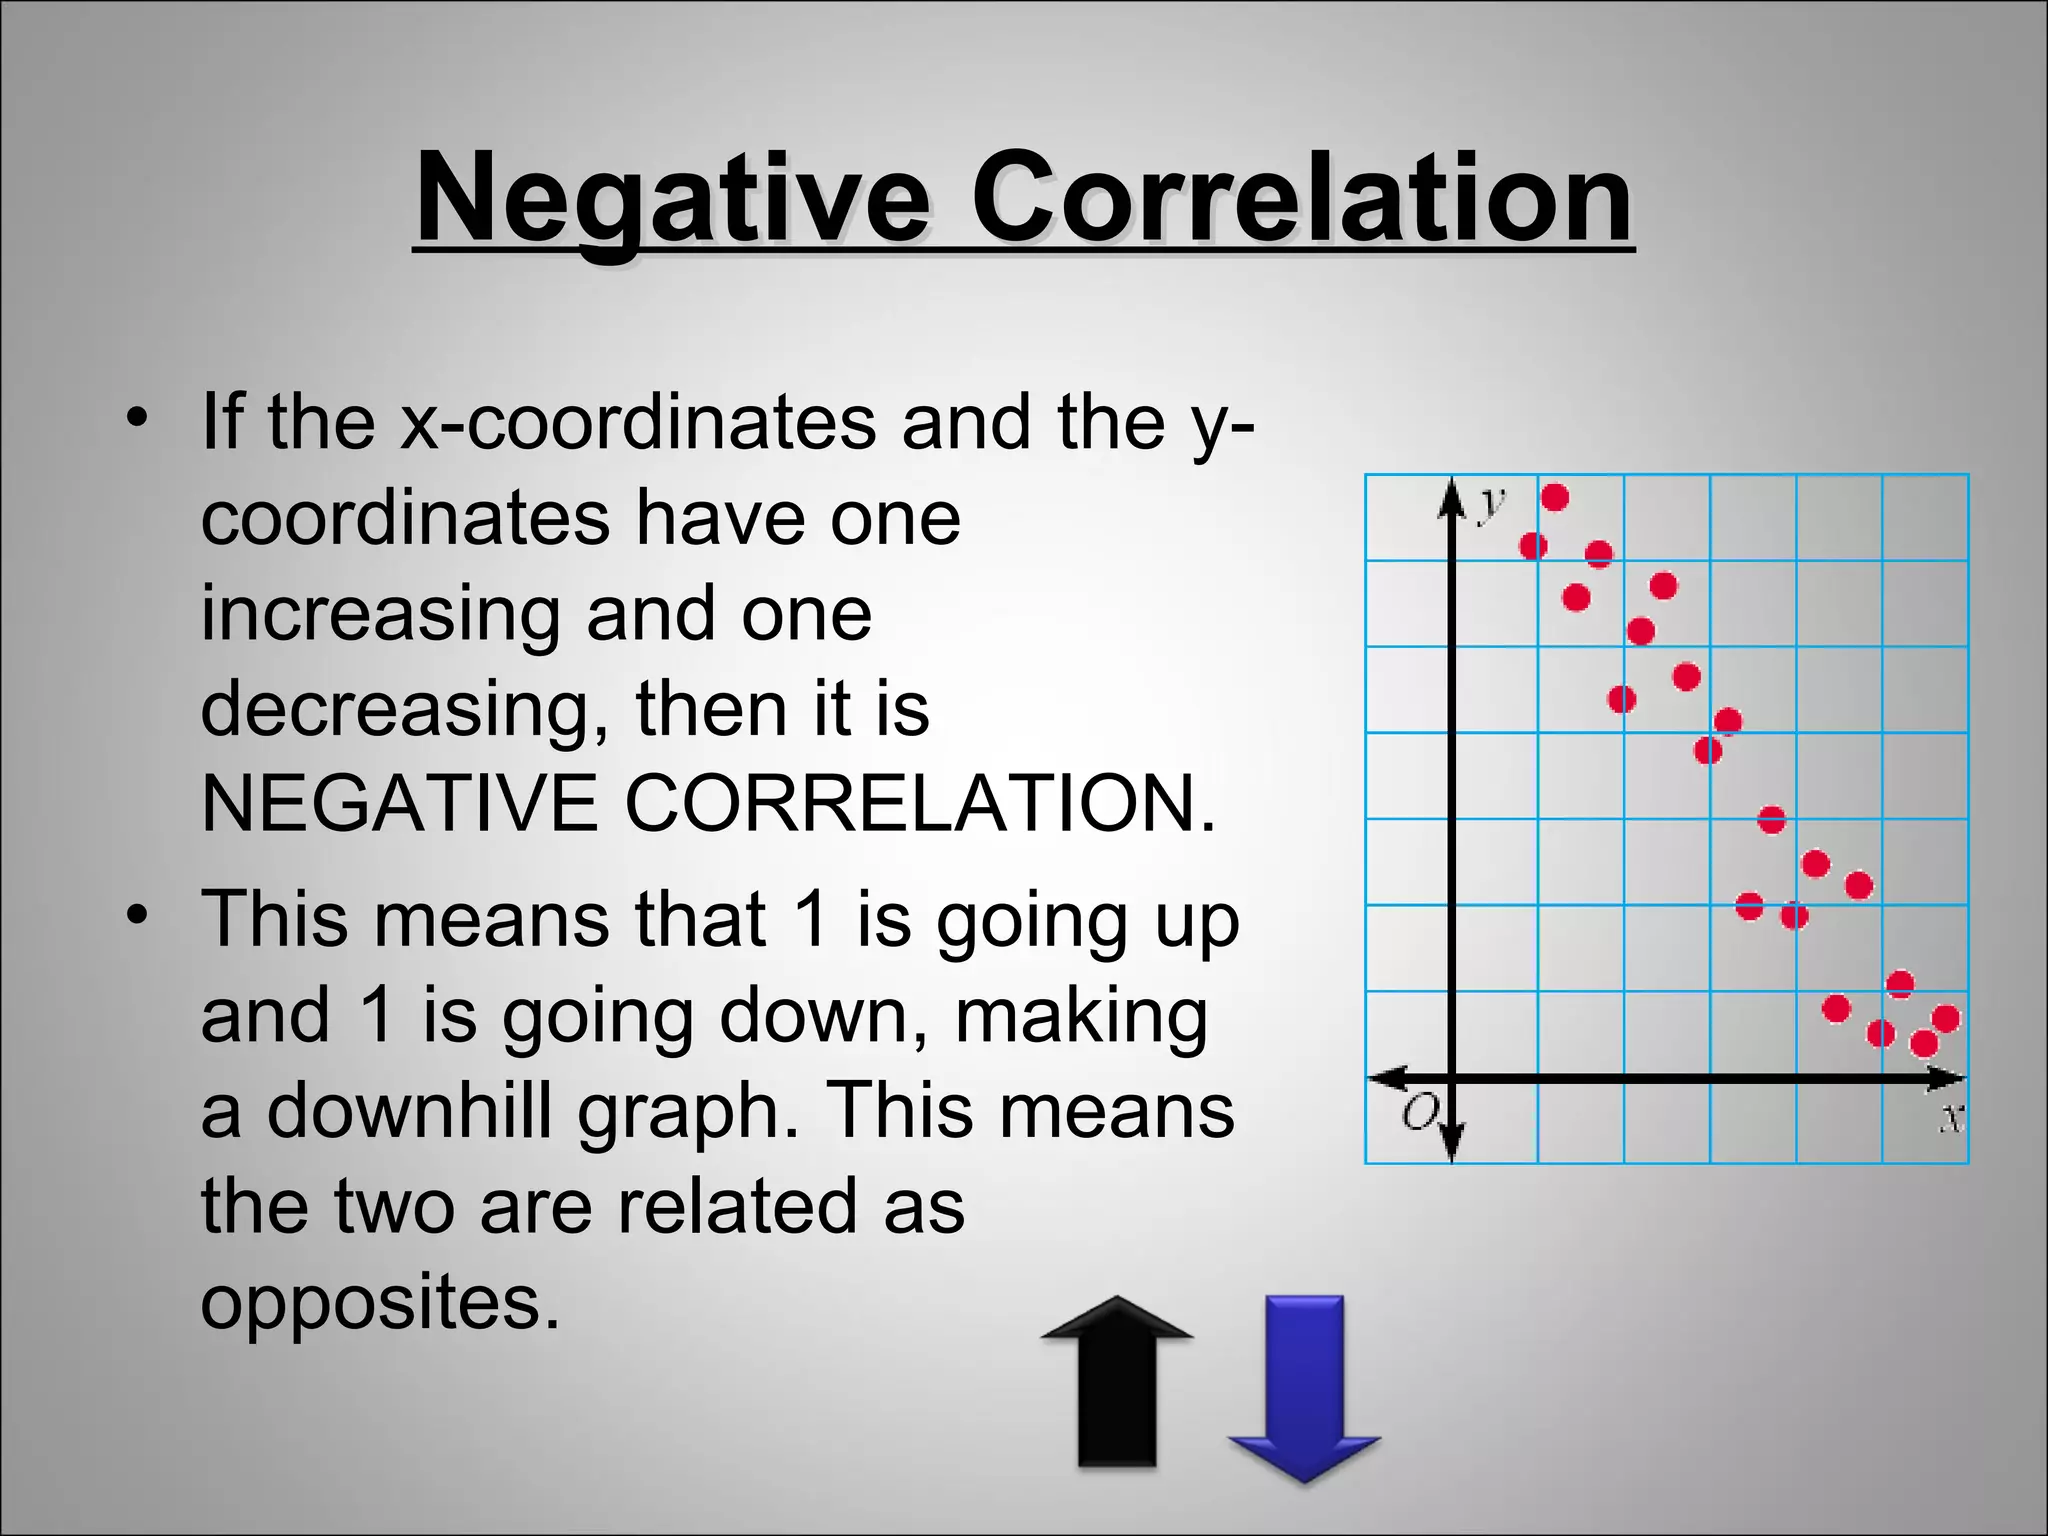
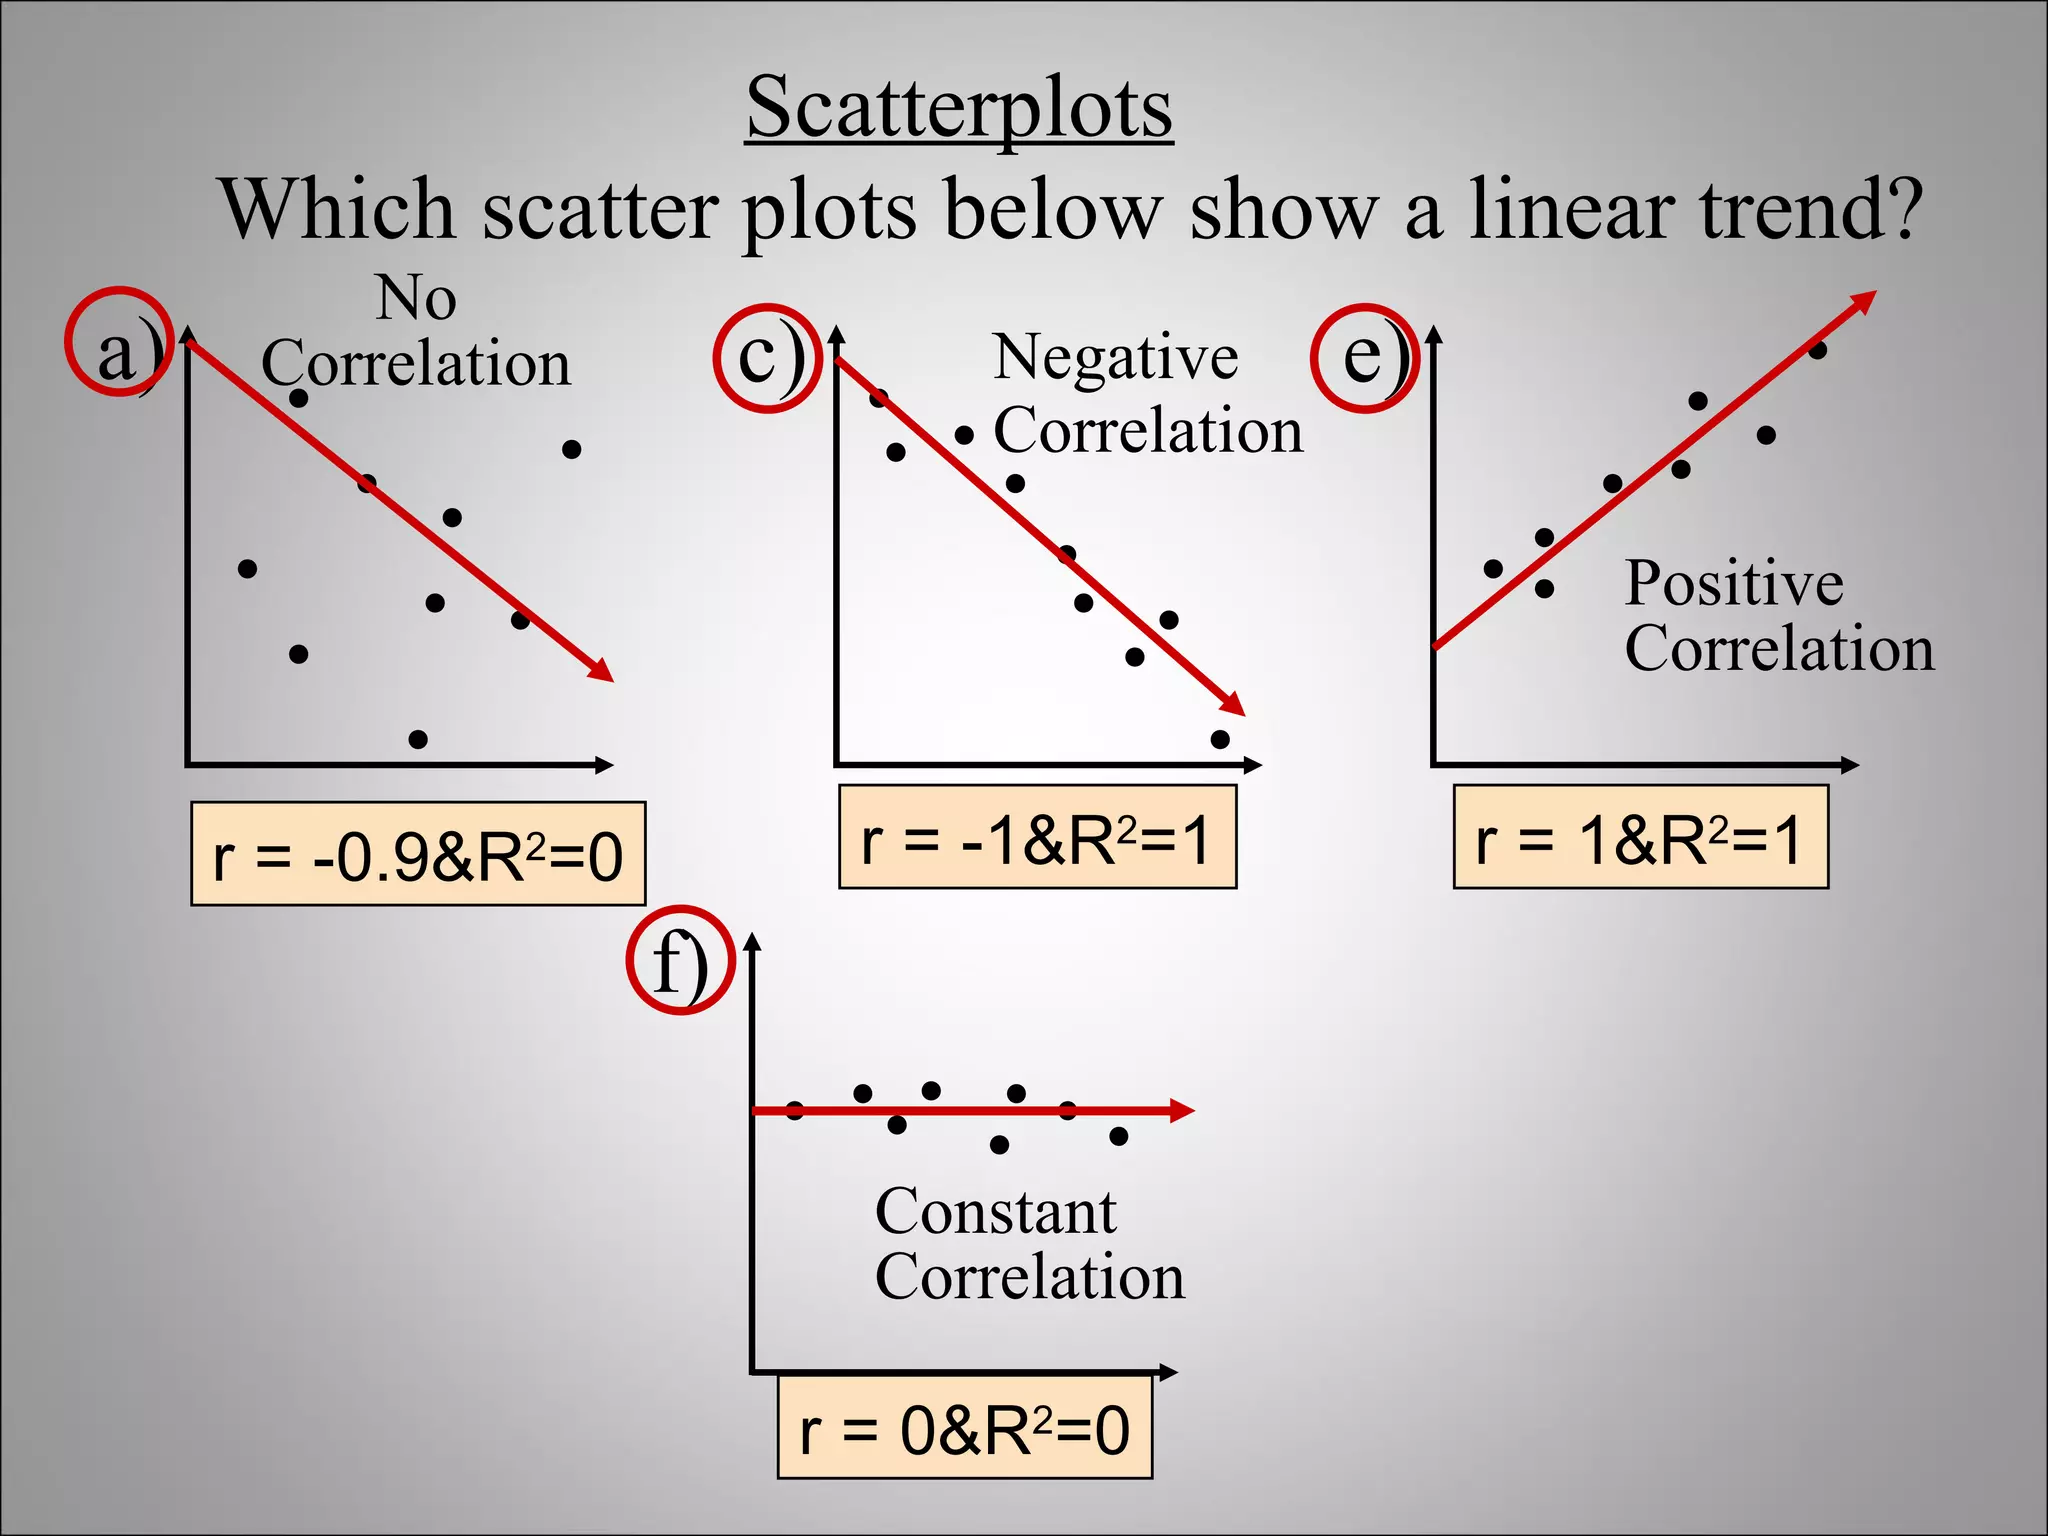
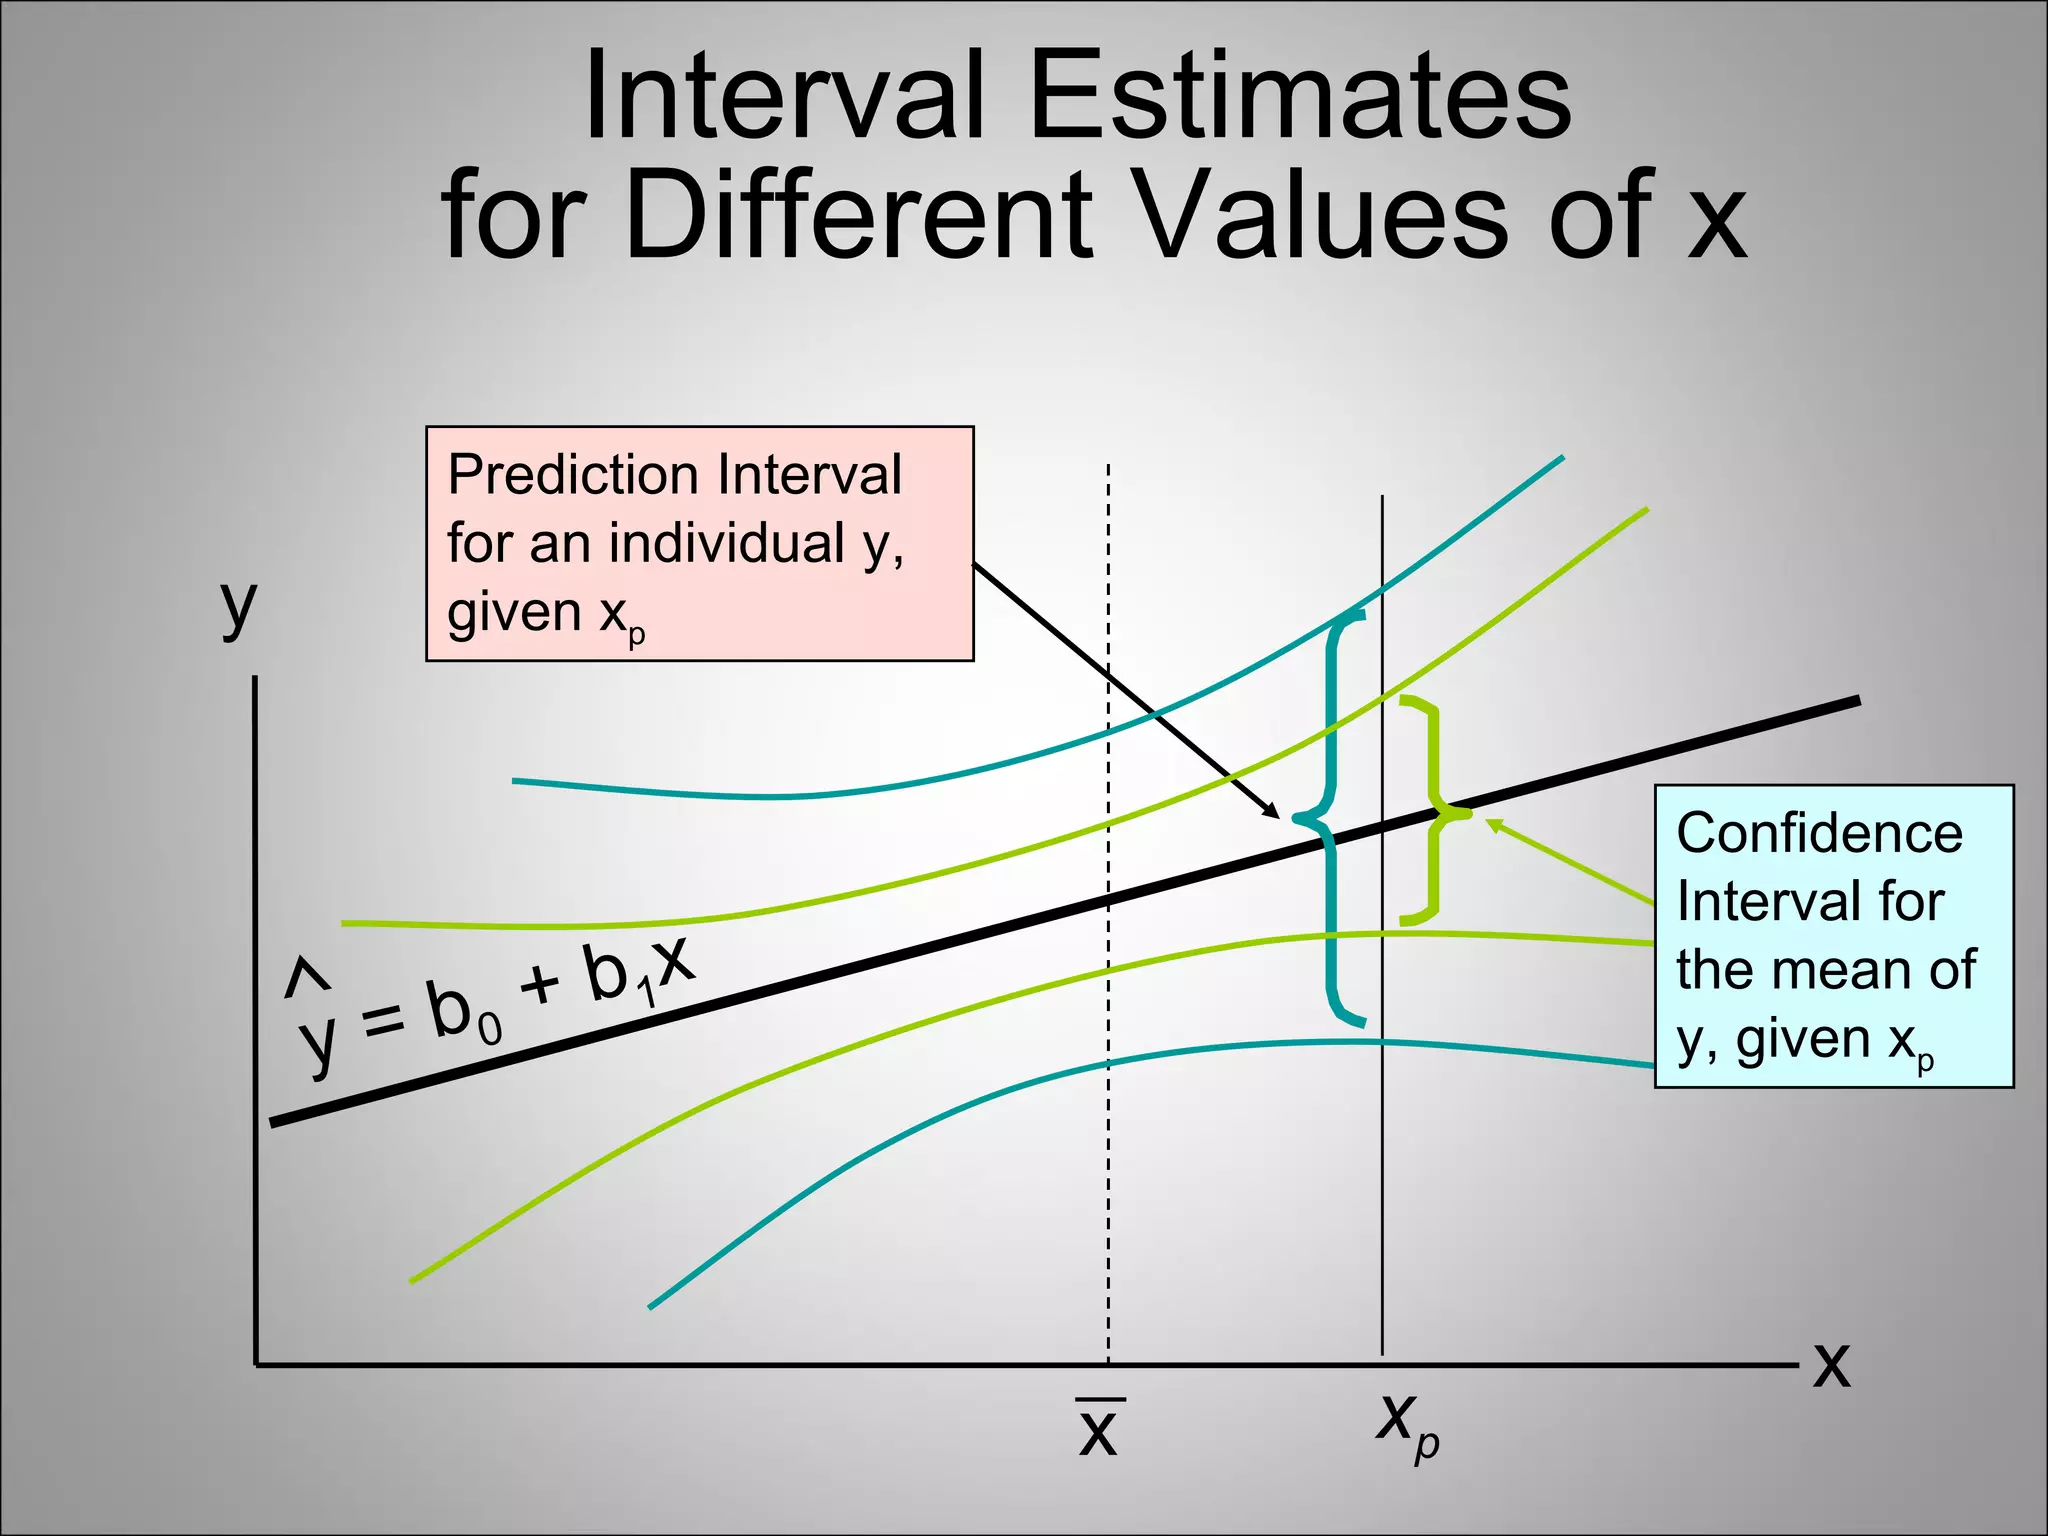
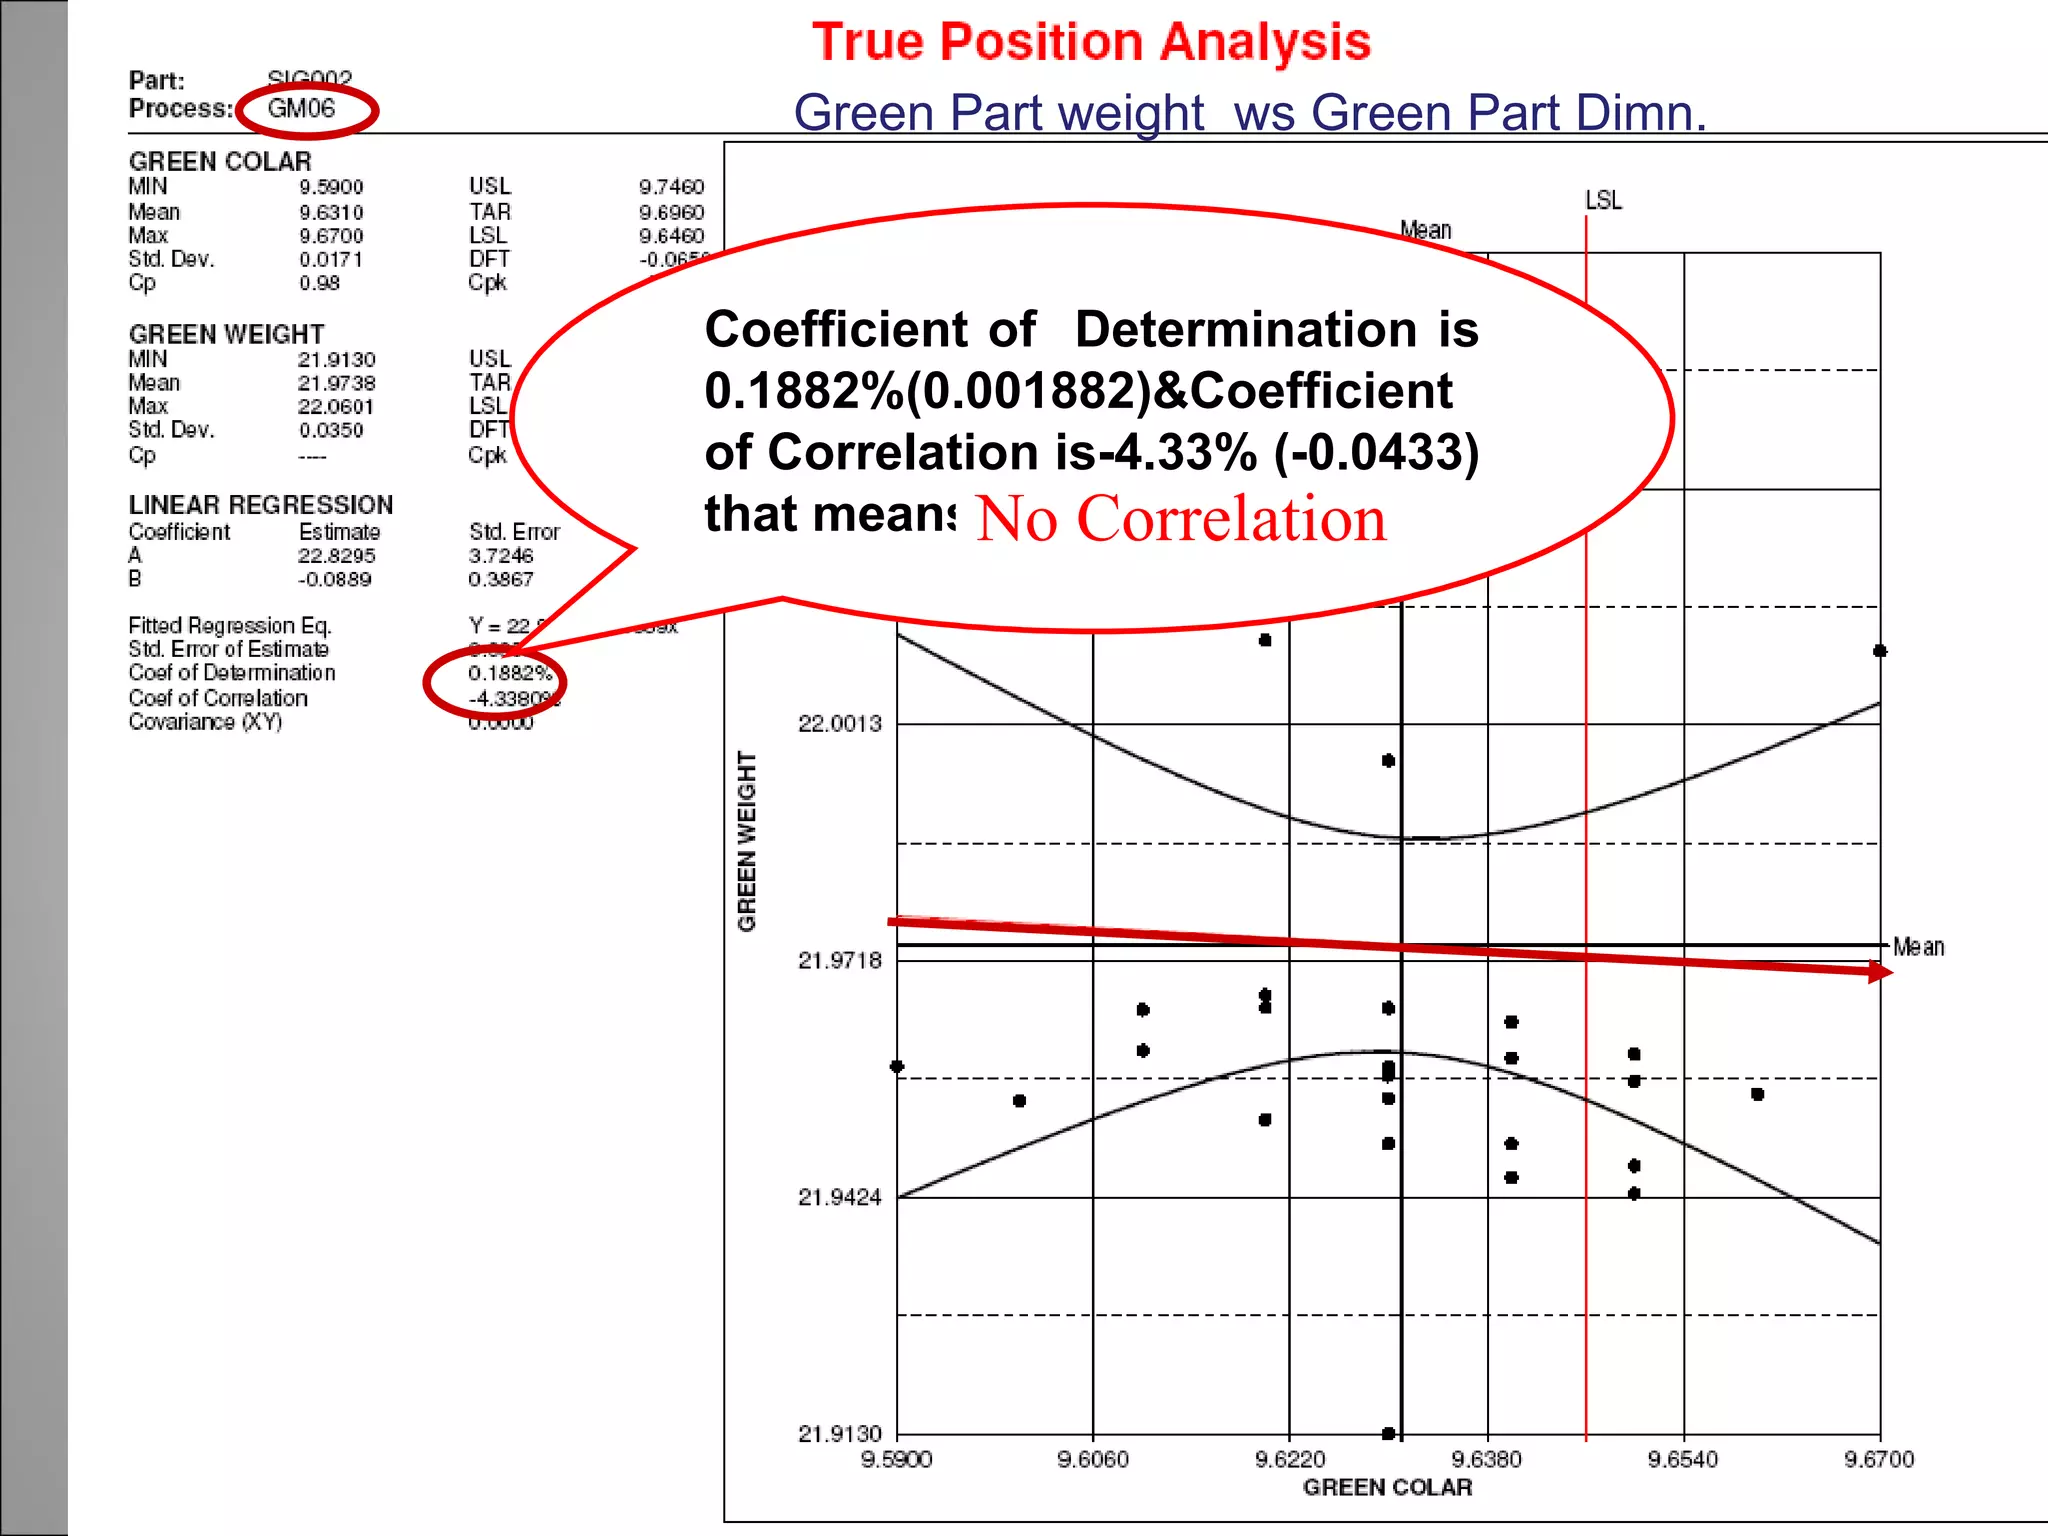
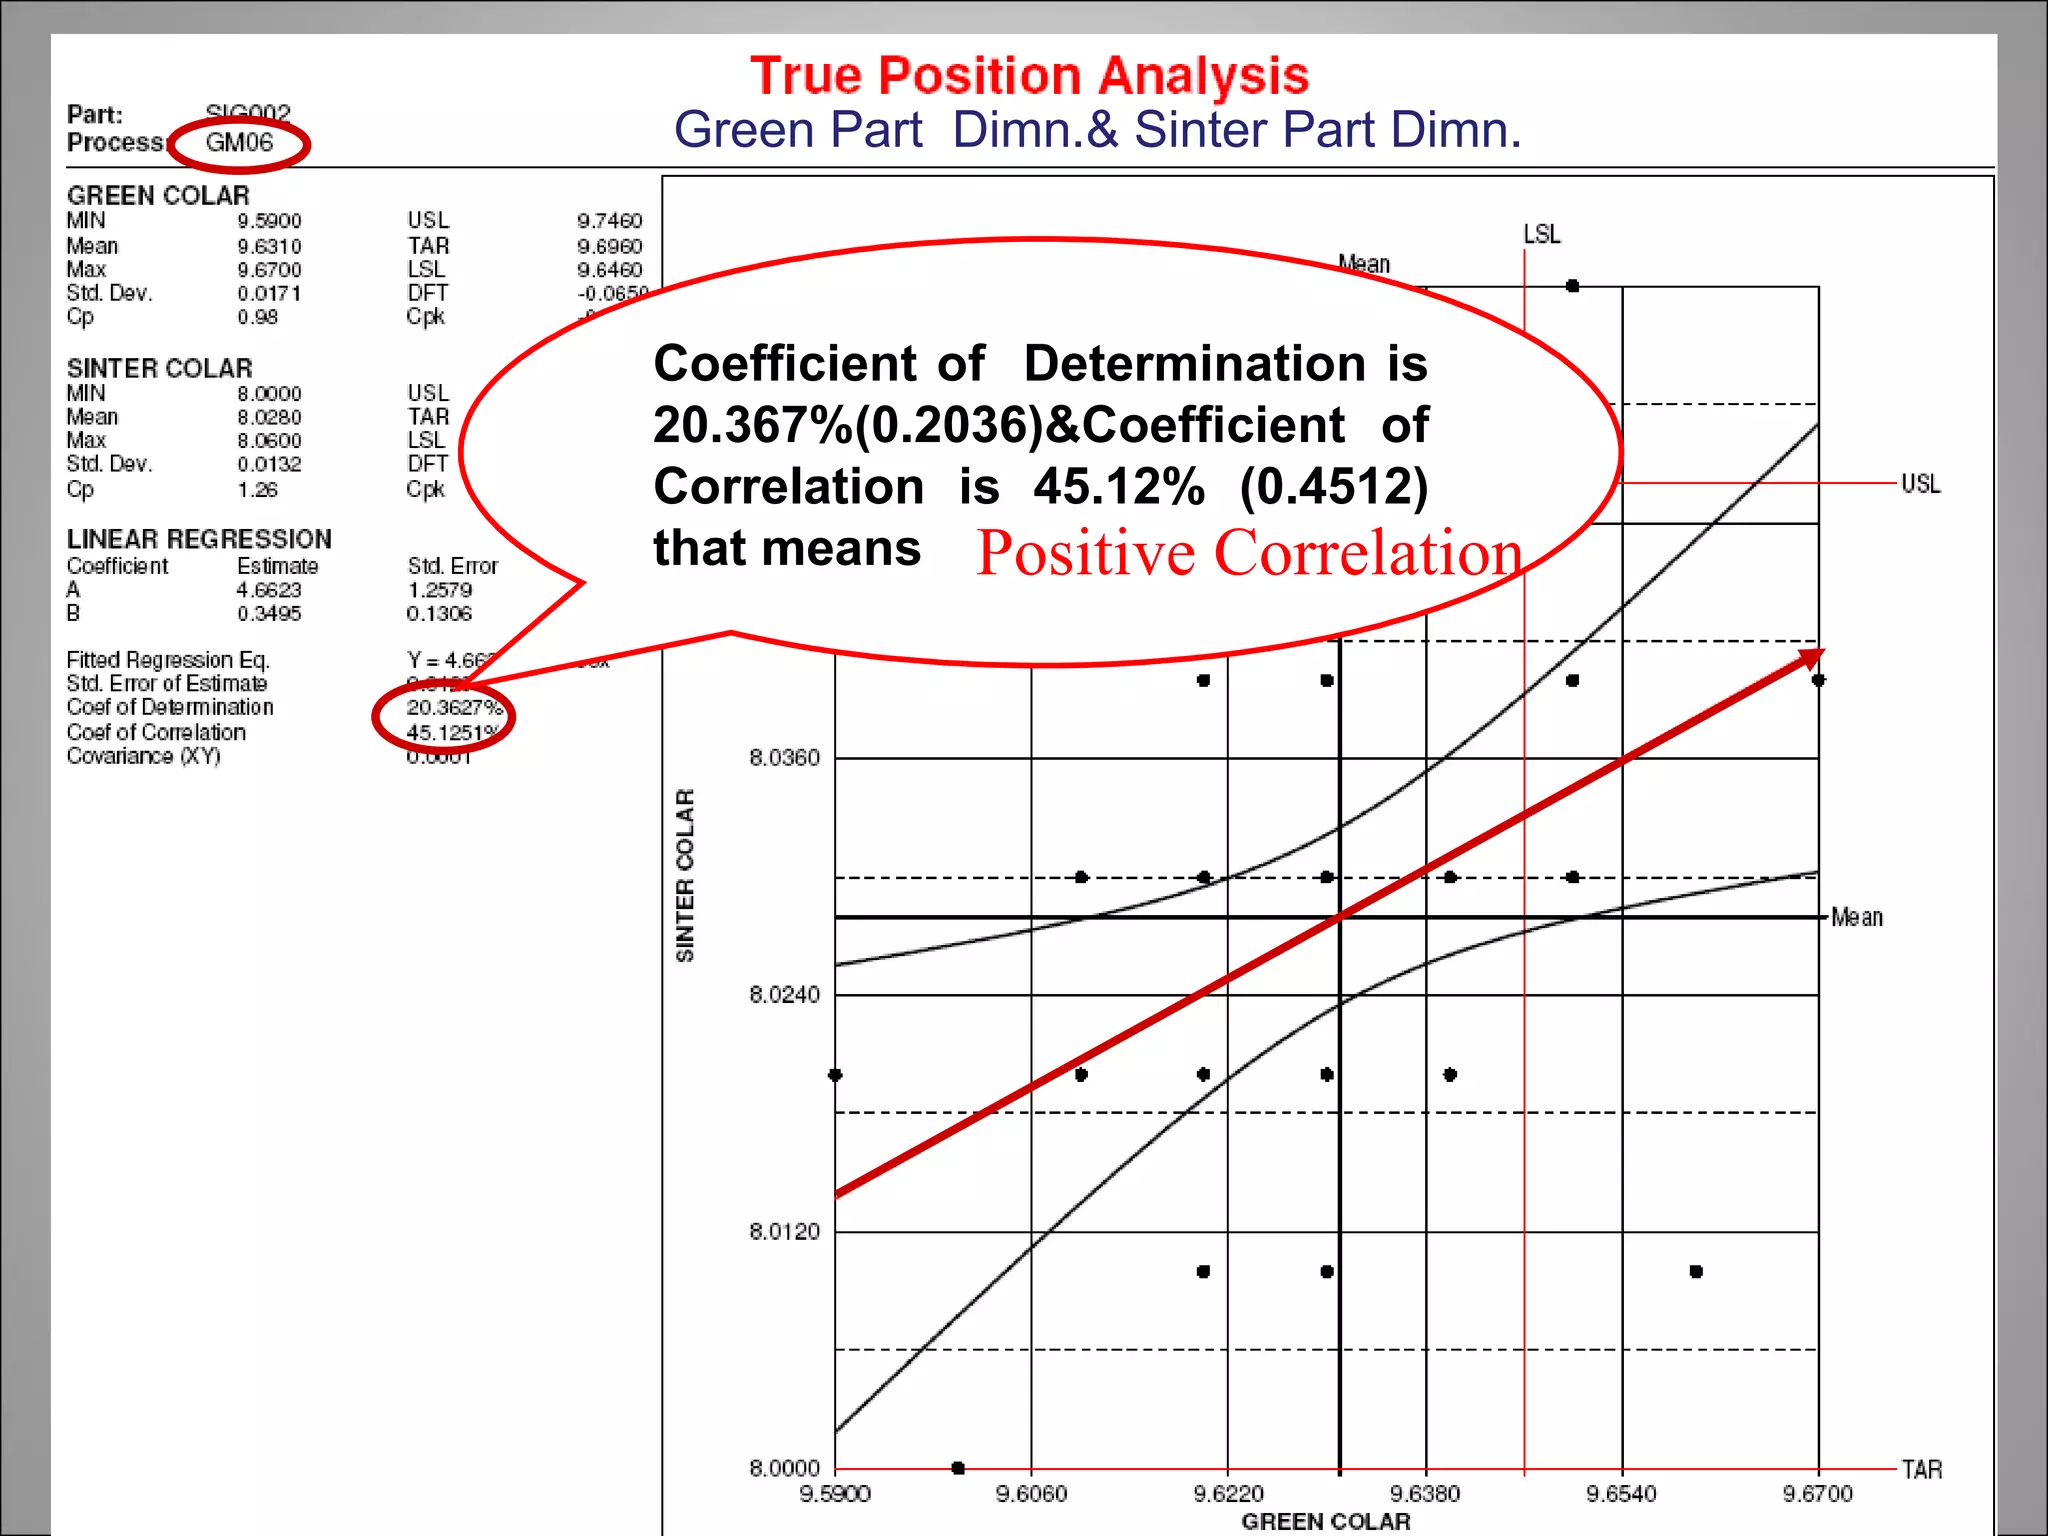
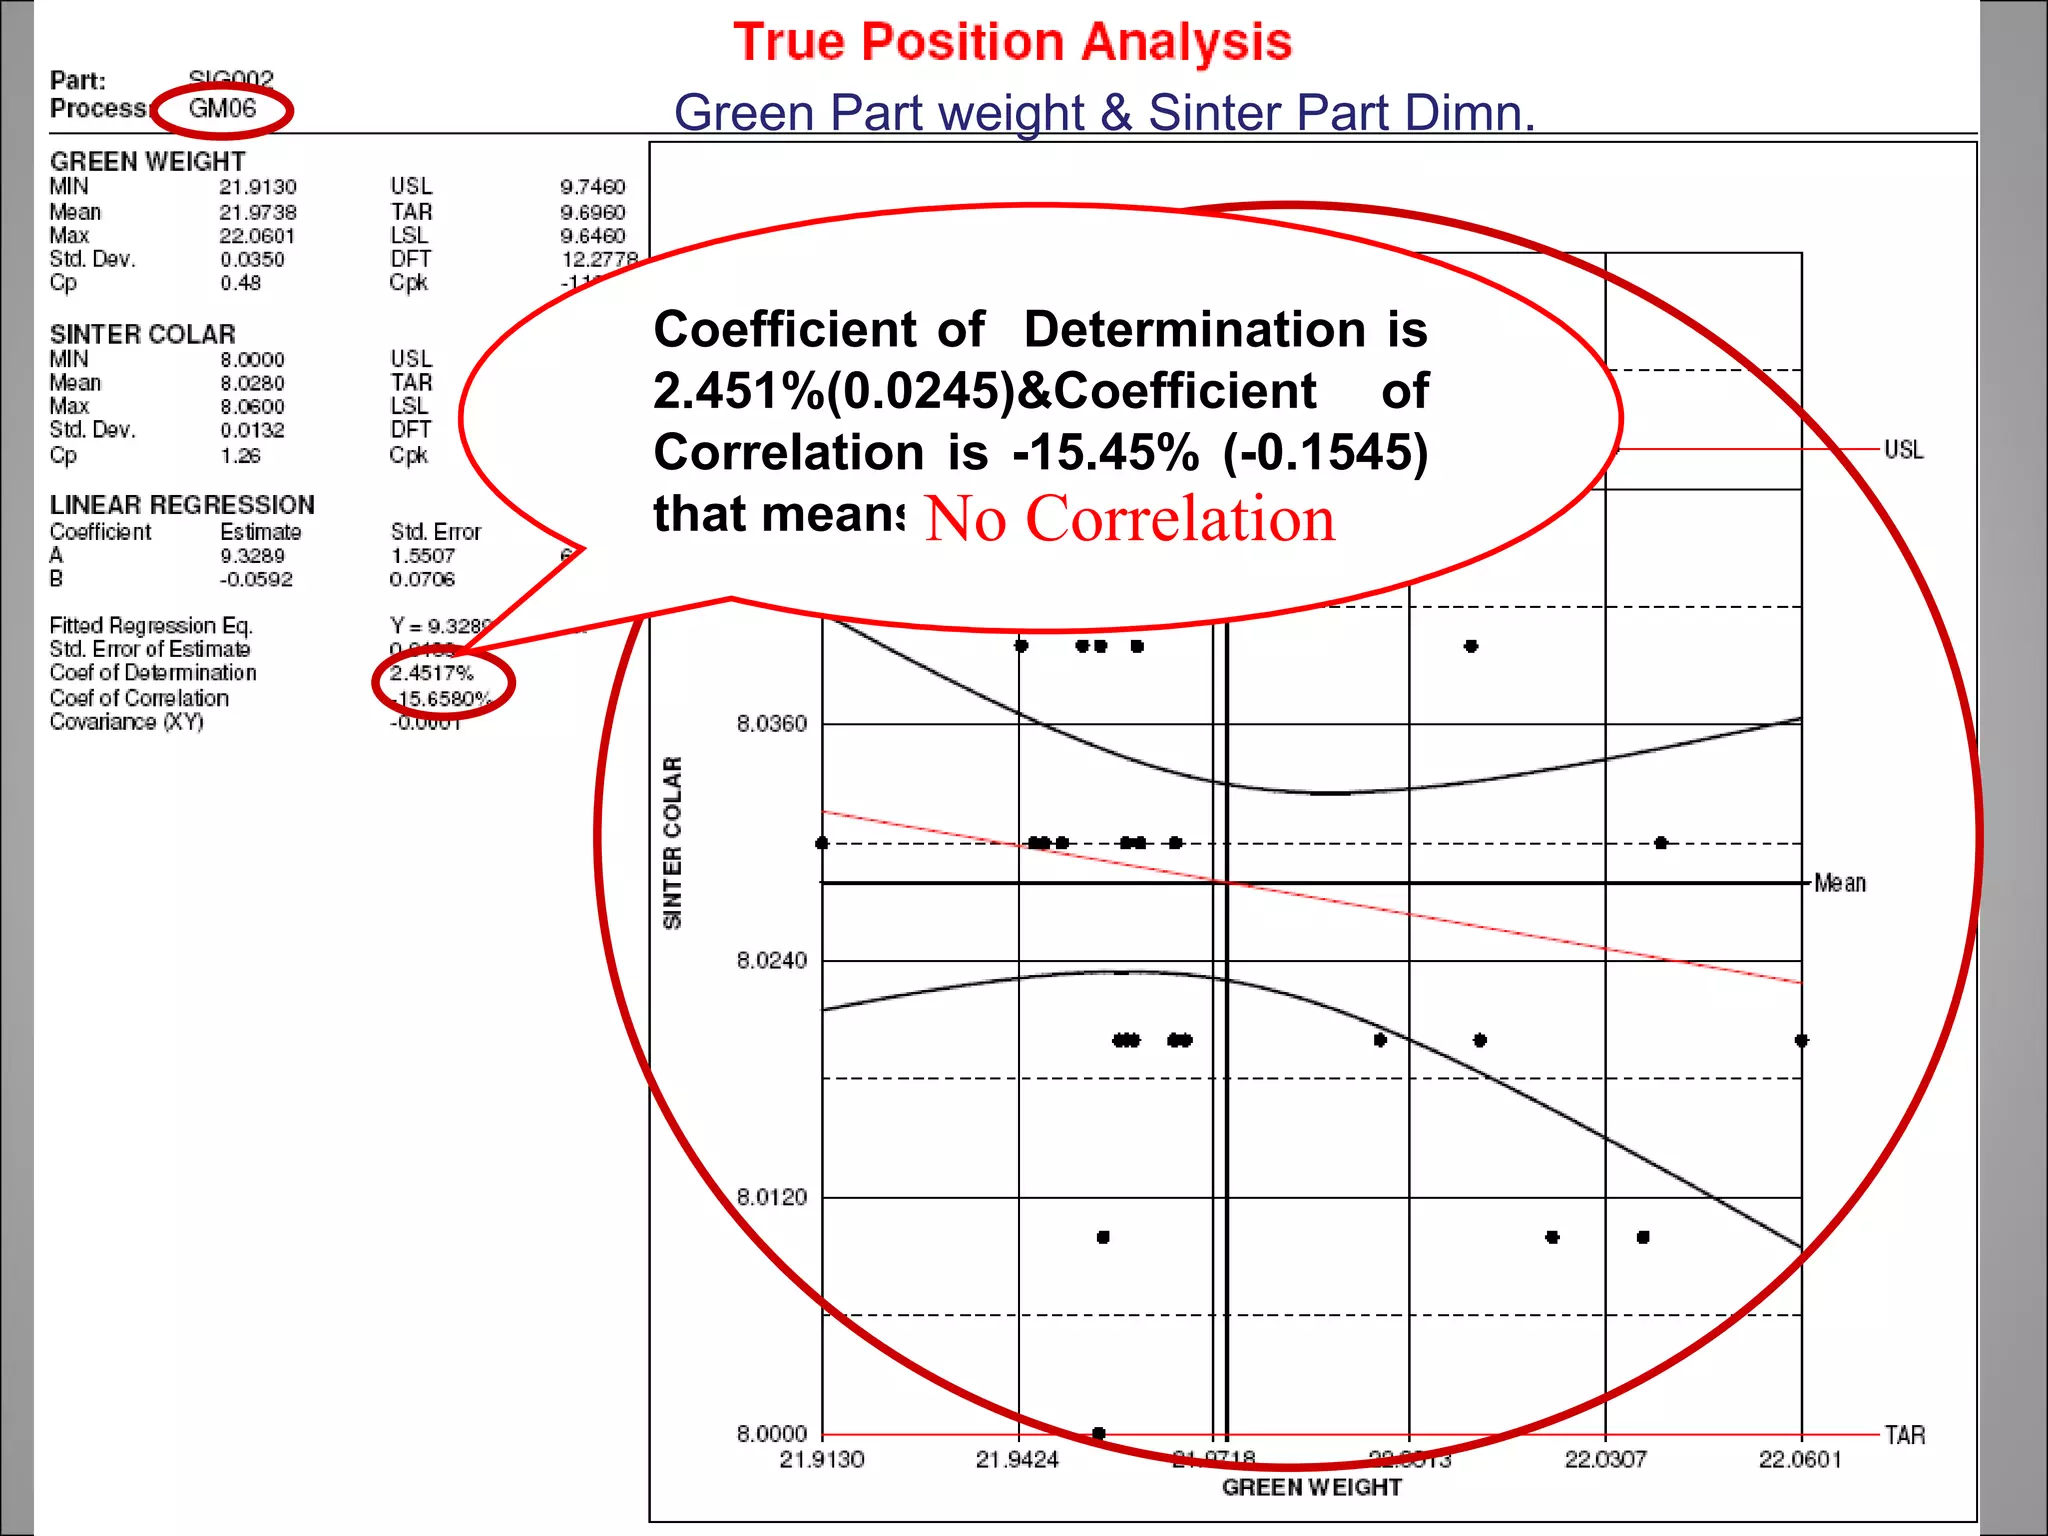
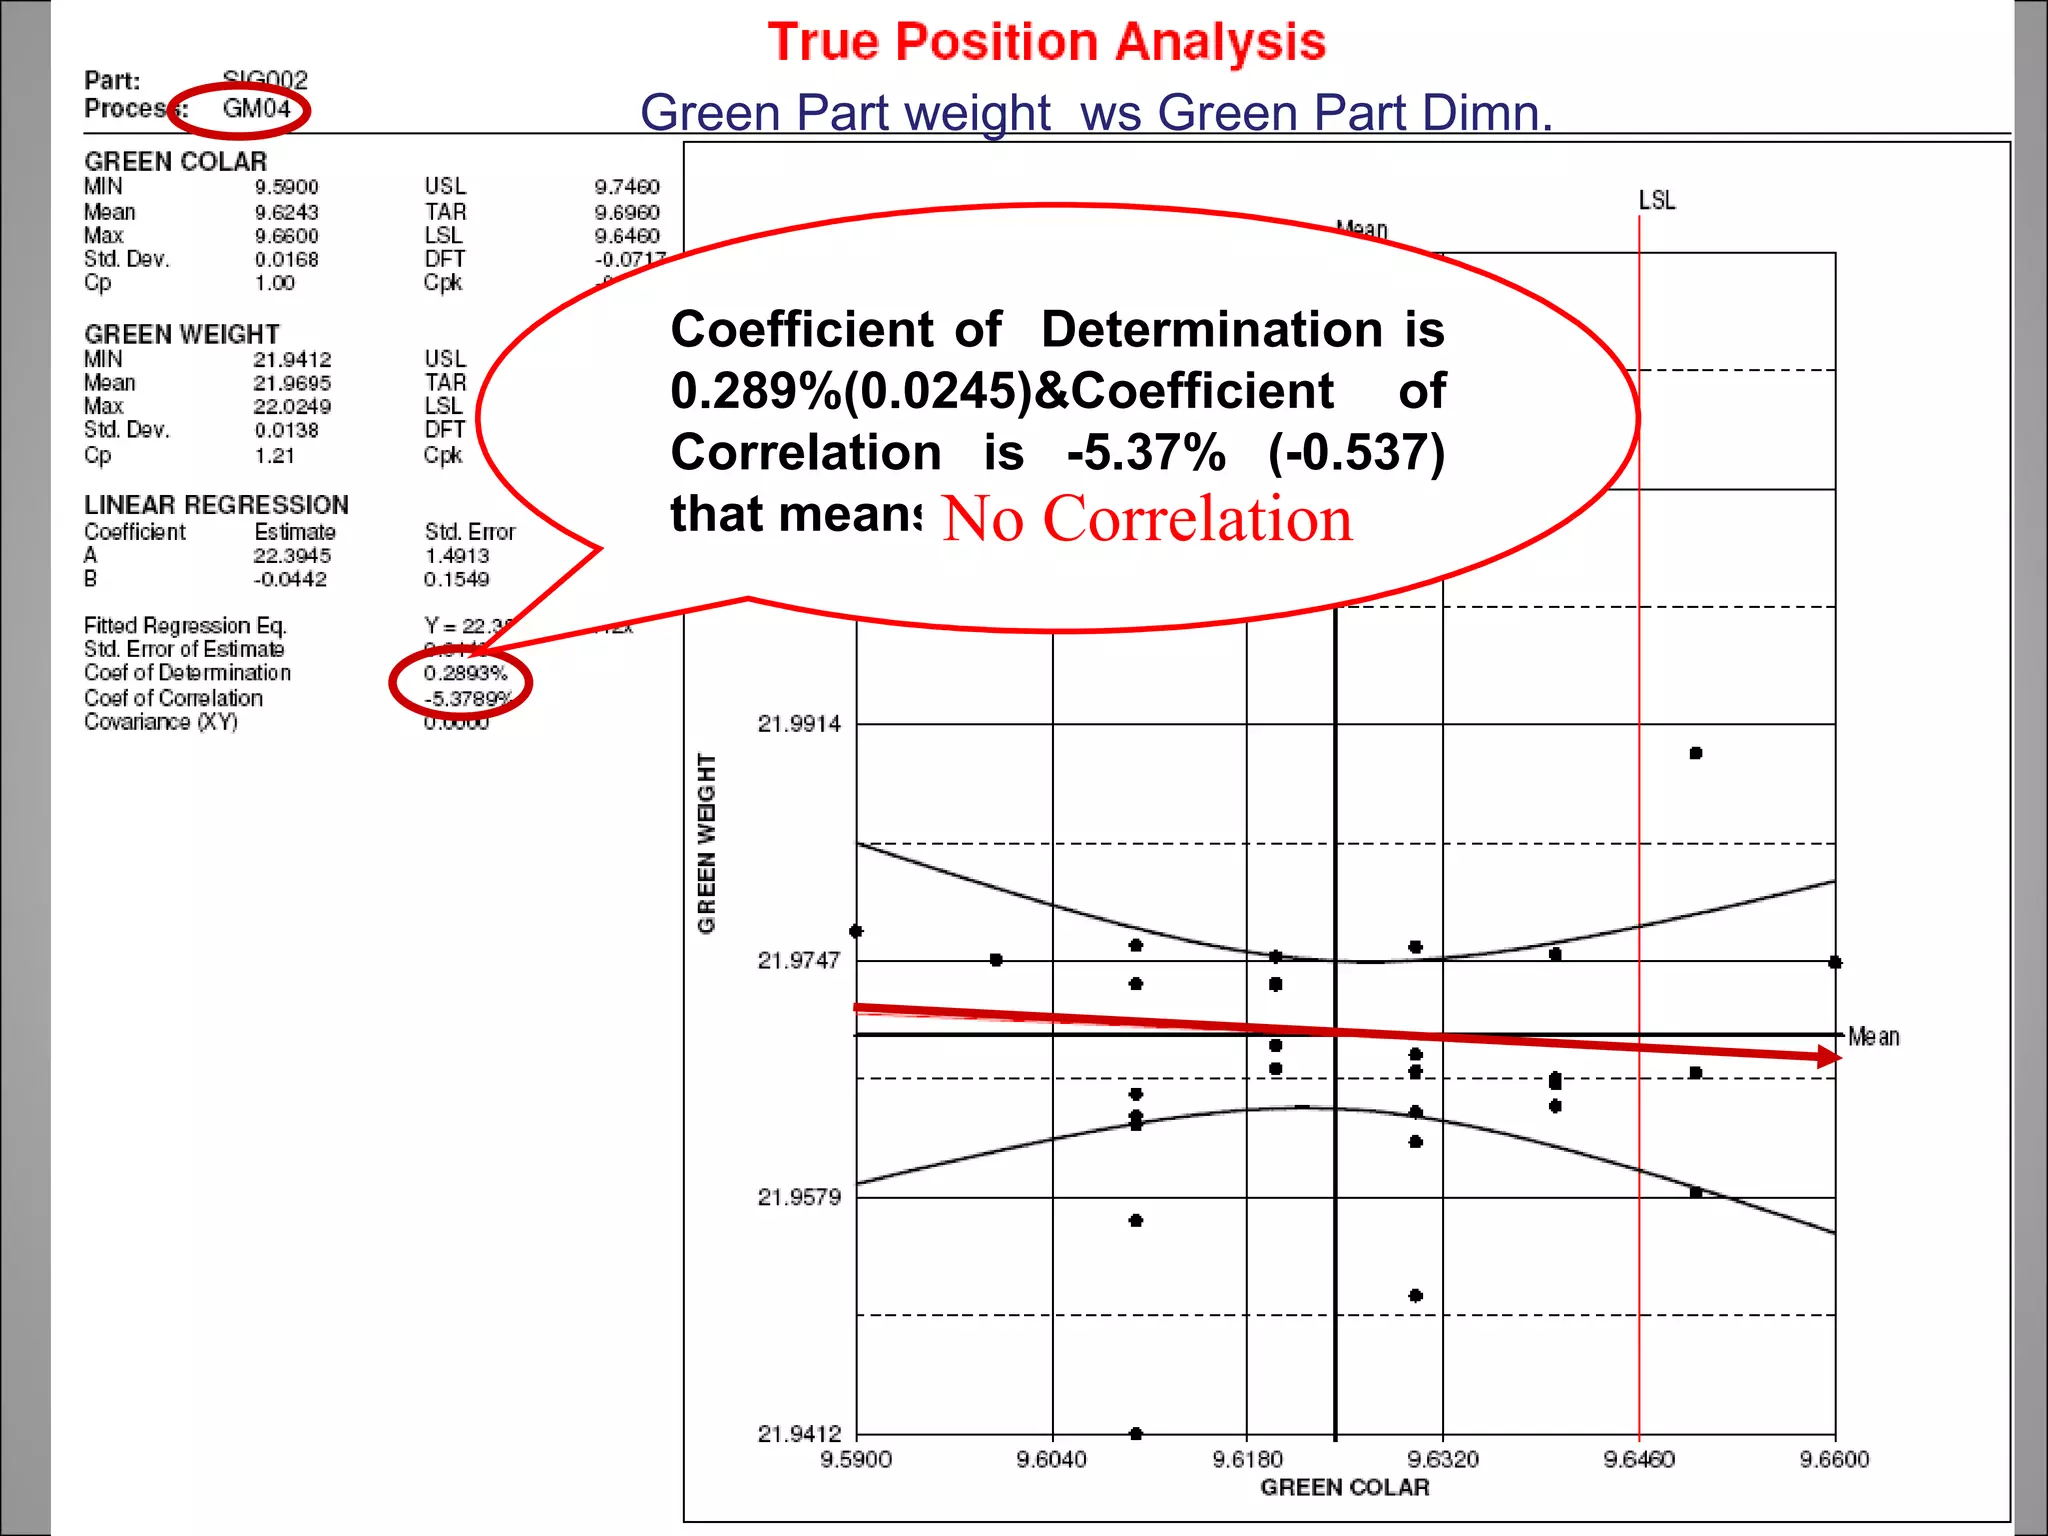
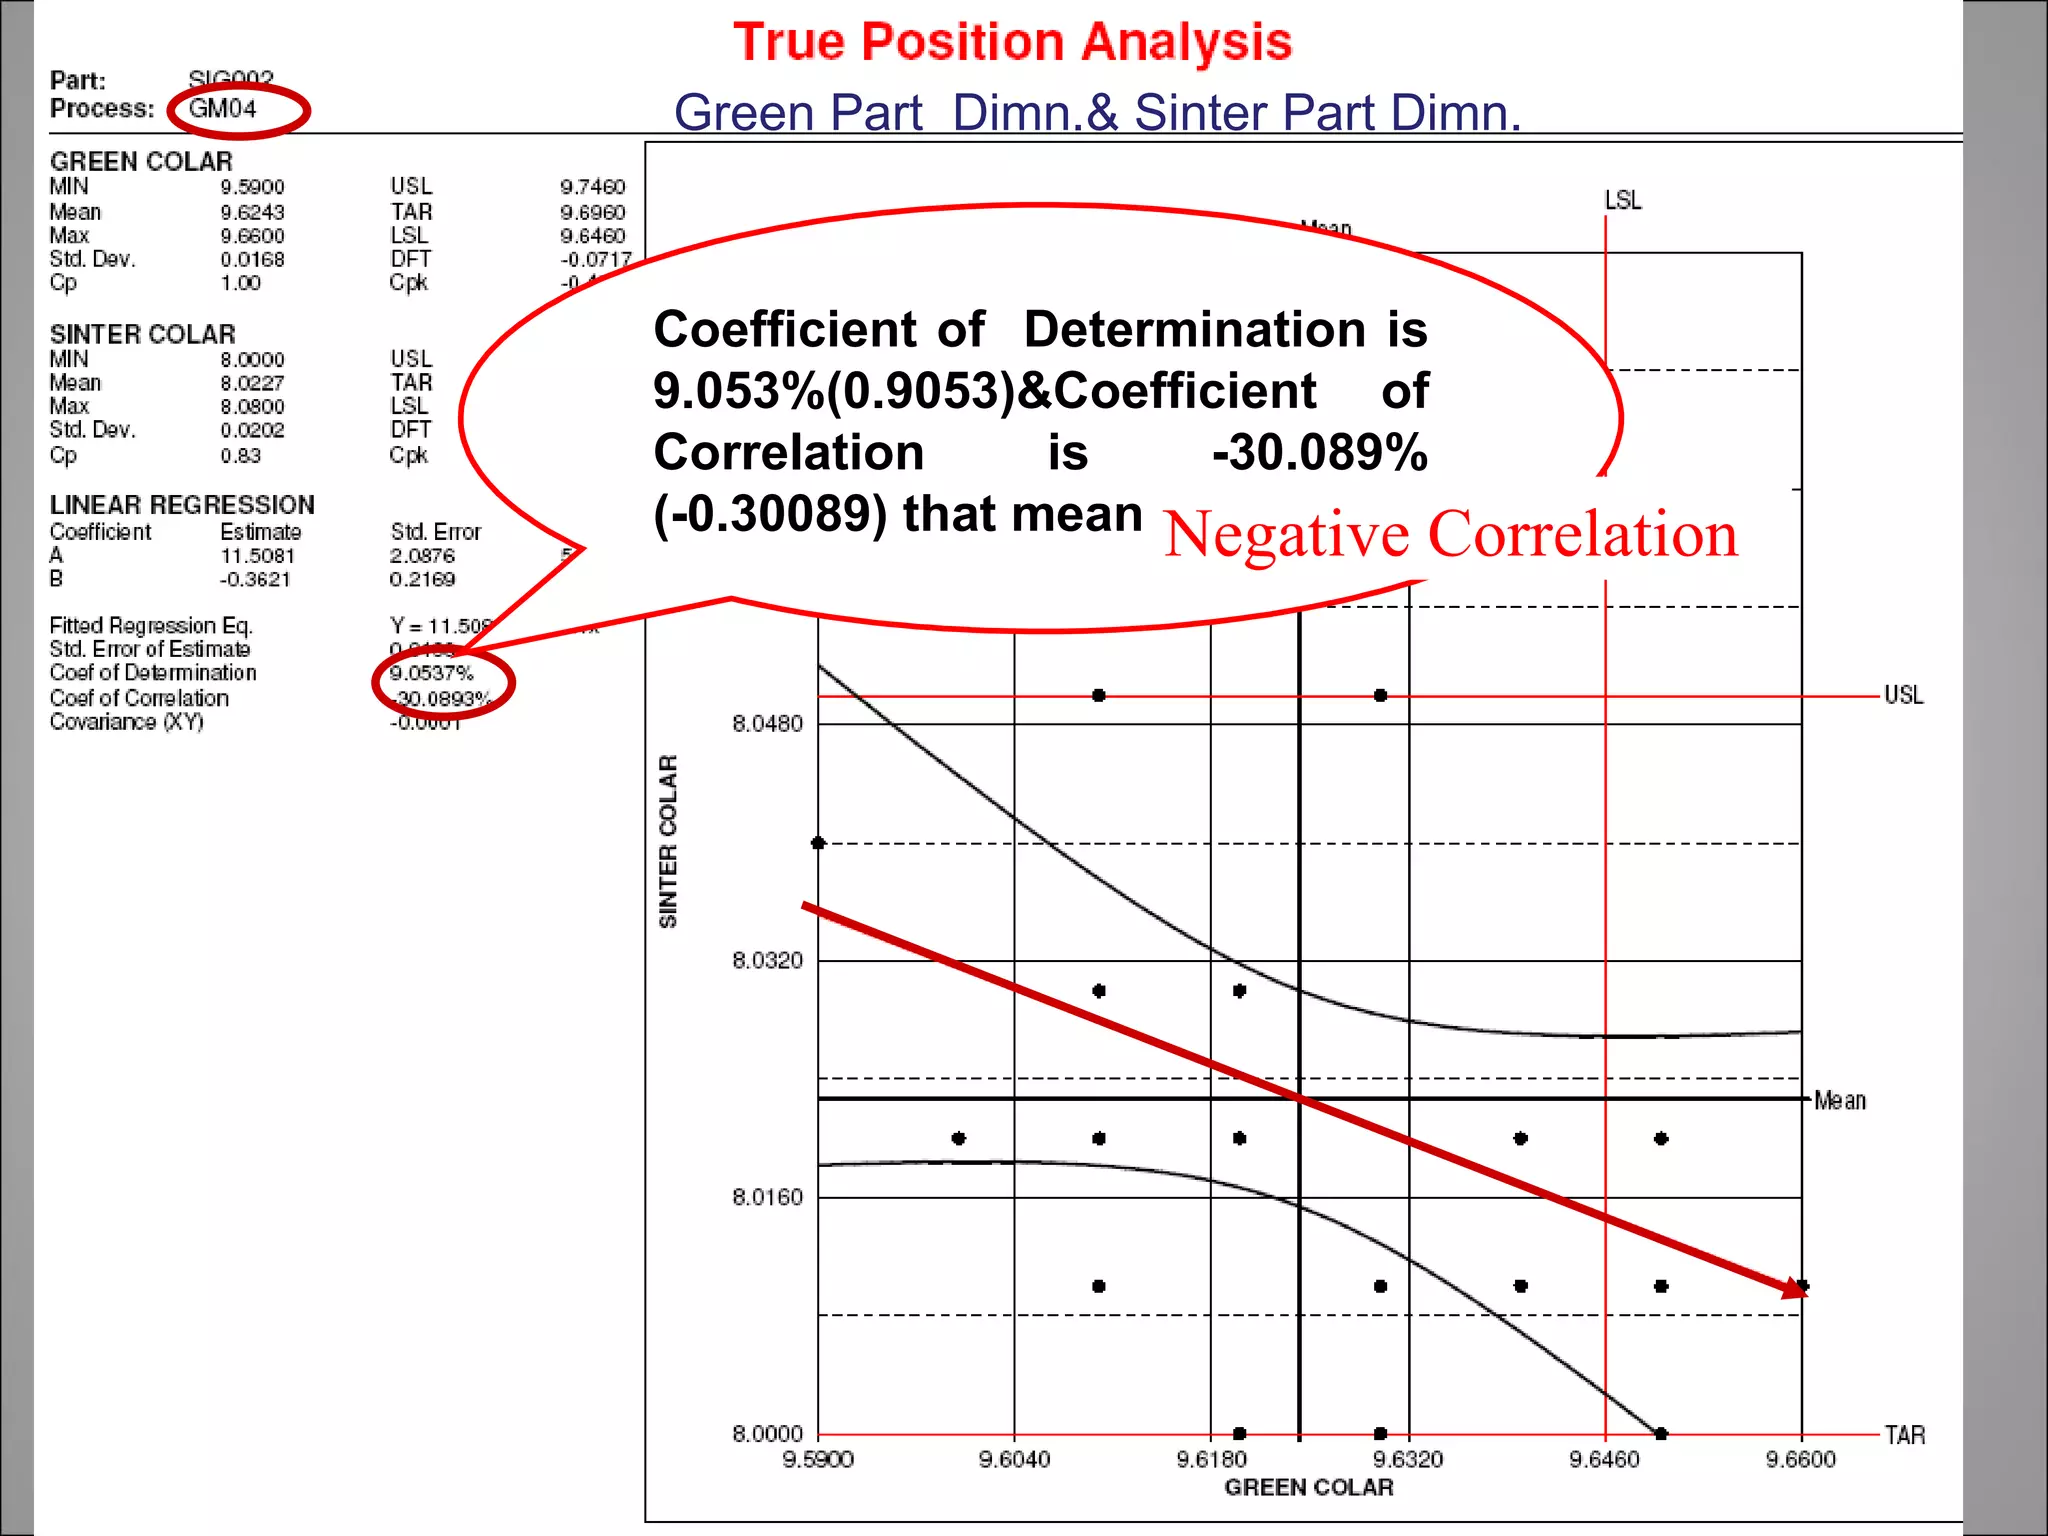
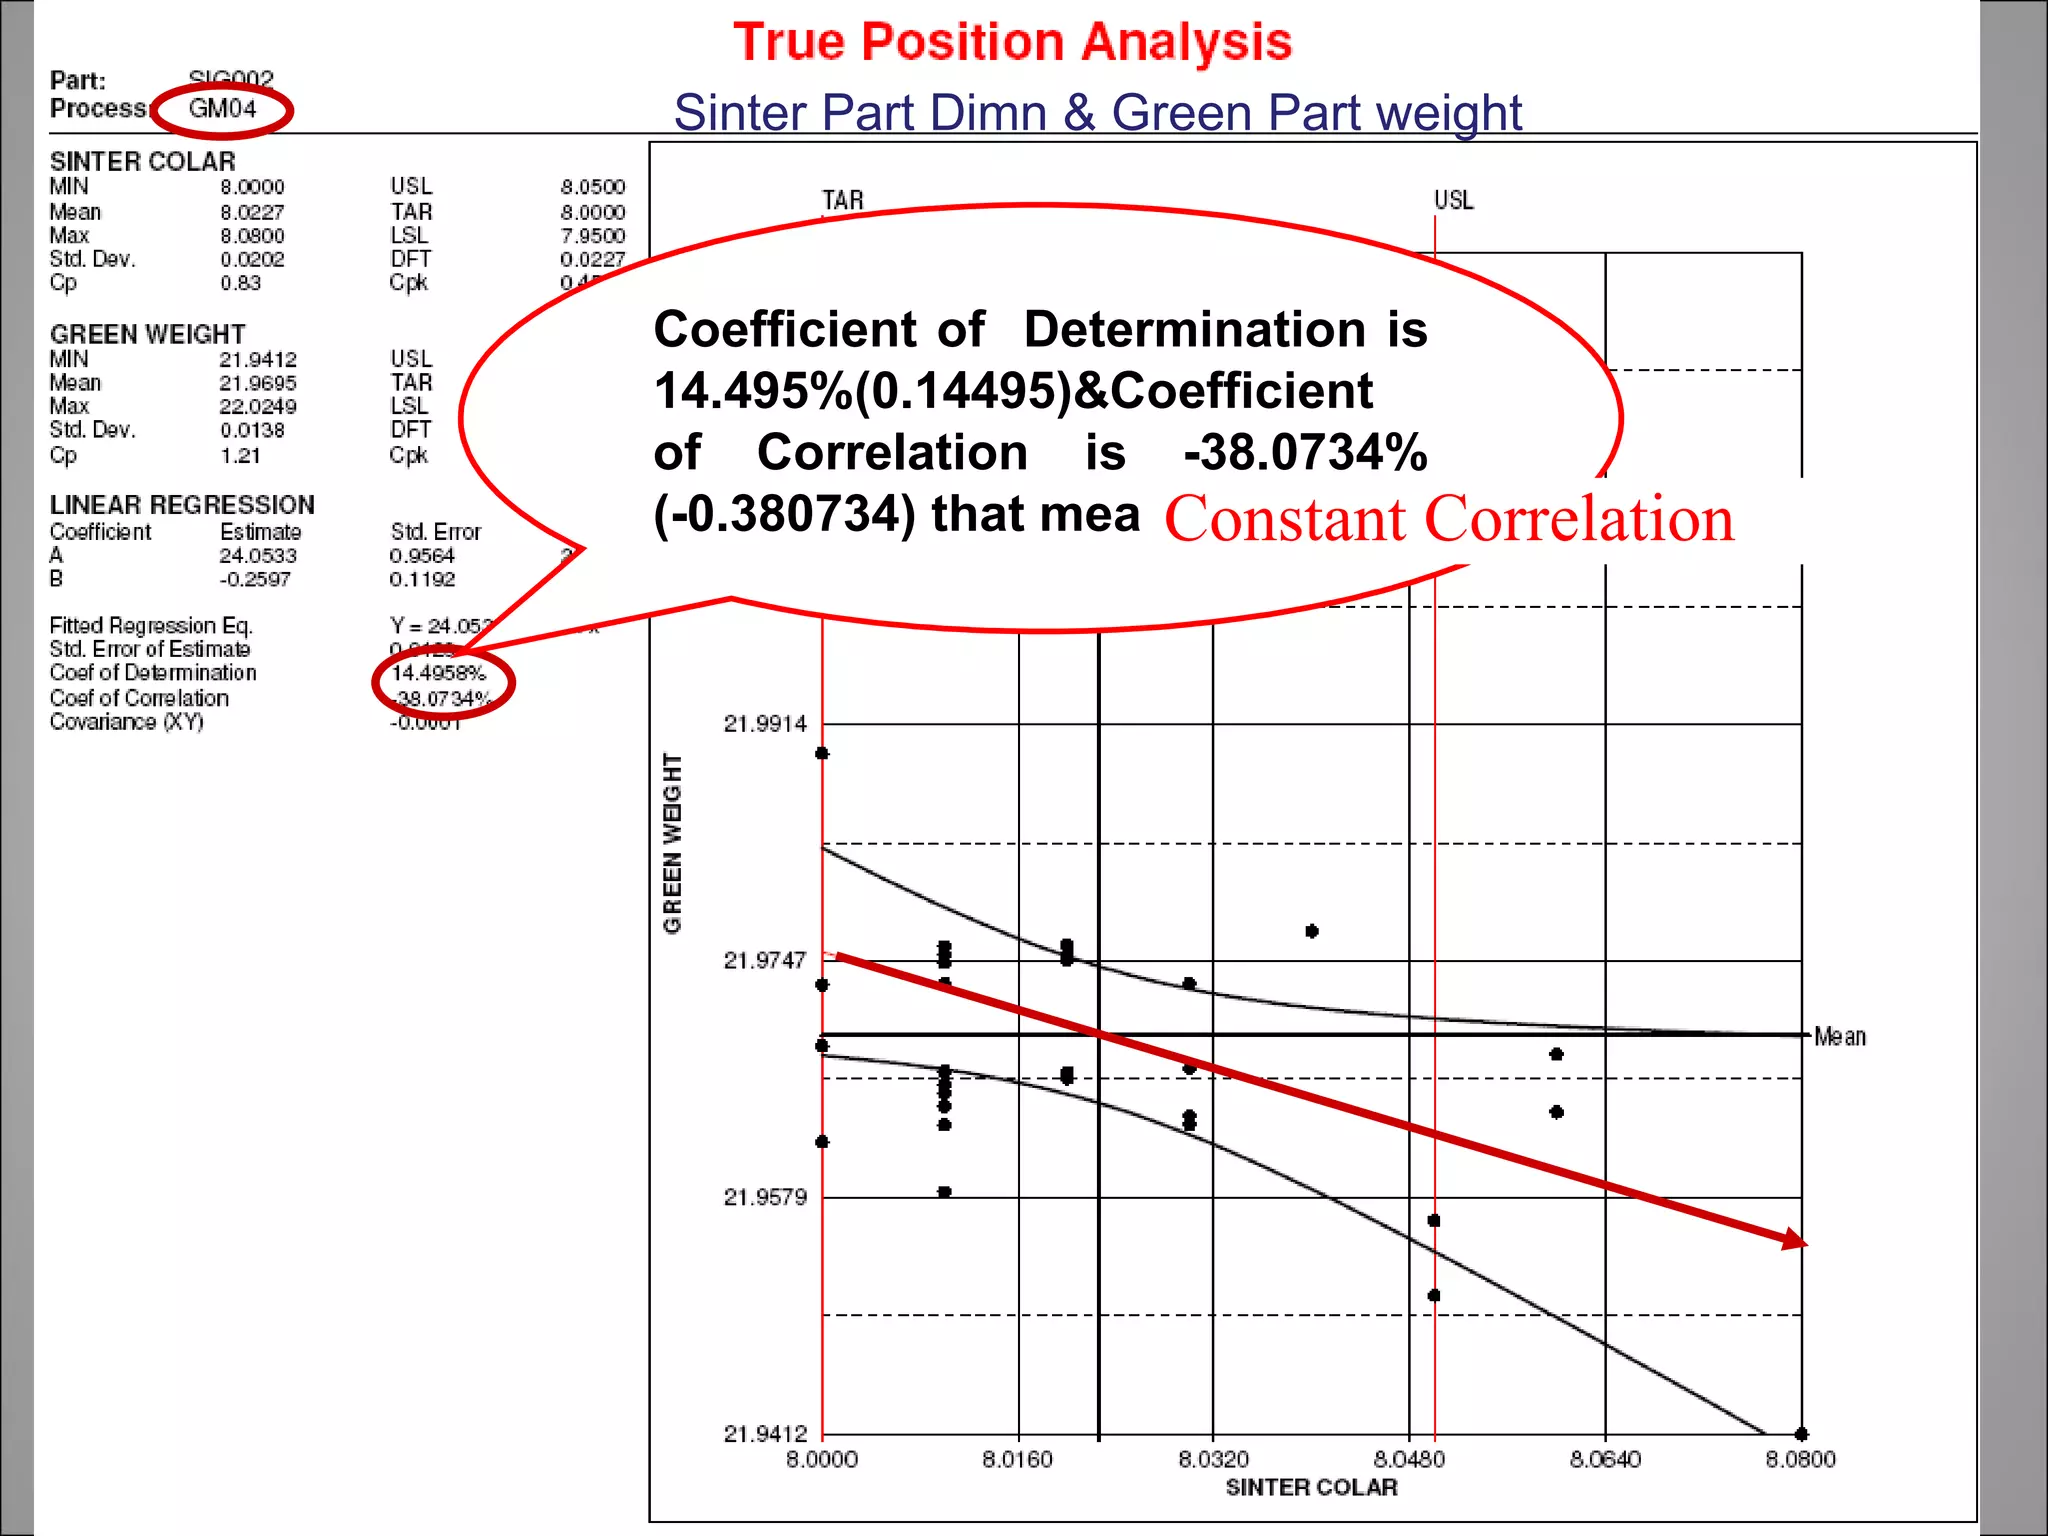
Sintering Variation

Objective: Determine the correlation of a
     Green Dimn.ws Sinter Dimn.
                  (or)
    Green weight ws Green Dimn.
Scatter Plot
• A scatter plot is a graph of a collection of
  ordered pairs (x,y).

• The graph looks like a bunch of dots, but some
  of the graphs are a general shape or move in a
  general direction.
The Coefficient of Correlation
• Measures the relative strength of the linear
  relationship between two variables (denoted by
  r) and Unit-less
• Ranges between –1 and 1
• The closer to –1, the stronger the negative linear
  relationship
• The closer to 1, the stronger the positive linear
  relationship
• The closer to 0, the weaker any positive linear
  relationship
Scatter Plots of Data with
            Various Correlation Coefficients
    Y                                           Y                                            Y


                                         X                                          X                  X
                 r = -1                                      r = -.6                             r=0
                                                                                             Y
  Y                                              Y


                                         X                                            X                X
                 r = +1                                       r = +.3                            r=0
Slide from: Statistics for Managers Using Microsoft® Excel 4th Edition, 2004 Prentice-Hall
Positive Correlation
• If the x-coordinates and the
  y-coordinates both
  increase, then it is
  POSITIVE CORRELATION.
• This means that both are
  going up, and they are
  related.
No Correlation
• If there seems to be
  no pattern, and the
  points looked
  scattered, then it is no
  correlation.

• This means the two
  are not related.
Negative Correlation
• If the x-coordinates and the y-
  coordinates have one
  increasing and one
  decreasing, then it is
  NEGATIVE CORRELATION.
• This means that 1 is going up
  and 1 is going down, making
  a downhill graph. This means
  the two are related as
  opposites.
The Coefficient of Determination

 The coefficient of determination (denoted by R2) is a key
output of regression analysis

•The coefficient of determination ranges from 0 to 1.

•An R2 of 0 means that the dependent variable cannot be
predicted from the independent variable.

•An R2 of 1 means the dependent variable can be predicted
without error from the independent variable.

•An R2 between 0 and 1 indicates the extent to which the
dependent variable is predictable
Scatterplots
     Which scatter plots below show a linear trend?
          No
a)    Correlation         c)       Negative      e)
                                   Correlation

                                                          Positive
                                                          Correlation


     r = -0.9&R2=0             r = -1&R2=1            r = 1&R2=1
                     f)

                               Constant
                               Correlation

                           r = 0&R2=0
Interval Estimates
        for Different Values of x
         Prediction Interval
         for an individual y,
y        given xp


                                         Confidence
                                         Interval for
    ∧      + b 1x                        the mean of
    y = b0                               y, given xp


                                              x
                                x   xp
Sintering Machine Variation
Green Part weight ws Green Part Dimn.


Coefficient of Determination is
0.1882%(0.001882)&Coefficient
of Correlation is-4.33% (-0.0433)
that means No Correlation
Green Part Dimn.& Sinter Part Dimn.


Coefficient of Determination is
20.367%(0.2036)&Coefficient of
Correlation is 45.12% (0.4512)
that means Positive Correlation
Green Part weight & Sinter Part Dimn.


Coefficient of Determination is
2.451%(0.0245)&Coefficient of
Correlation is -15.45% (-0.1545)
that means No Correlation
Green Part weight ws Green Part Dimn.


 Coefficient of Determination is
 0.289%(0.0245)&Coefficient of
 Correlation is -5.37% (-0.537)
 that means No Correlation
Green Part Dimn.& Sinter Part Dimn.


Coefficient of Determination is
9.053%(0.9053)&Coefficient of
Correlation      is   -30.089%
(-0.30089) that meansNegative Correlation
Sinter Part Dimn & Green Part weight


Coefficient of Determination is
14.495%(0.14495)&Coefficient
of Correlation is -38.0734%
                     Constant Correlation
(-0.380734) that means

Scatter plot

  • 1.
    Sintering Variation Objective: Determinethe correlation of a Green Dimn.ws Sinter Dimn. (or) Green weight ws Green Dimn.
  • 2.
    Scatter Plot • Ascatter plot is a graph of a collection of ordered pairs (x,y). • The graph looks like a bunch of dots, but some of the graphs are a general shape or move in a general direction.
  • 3.
    The Coefficient ofCorrelation • Measures the relative strength of the linear relationship between two variables (denoted by r) and Unit-less • Ranges between –1 and 1 • The closer to –1, the stronger the negative linear relationship • The closer to 1, the stronger the positive linear relationship • The closer to 0, the weaker any positive linear relationship
  • 4.
    Scatter Plots ofData with Various Correlation Coefficients Y Y Y X X X r = -1 r = -.6 r=0 Y Y Y X X X r = +1 r = +.3 r=0 Slide from: Statistics for Managers Using Microsoft® Excel 4th Edition, 2004 Prentice-Hall
  • 5.
    Positive Correlation • Ifthe x-coordinates and the y-coordinates both increase, then it is POSITIVE CORRELATION. • This means that both are going up, and they are related.
  • 6.
    No Correlation • Ifthere seems to be no pattern, and the points looked scattered, then it is no correlation. • This means the two are not related.
  • 7.
    Negative Correlation • Ifthe x-coordinates and the y- coordinates have one increasing and one decreasing, then it is NEGATIVE CORRELATION. • This means that 1 is going up and 1 is going down, making a downhill graph. This means the two are related as opposites.
  • 8.
    The Coefficient ofDetermination The coefficient of determination (denoted by R2) is a key output of regression analysis •The coefficient of determination ranges from 0 to 1. •An R2 of 0 means that the dependent variable cannot be predicted from the independent variable. •An R2 of 1 means the dependent variable can be predicted without error from the independent variable. •An R2 between 0 and 1 indicates the extent to which the dependent variable is predictable
  • 9.
    Scatterplots Which scatter plots below show a linear trend? No a) Correlation c) Negative e) Correlation Positive Correlation r = -0.9&R2=0 r = -1&R2=1 r = 1&R2=1 f) Constant Correlation r = 0&R2=0
  • 10.
    Interval Estimates for Different Values of x Prediction Interval for an individual y, y given xp Confidence Interval for ∧ + b 1x the mean of y = b0 y, given xp x x xp
  • 11.
  • 12.
    Green Part weightws Green Part Dimn. Coefficient of Determination is 0.1882%(0.001882)&Coefficient of Correlation is-4.33% (-0.0433) that means No Correlation
  • 13.
    Green Part Dimn.&Sinter Part Dimn. Coefficient of Determination is 20.367%(0.2036)&Coefficient of Correlation is 45.12% (0.4512) that means Positive Correlation
  • 14.
    Green Part weight& Sinter Part Dimn. Coefficient of Determination is 2.451%(0.0245)&Coefficient of Correlation is -15.45% (-0.1545) that means No Correlation
  • 15.
    Green Part weightws Green Part Dimn. Coefficient of Determination is 0.289%(0.0245)&Coefficient of Correlation is -5.37% (-0.537) that means No Correlation
  • 16.
    Green Part Dimn.&Sinter Part Dimn. Coefficient of Determination is 9.053%(0.9053)&Coefficient of Correlation is -30.089% (-0.30089) that meansNegative Correlation
  • 17.
    Sinter Part Dimn& Green Part weight Coefficient of Determination is 14.495%(0.14495)&Coefficient of Correlation is -38.0734% Constant Correlation (-0.380734) that means