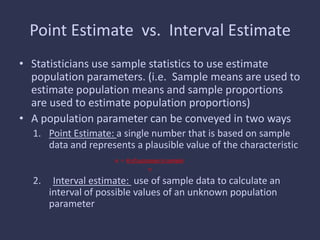
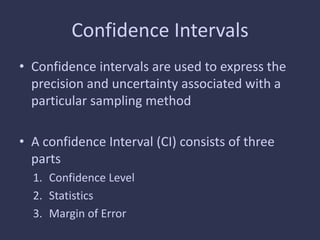
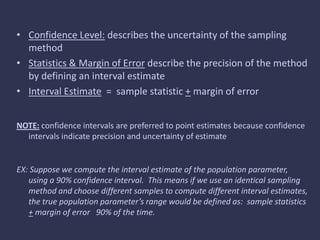
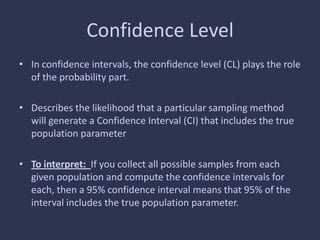
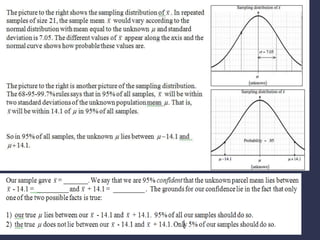
Properties of Point
Estimators
Point Estimate vs. Interval Estimate
• Statisticians use sample statistics to use estimate
population parameters. (i.e. Sample means are used to
estimate population means and sample proportions
are used to estimate population proportions)
• A population parameter can be conveyed in two ways
1. Point Estimate: a single number that is based on sample
data and represents a plausible value of the characteristic
p = # of successes in sample
n
2. Interval estimate: use of sample data to calculate an
interval of possible values of an unknown population
parameter
Confidence Intervals
• Confidence intervals are used to express the
precision and uncertainty associated with a
particular sampling method
• A confidence Interval (CI) consists of three
parts
1. Confidence Level
2. Statistics
3. Margin of Error
• Confidence Level: describes the uncertainty of the sampling
method
• Statistics & Margin of Error describe the precision of the method
by defining an interval estimate
• Interval Estimate = sample statistic + margin of error
NOTE: confidence intervals are preferred to point estimates because confidence
intervals indicate precision and uncertainty of estimate
EX: Suppose we compute the interval estimate of the population parameter,
using a 90% confidence interval. This means if we use an identical sampling
method and choose different samples to compute different interval estimates,
the true population parameter’s range would be defined as: sample statistics
+ margin of error 90% of the time.
Confidence Level
• In confidence intervals, the confidence level (CL) plays the role
of the probability part.
• Describes the likelihood that a particular sampling method
will generate a Confidence Interval (CI) that includes the true
population parameter
• To interpret: If you collect all possible samples from each
given population and compute the confidence intervals for
each, then a 95% confidence interval means that 95% of the
interval includes the true population parameter.
Margin of Error
• Margin of Error: the range of values above and below the
sample statistic in a confidence interval
• EX: If a survey is given to your student body and it reports
that 70% of students choose English as their favorite subject,
then you can state that the survey had a 10% margin of error
and confidence level of 90% which results in a confidence
interval of being 90% confident that English will receive
between 60% and 80% of the vote.
Bias/ Unbiased
• Bias: A preference or an inclination, especially
one that inhibits impartial judgment.
• Unbiased: having no bias or prejudice (being
fair or impartial)
• Of a sample: not affected by an irrelevant factors,
variables or selectivity which influence it’s distribution;
random
• Of an estimator: having an expected value equal to the
parameter being estimated
Review of Variability
• Variability: spread in a set of data that can be described by summary
measures through means of range, interquartile range, variance and
standard deviation
• Range: difference between largest and smallest values in a set of data
• IQR= Q3 –Q1
• Variance (σ²) = Σ( xi – μ)
N
Standard Deviation (σ) = √(σ²)

A.1 properties of point estimators

  • 1.
  • 2.
    Point Estimate vs.Interval Estimate • Statisticians use sample statistics to use estimate population parameters. (i.e. Sample means are used to estimate population means and sample proportions are used to estimate population proportions) • A population parameter can be conveyed in two ways 1. Point Estimate: a single number that is based on sample data and represents a plausible value of the characteristic p = # of successes in sample n 2. Interval estimate: use of sample data to calculate an interval of possible values of an unknown population parameter
  • 3.
    Confidence Intervals • Confidenceintervals are used to express the precision and uncertainty associated with a particular sampling method • A confidence Interval (CI) consists of three parts 1. Confidence Level 2. Statistics 3. Margin of Error
  • 4.
    • Confidence Level:describes the uncertainty of the sampling method • Statistics & Margin of Error describe the precision of the method by defining an interval estimate • Interval Estimate = sample statistic + margin of error NOTE: confidence intervals are preferred to point estimates because confidence intervals indicate precision and uncertainty of estimate EX: Suppose we compute the interval estimate of the population parameter, using a 90% confidence interval. This means if we use an identical sampling method and choose different samples to compute different interval estimates, the true population parameter’s range would be defined as: sample statistics + margin of error 90% of the time.
  • 5.
    Confidence Level • Inconfidence intervals, the confidence level (CL) plays the role of the probability part. • Describes the likelihood that a particular sampling method will generate a Confidence Interval (CI) that includes the true population parameter • To interpret: If you collect all possible samples from each given population and compute the confidence intervals for each, then a 95% confidence interval means that 95% of the interval includes the true population parameter.
  • 7.
    Margin of Error •Margin of Error: the range of values above and below the sample statistic in a confidence interval • EX: If a survey is given to your student body and it reports that 70% of students choose English as their favorite subject, then you can state that the survey had a 10% margin of error and confidence level of 90% which results in a confidence interval of being 90% confident that English will receive between 60% and 80% of the vote.
  • 8.
    Bias/ Unbiased • Bias:A preference or an inclination, especially one that inhibits impartial judgment. • Unbiased: having no bias or prejudice (being fair or impartial) • Of a sample: not affected by an irrelevant factors, variables or selectivity which influence it’s distribution; random • Of an estimator: having an expected value equal to the parameter being estimated
  • 9.
    Review of Variability •Variability: spread in a set of data that can be described by summary measures through means of range, interquartile range, variance and standard deviation • Range: difference between largest and smallest values in a set of data • IQR= Q3 –Q1 • Variance (σ²) = Σ( xi – μ) N Standard Deviation (σ) = √(σ²)