Downloaded 36 times


![COMPUTING THE CORRELATION COEFFICIENT
separatelyvaryYandXwhichtodegree
thervary togeYandXwhichtodegree
r
]
)(
[]
)(
[
))((
2
2
2
2
NN
N
ss
COV
yx
xy
The ratio of the joint variation of X and Y (covariance) relative to the variation of X and Y
considered separately](https://image.slidesharecdn.com/correlation-160110061055/85/Correlation-Analysis-6-320.jpg)

![86.0856.0
088.81
375.69
]
12
)3.27(
13.69[]
12
)1503(
187,189[
12
)3.27(1503
7.3488
]
)(
[]
)(
[
))((
22
2
2
2
2
NN
Nr
COMMENT= The Correlation Is Here 0.86 For Among Student.](https://image.slidesharecdn.com/correlation-160110061055/85/Correlation-Analysis-8-320.jpg)


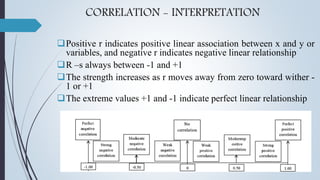
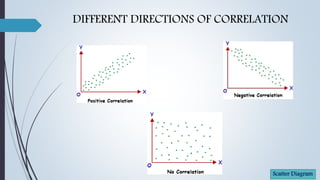
The document discusses correlation, defining it as a statistical technique for measuring the relationship between variables, specifically focusing on covariance and types of correlation. It outlines methods of studying correlation, interpretation of correlation coefficients, and highlights advantages and disadvantages of correlational studies. Additionally, it provides examples of real-life correlations and calculates the correlation coefficient and coefficient of determination in relation to IQ scores and GPA.


