Download as PDF, PPTX
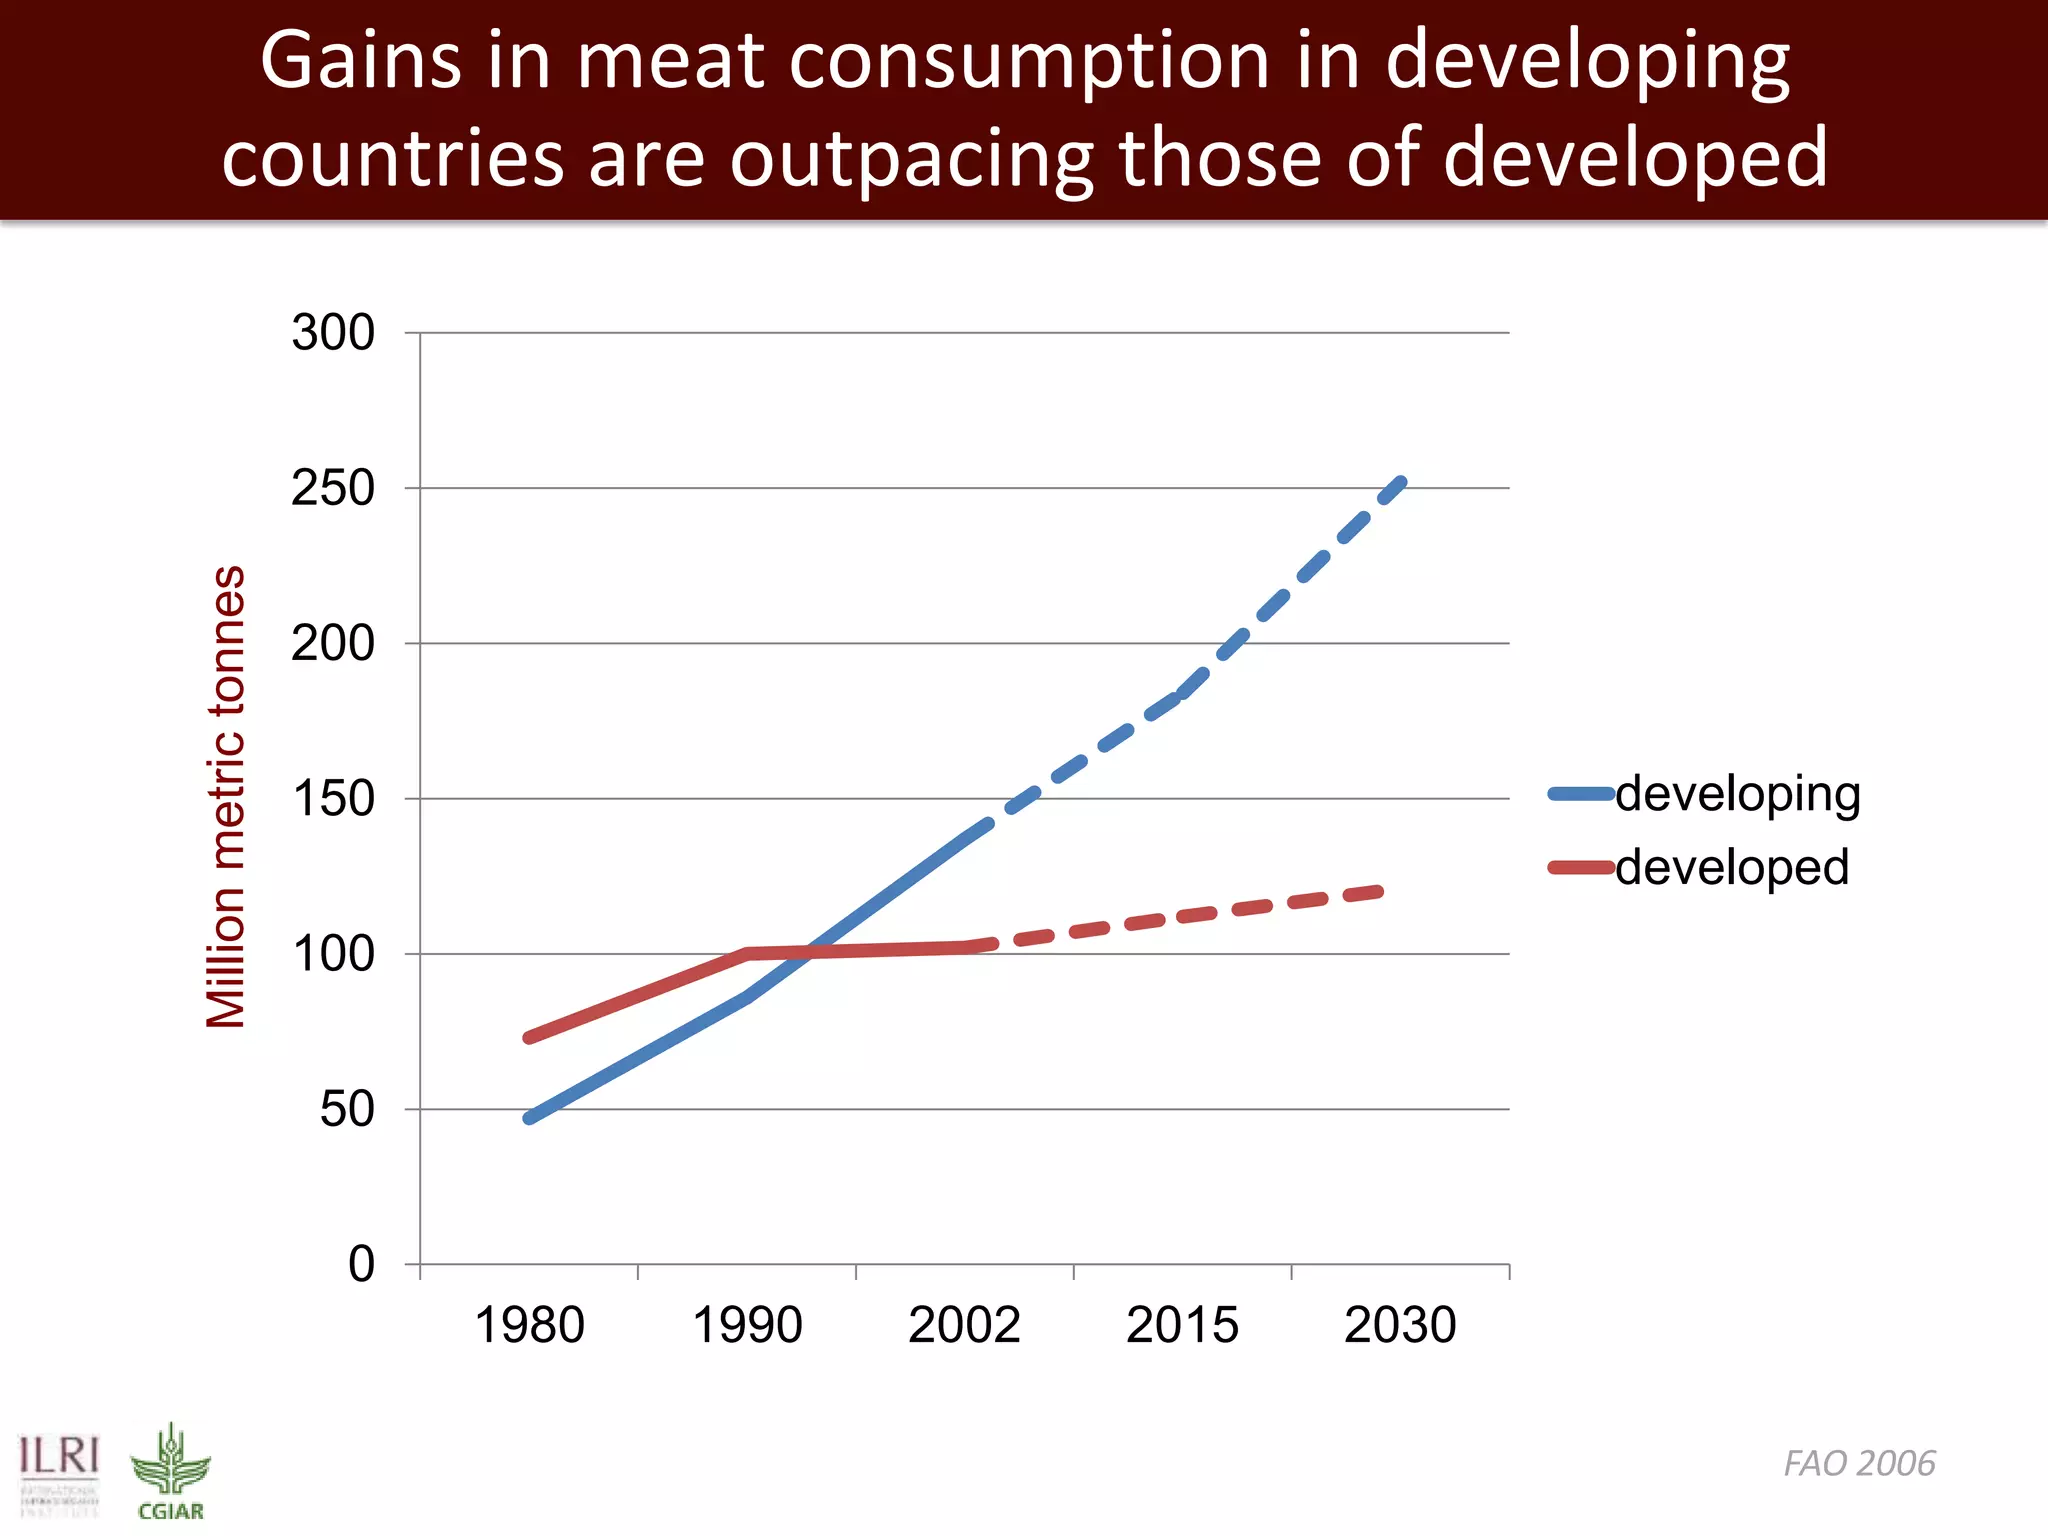
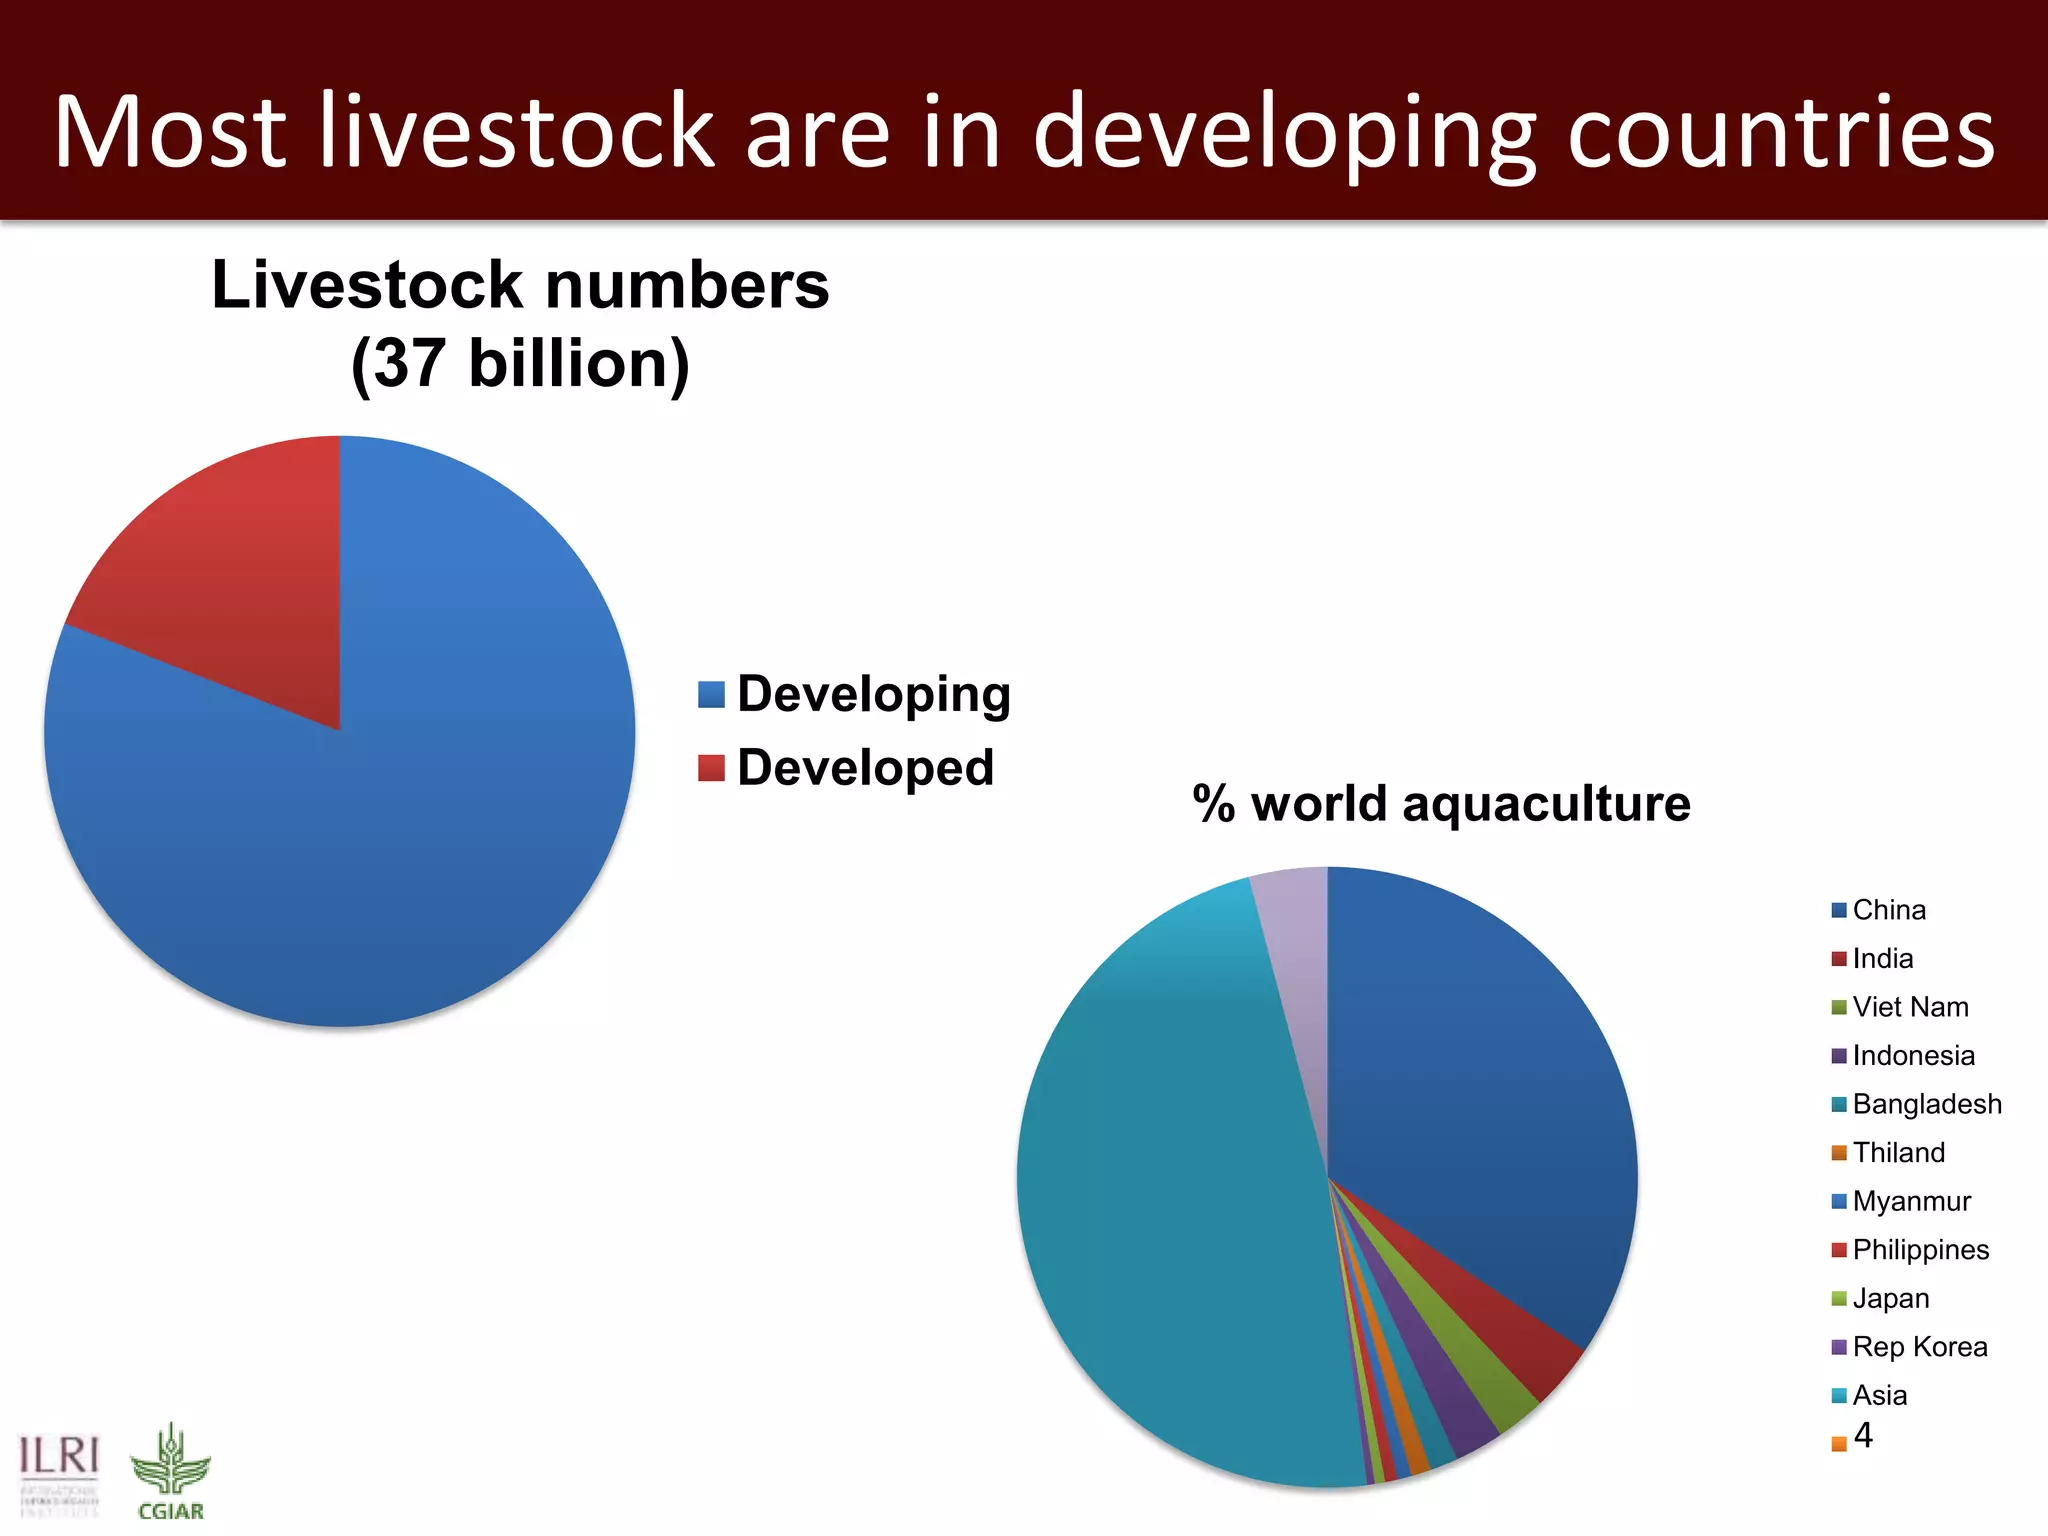
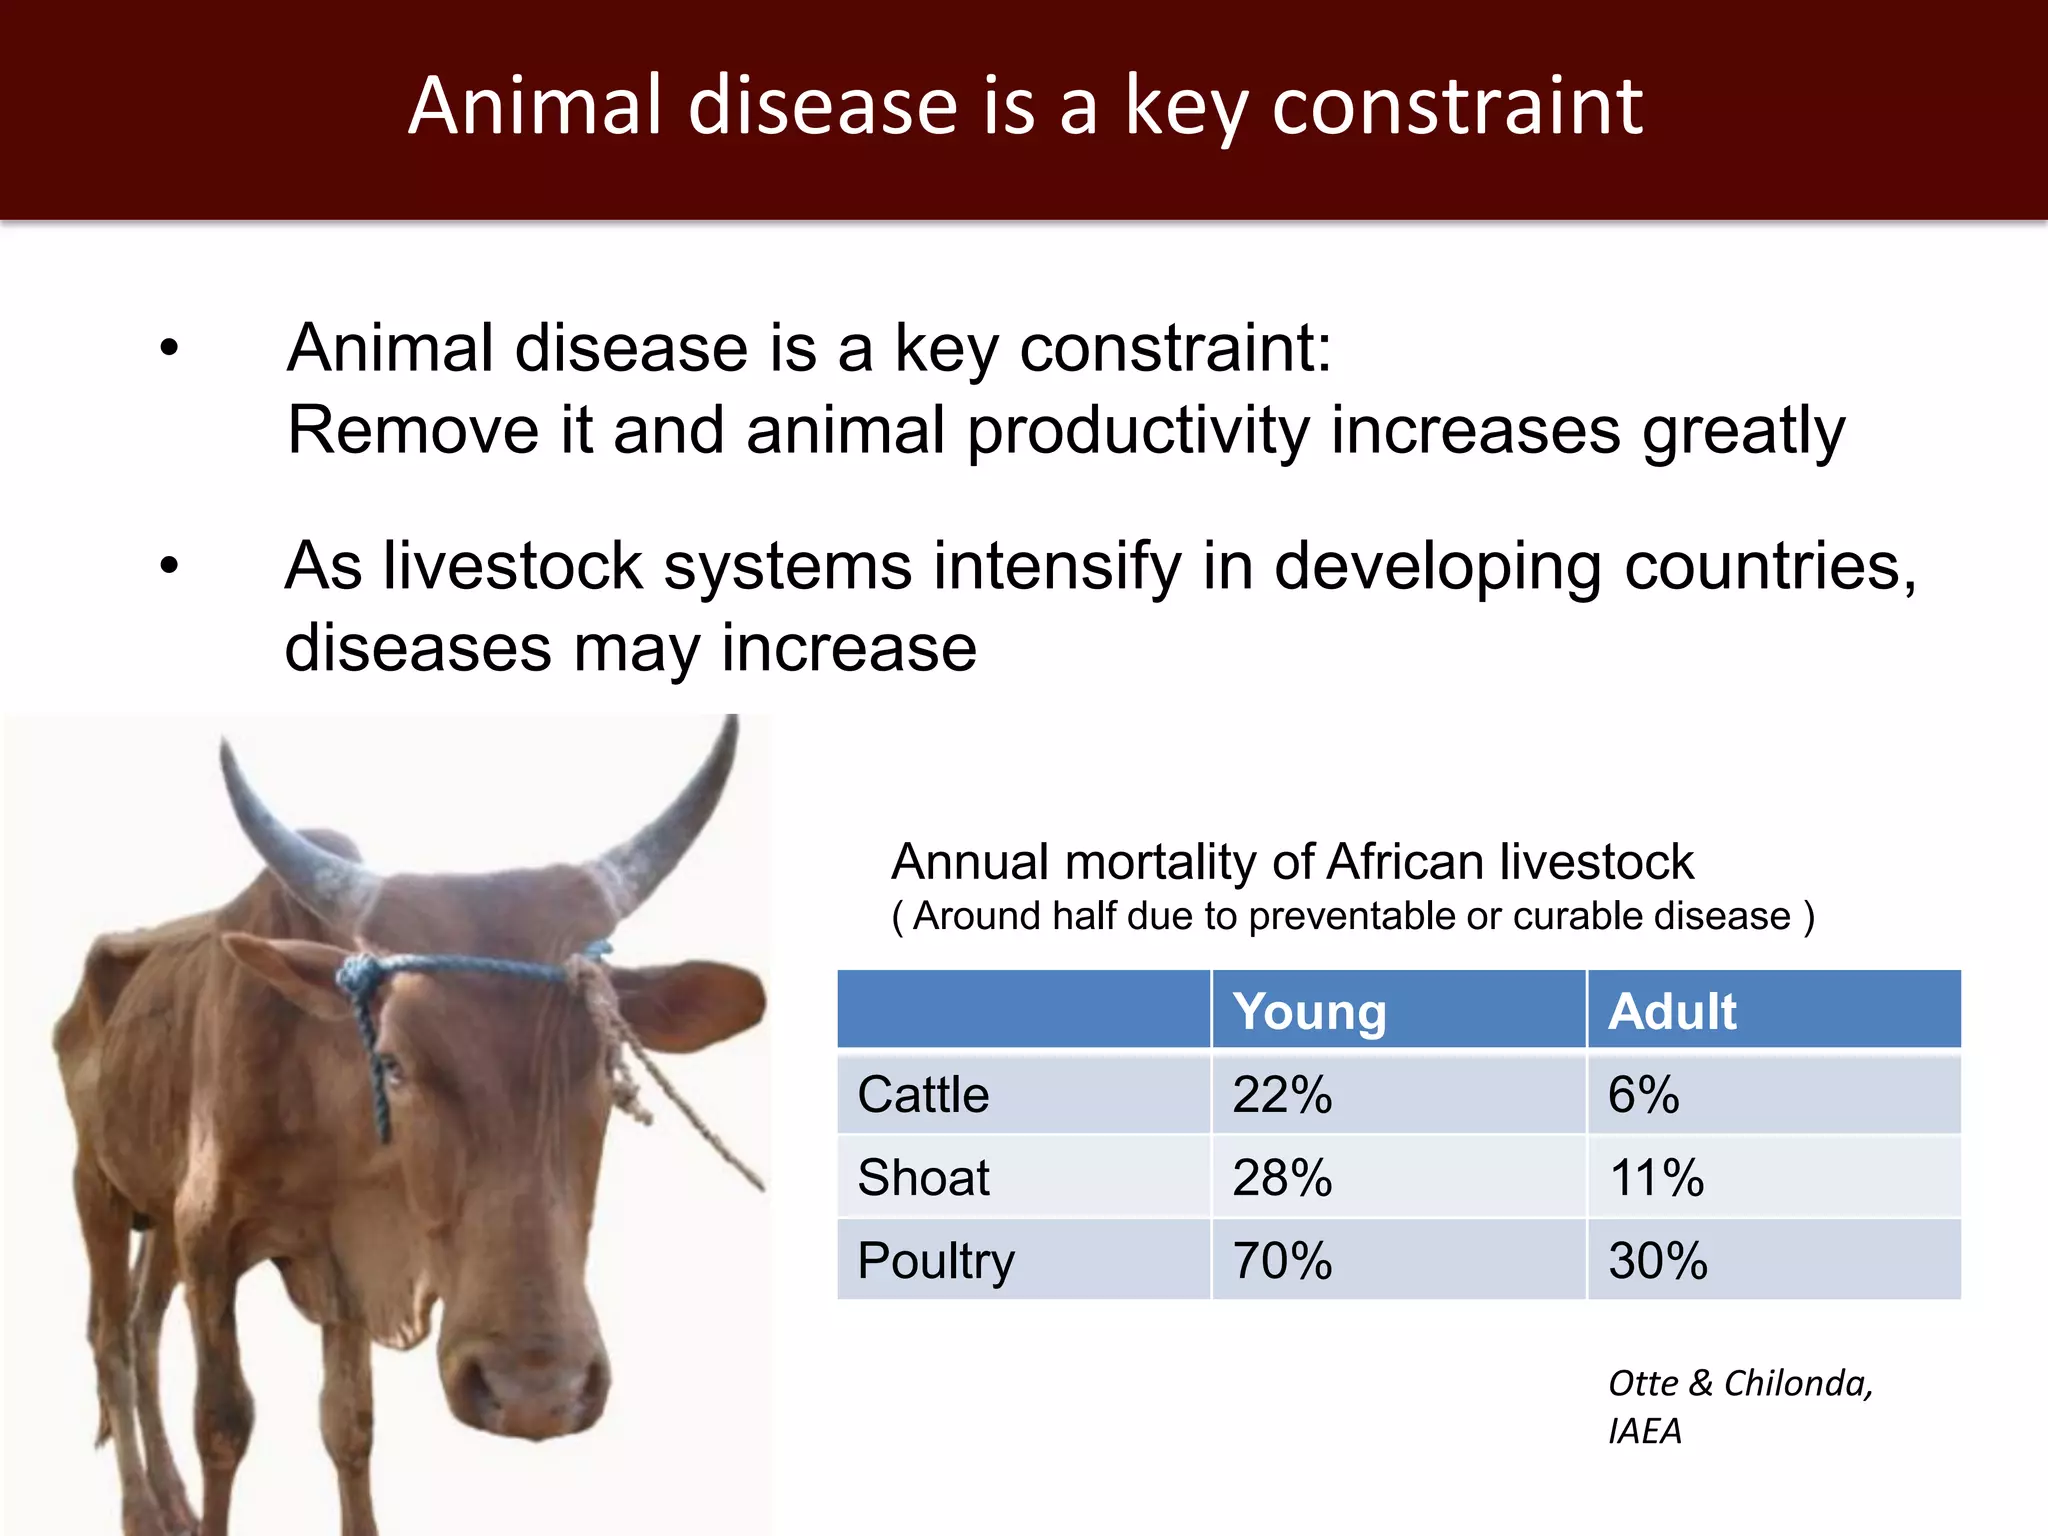
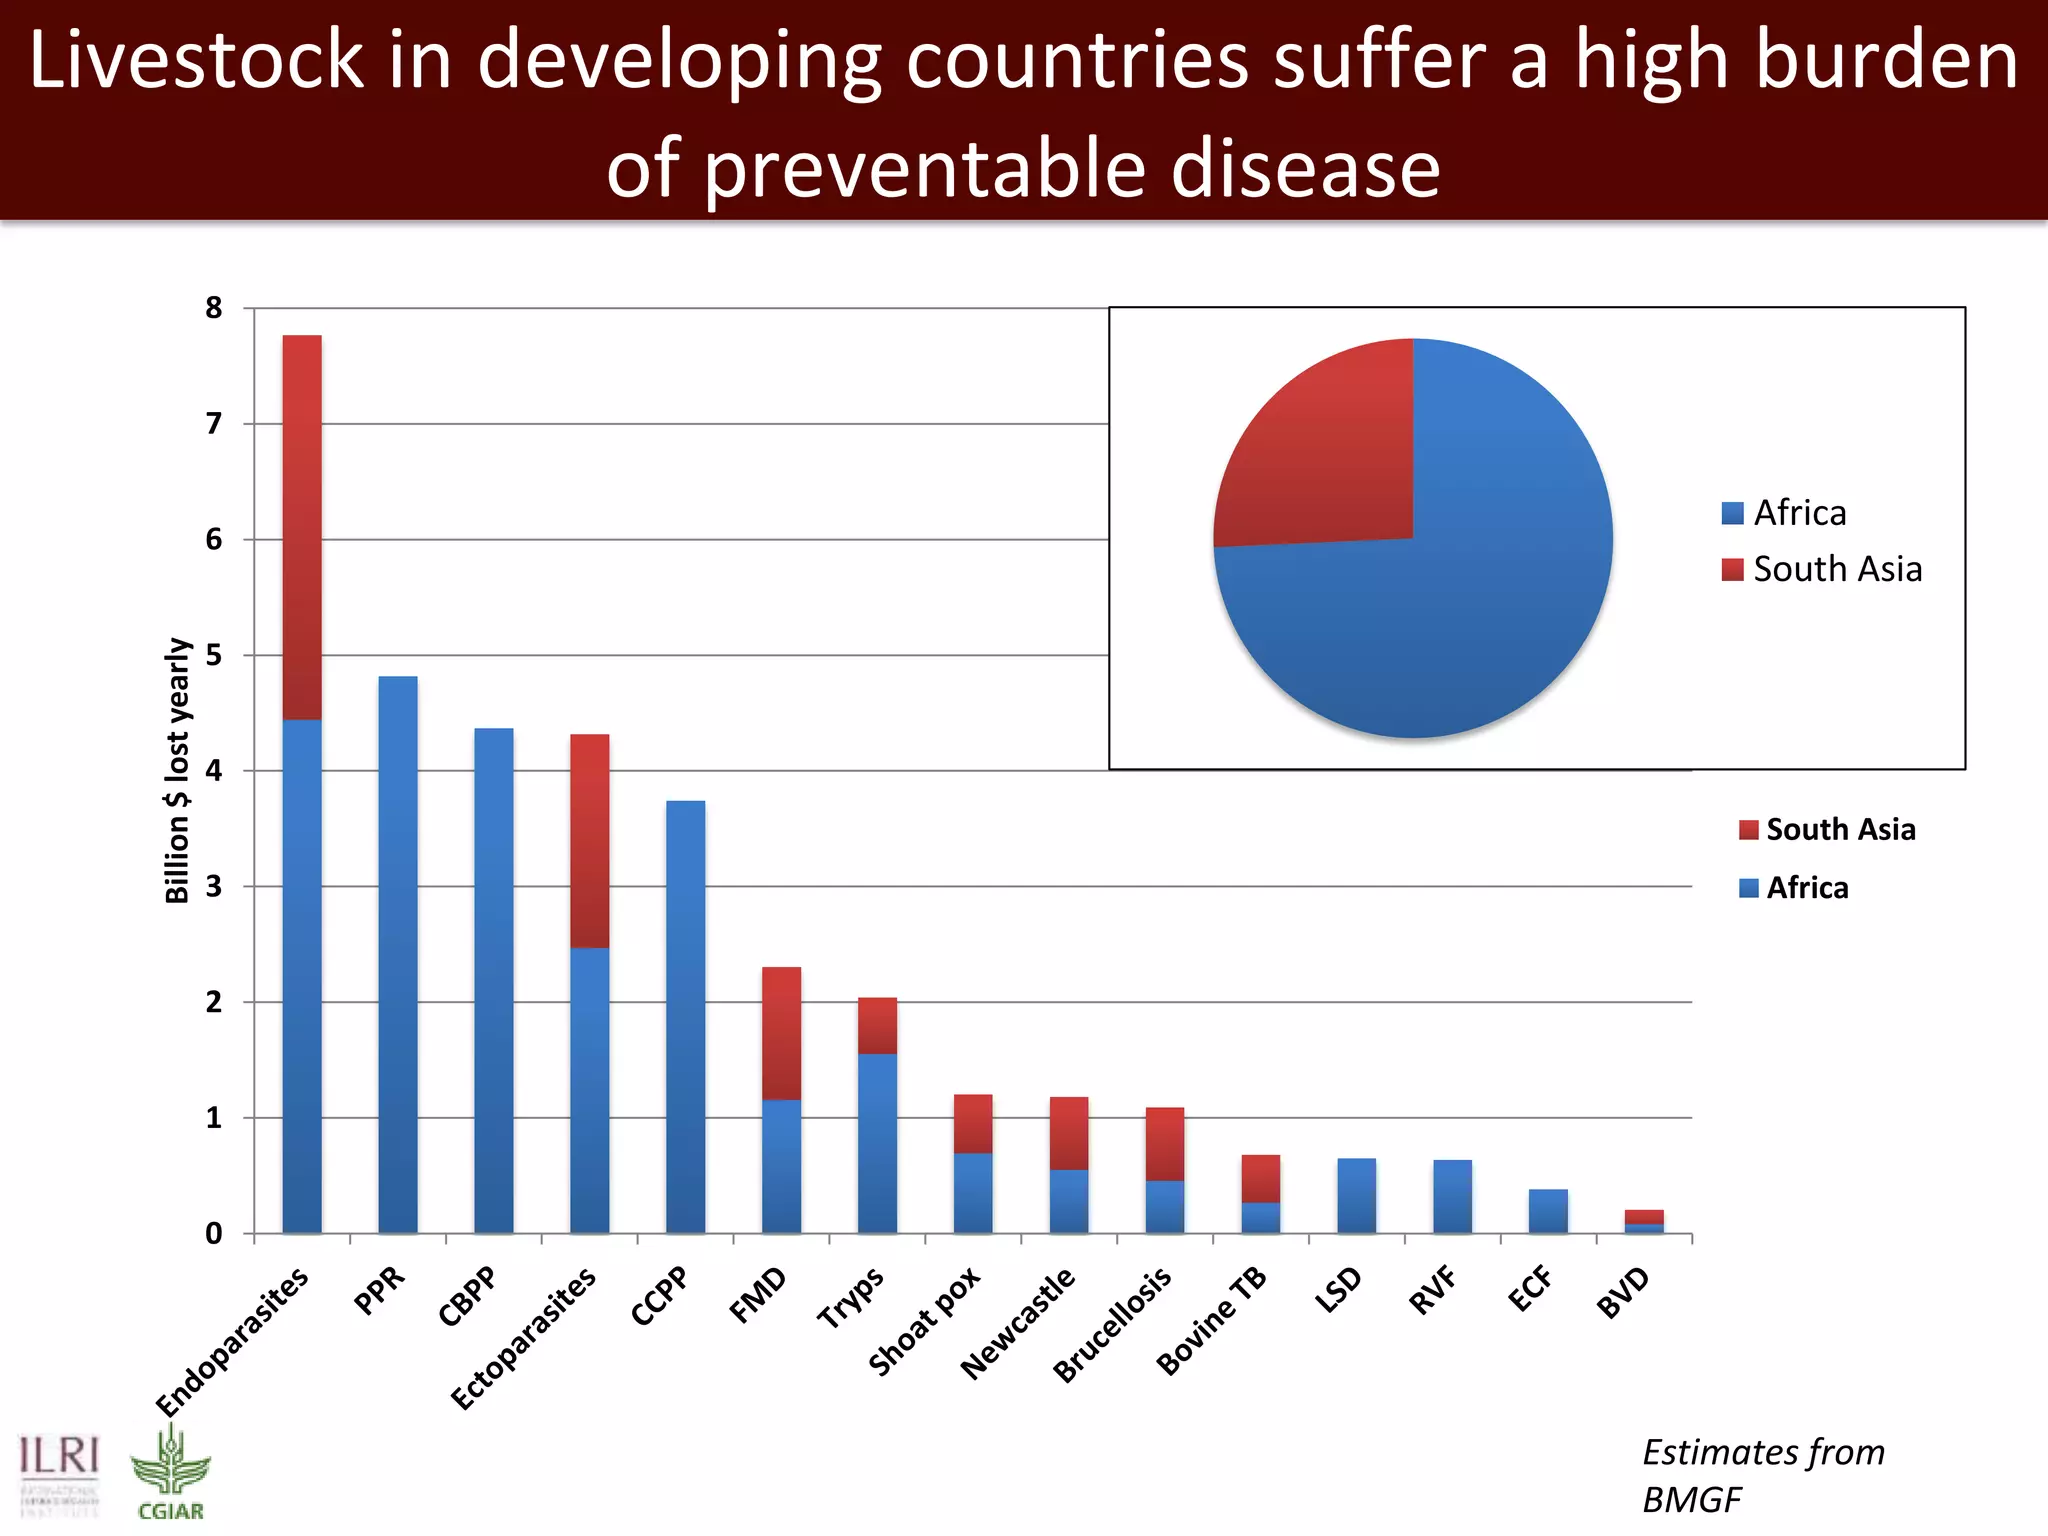
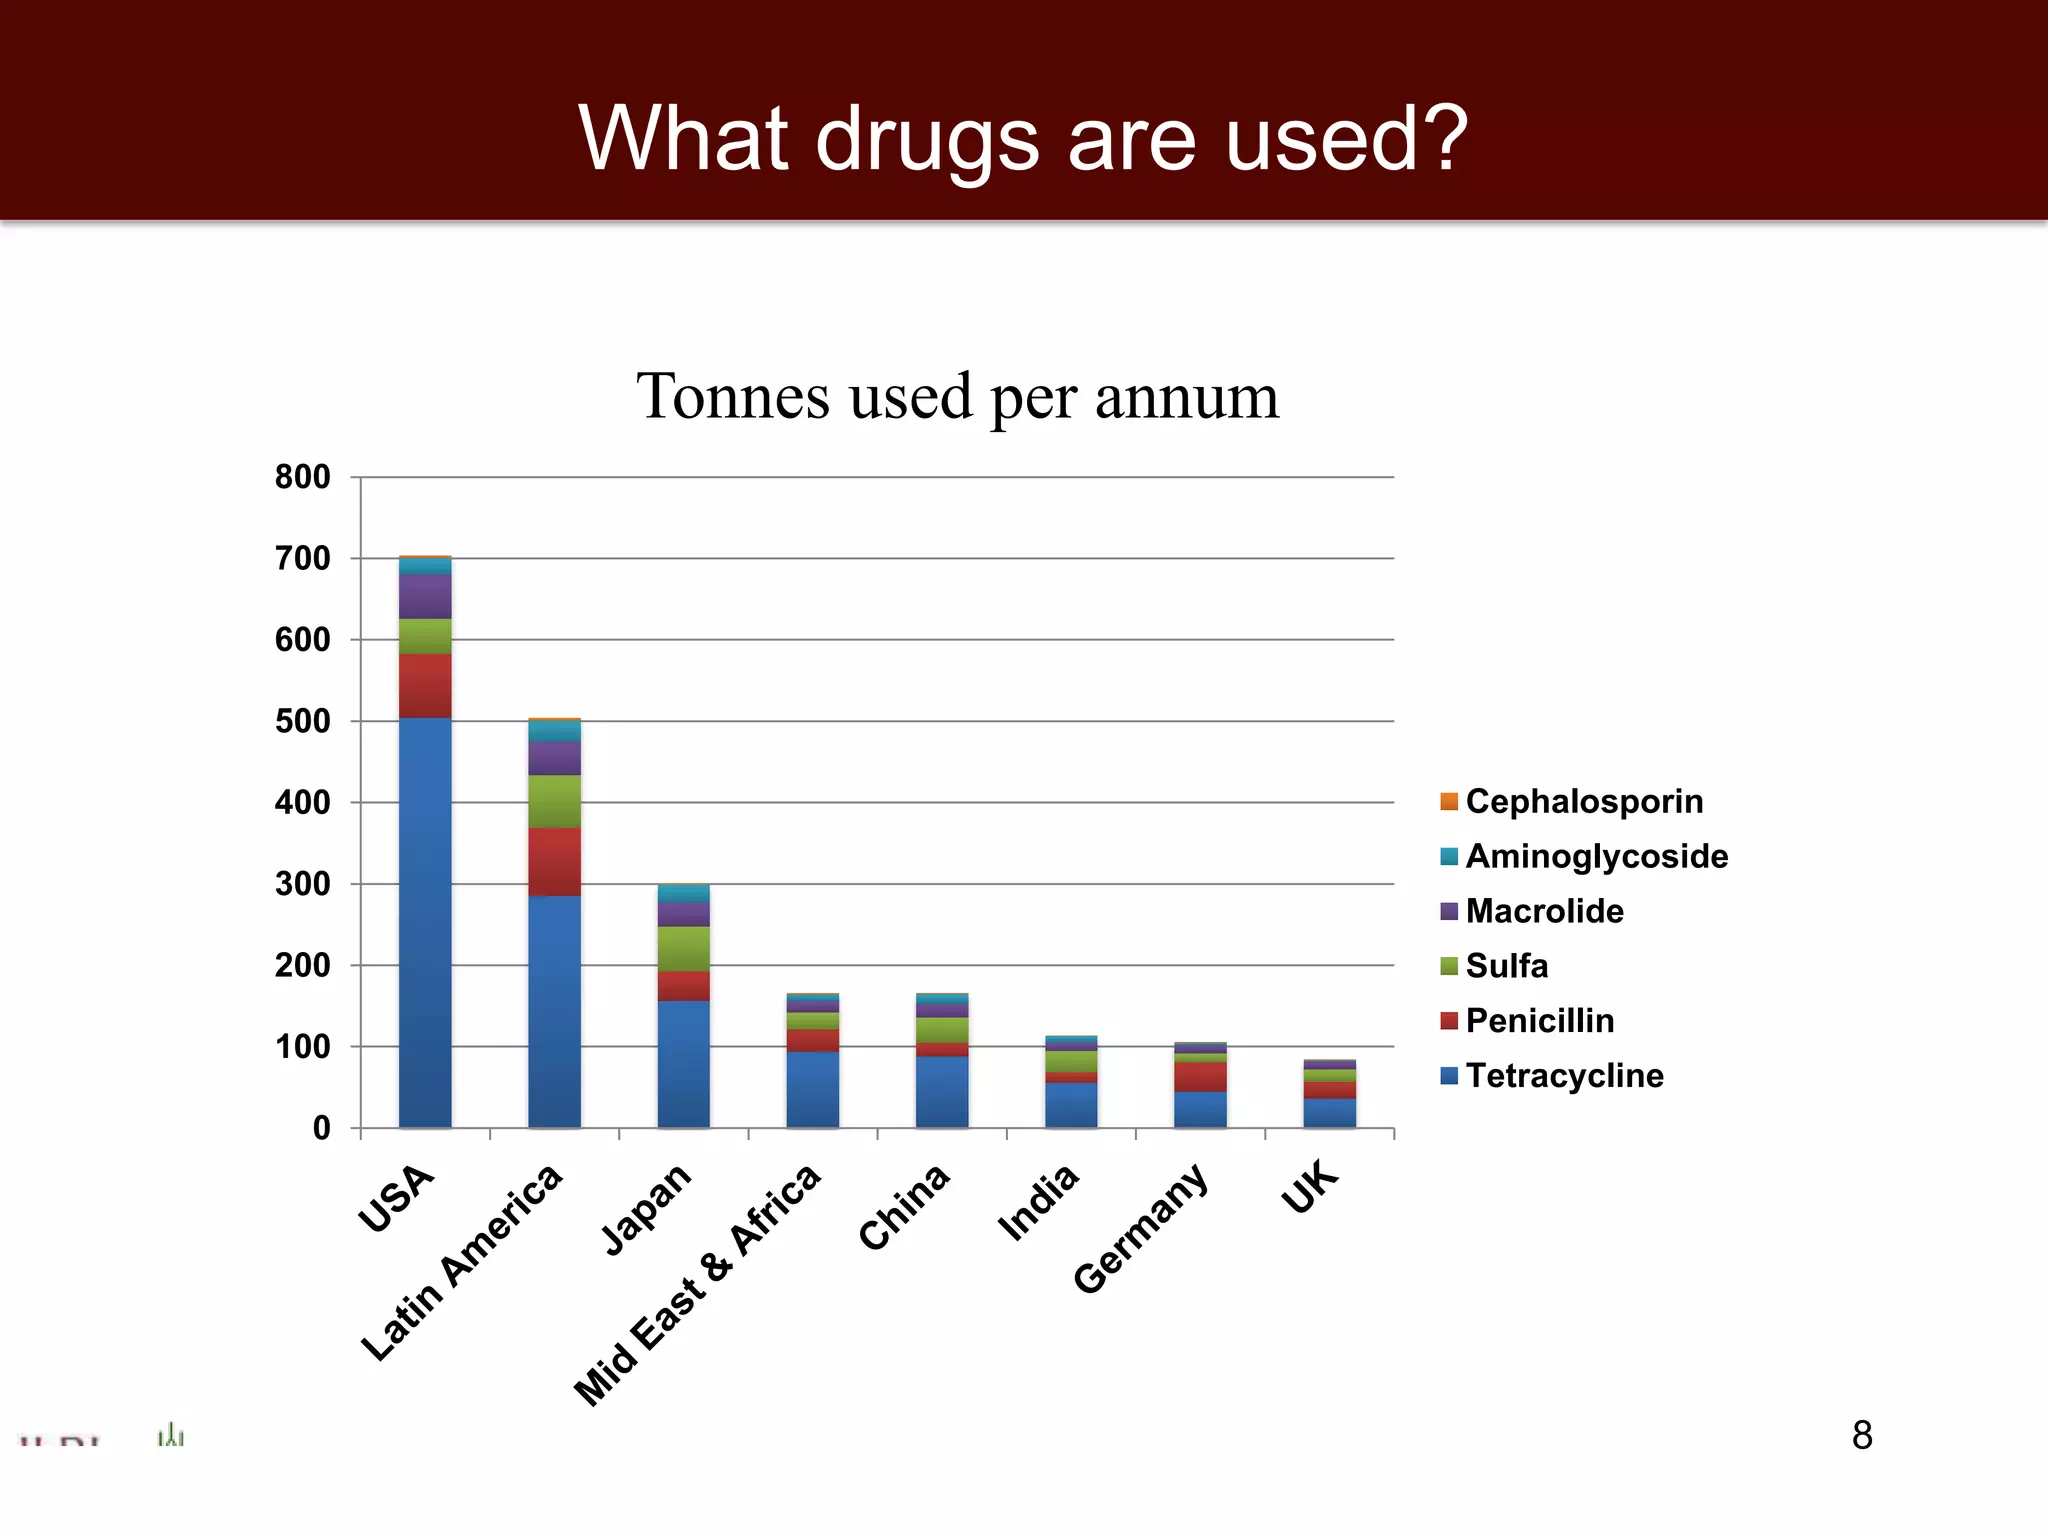
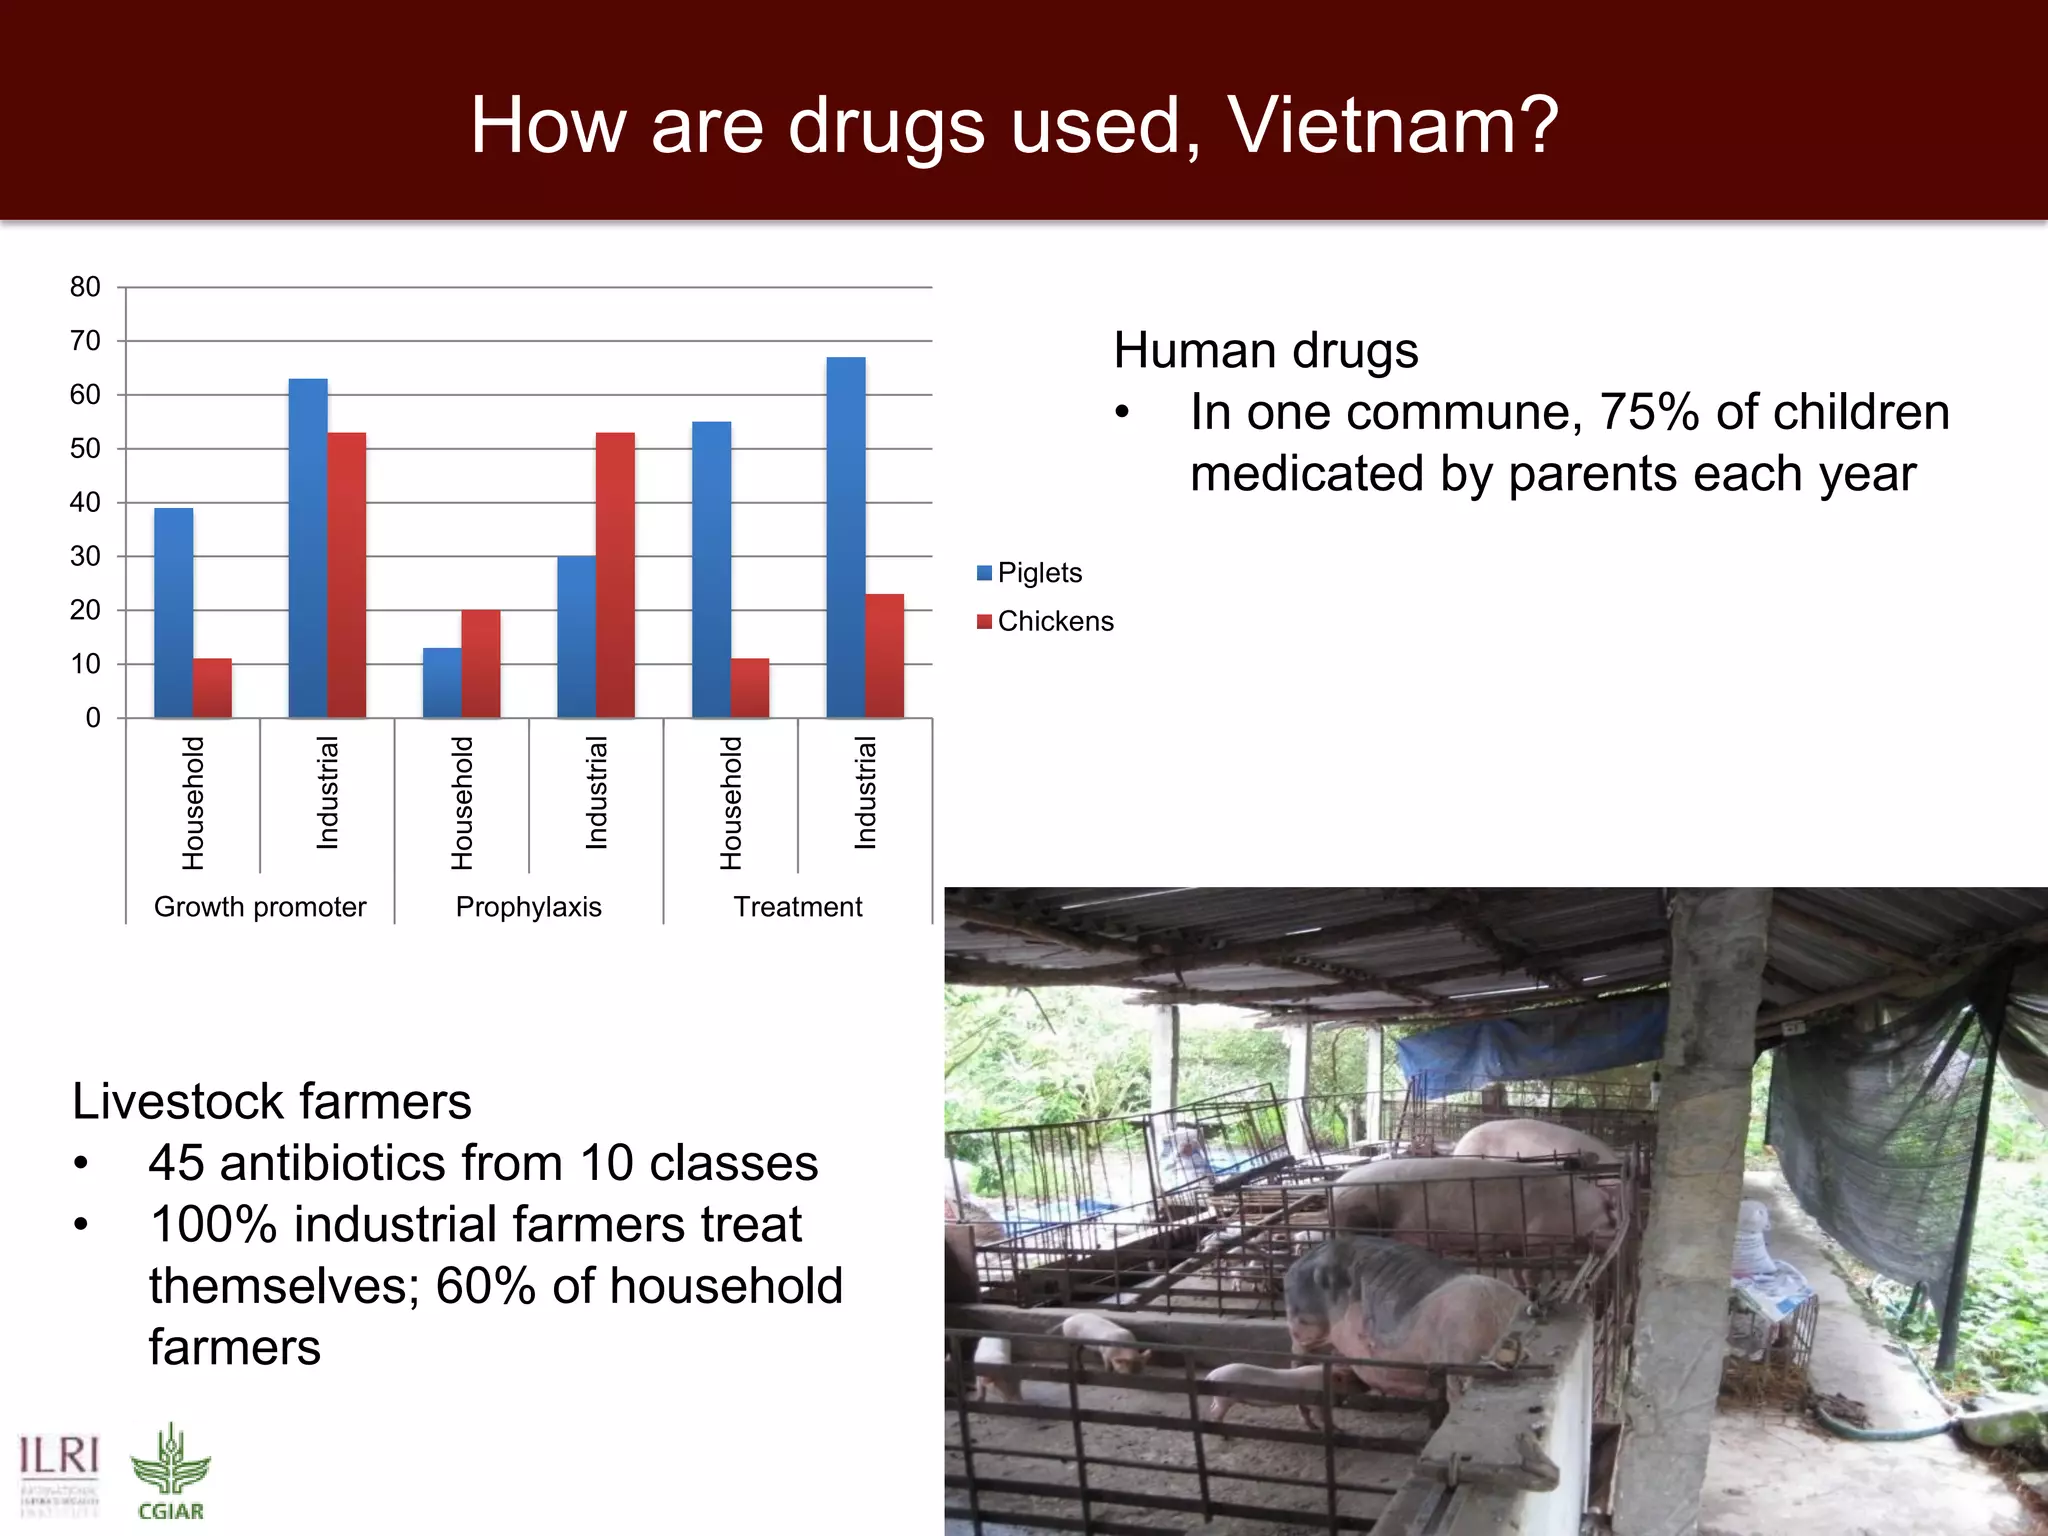
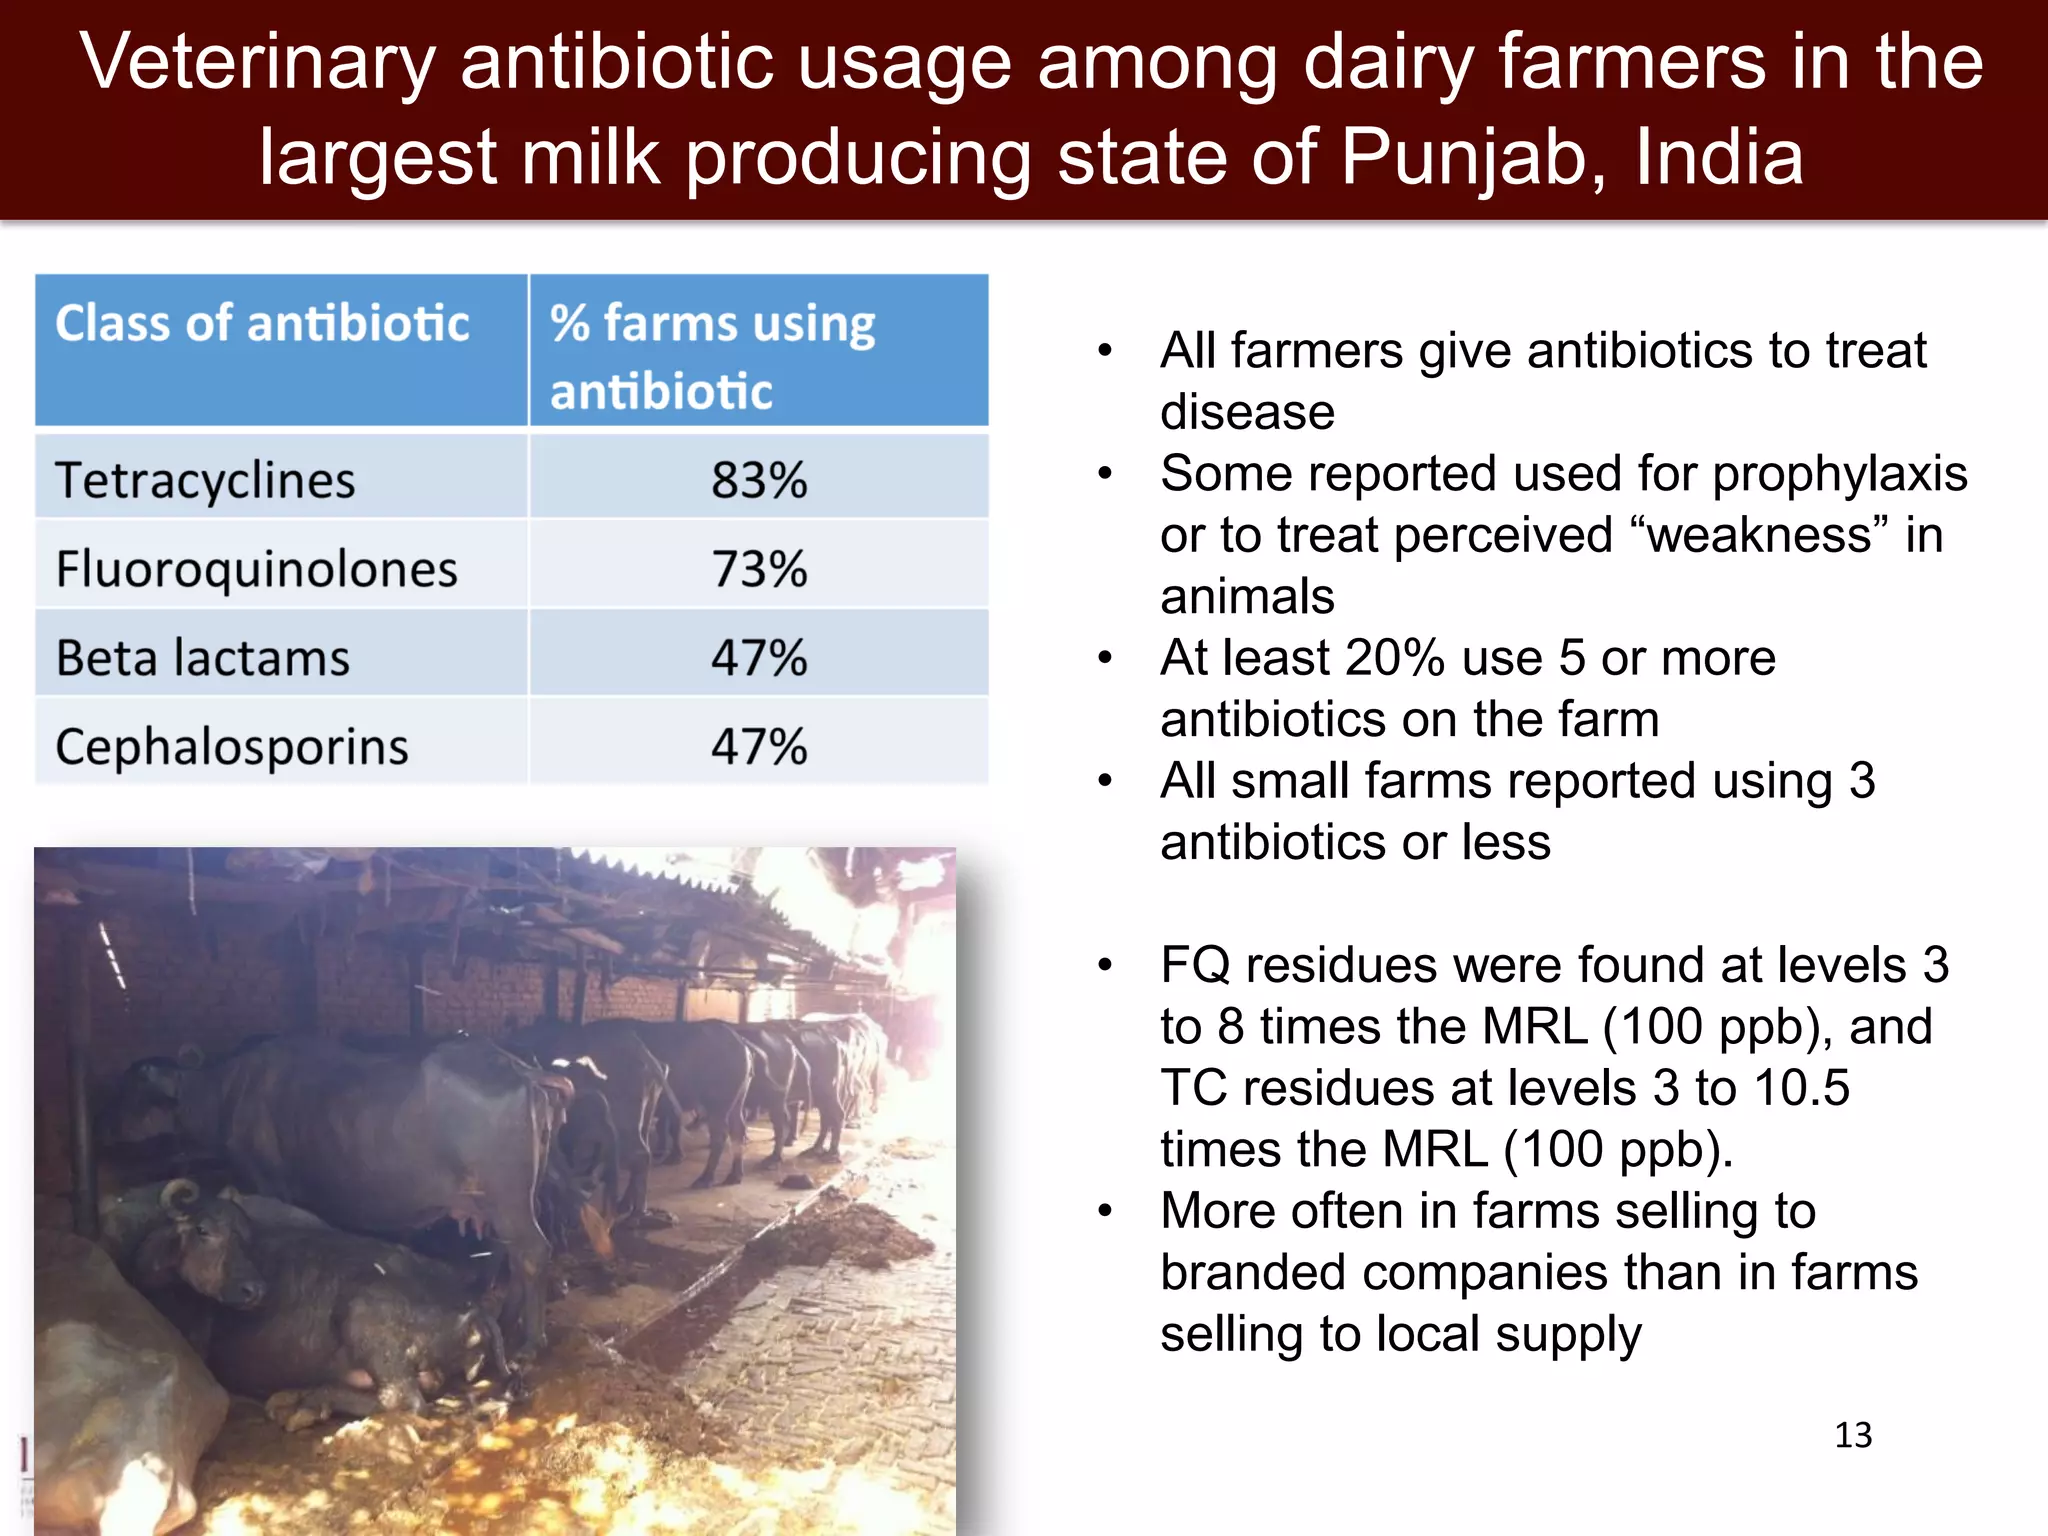
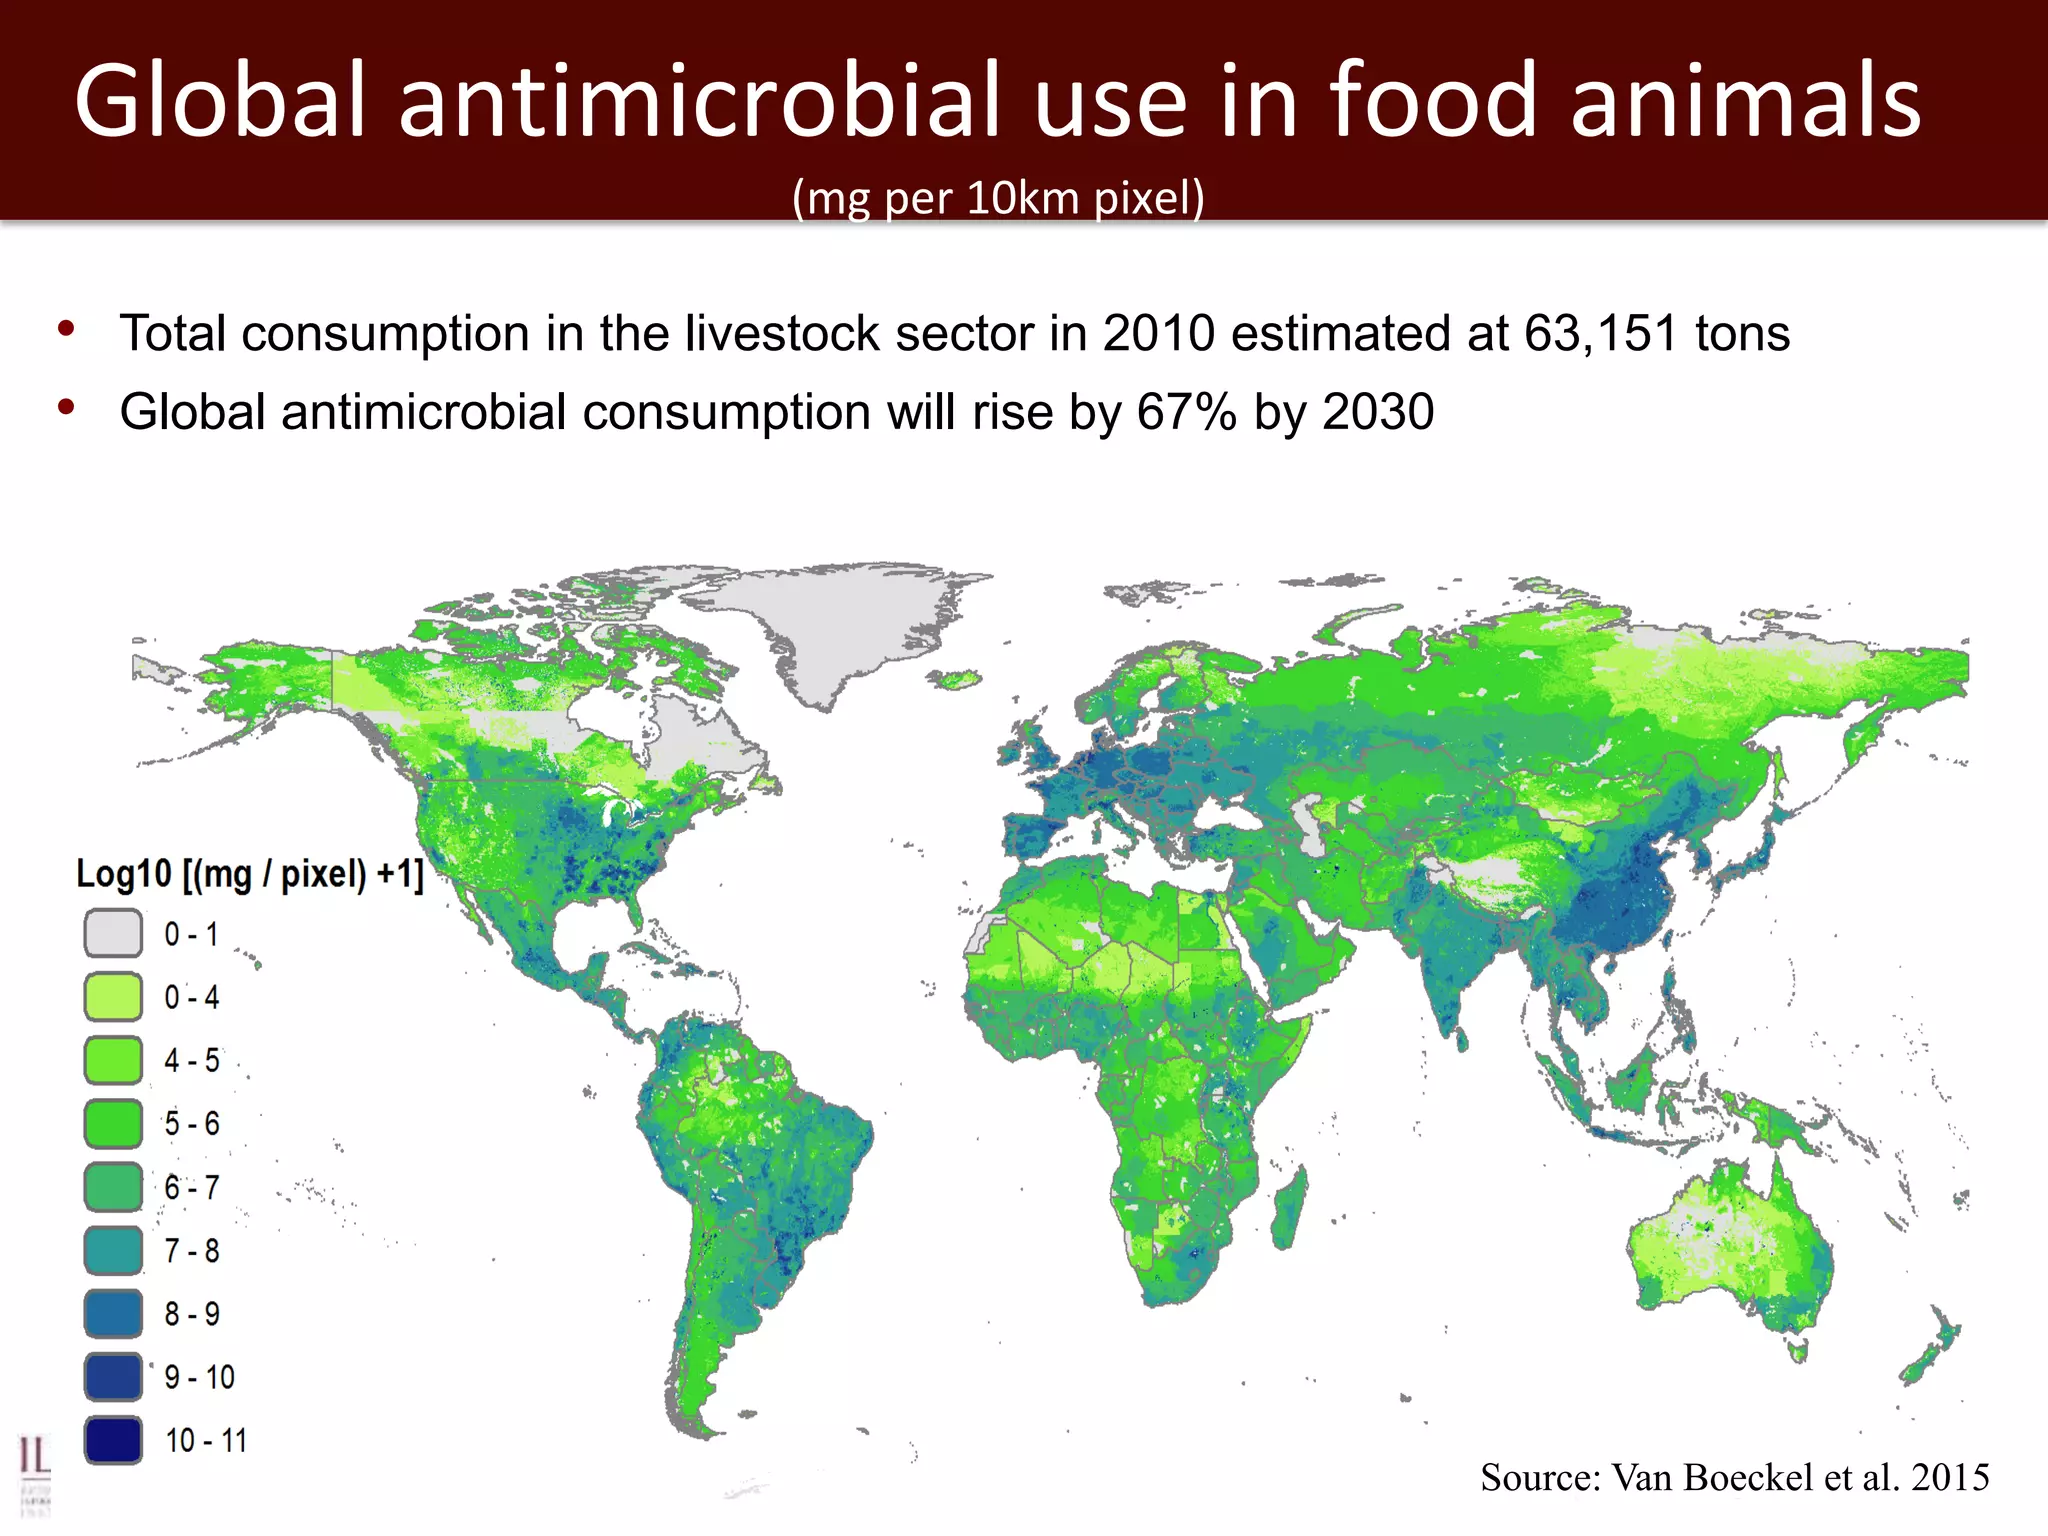
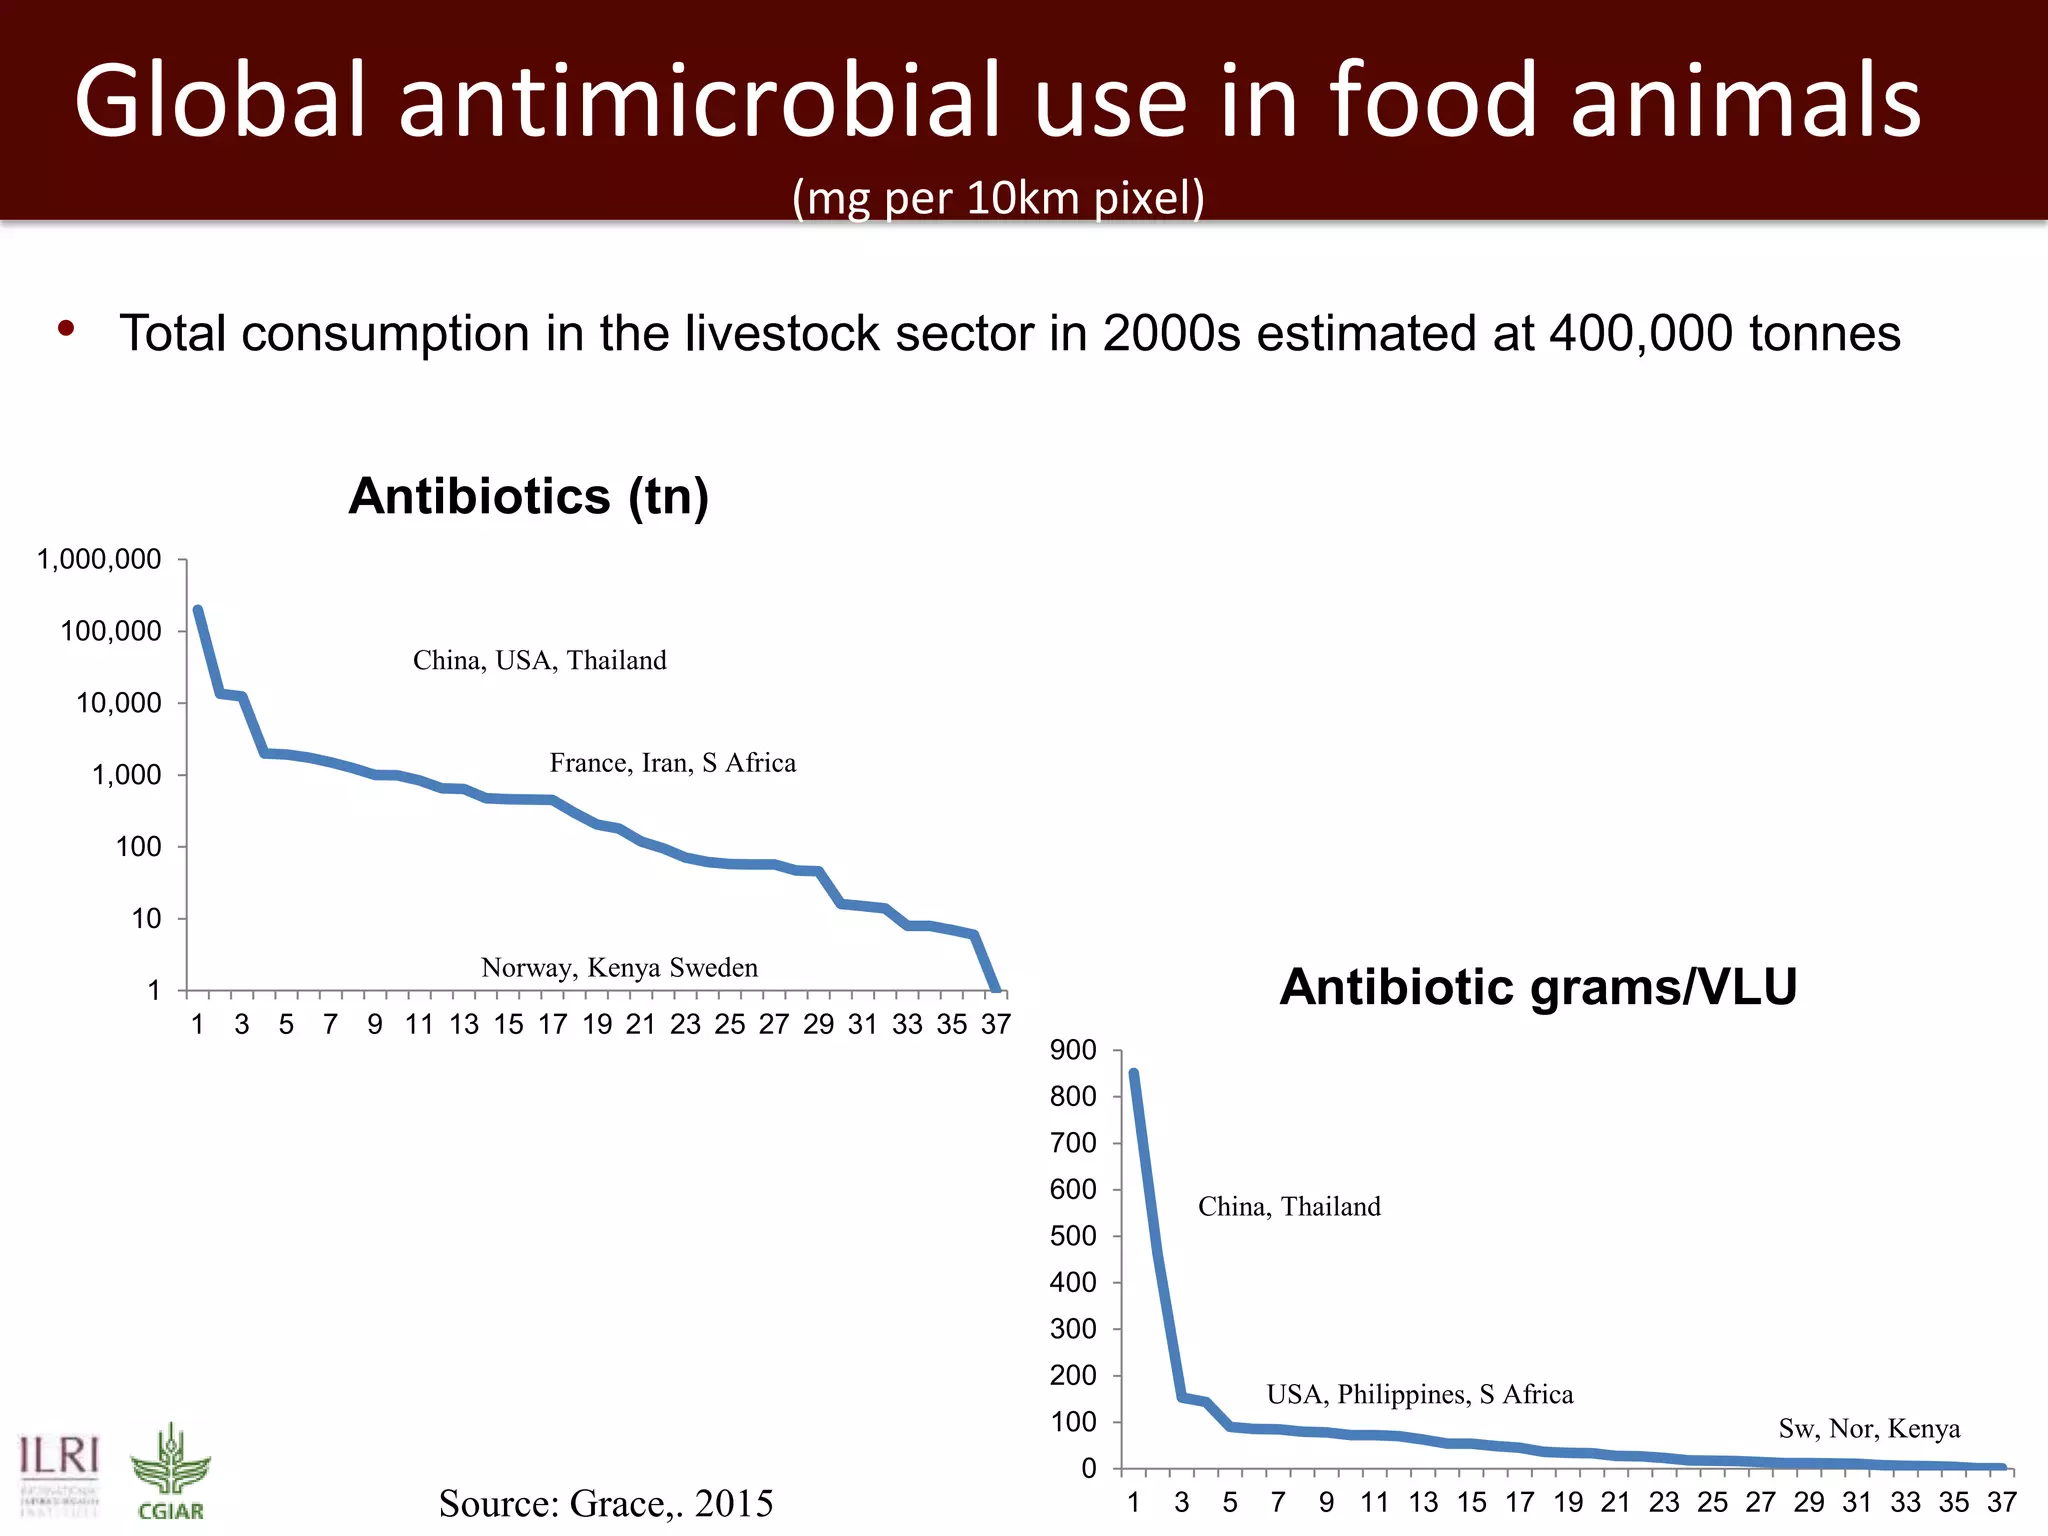
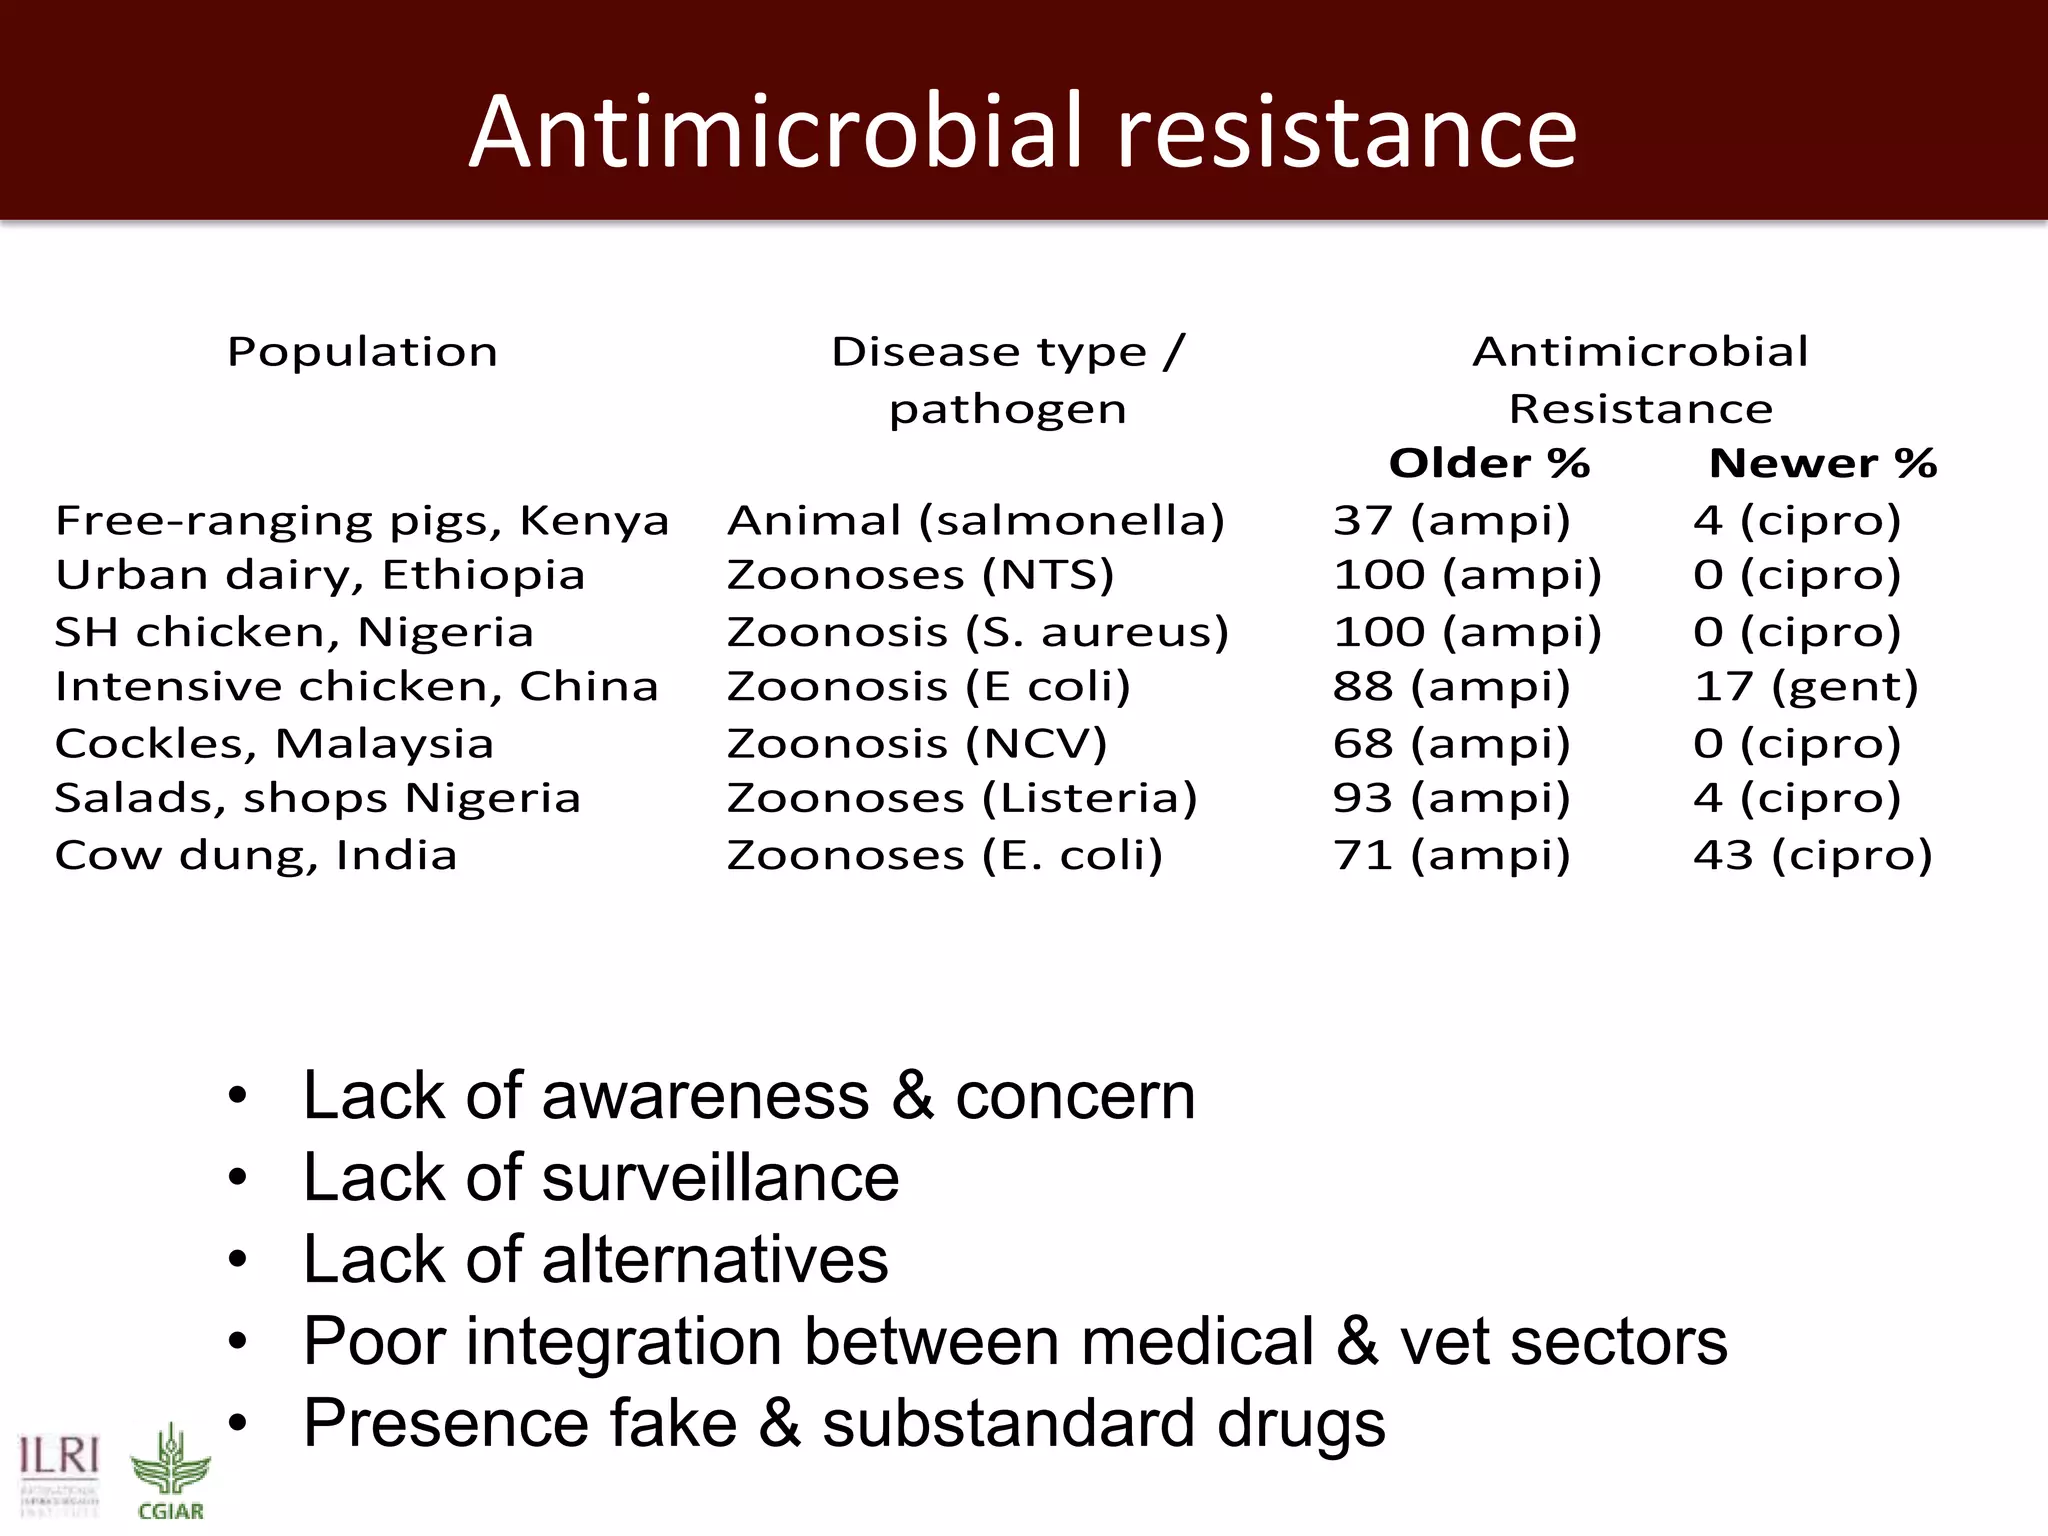
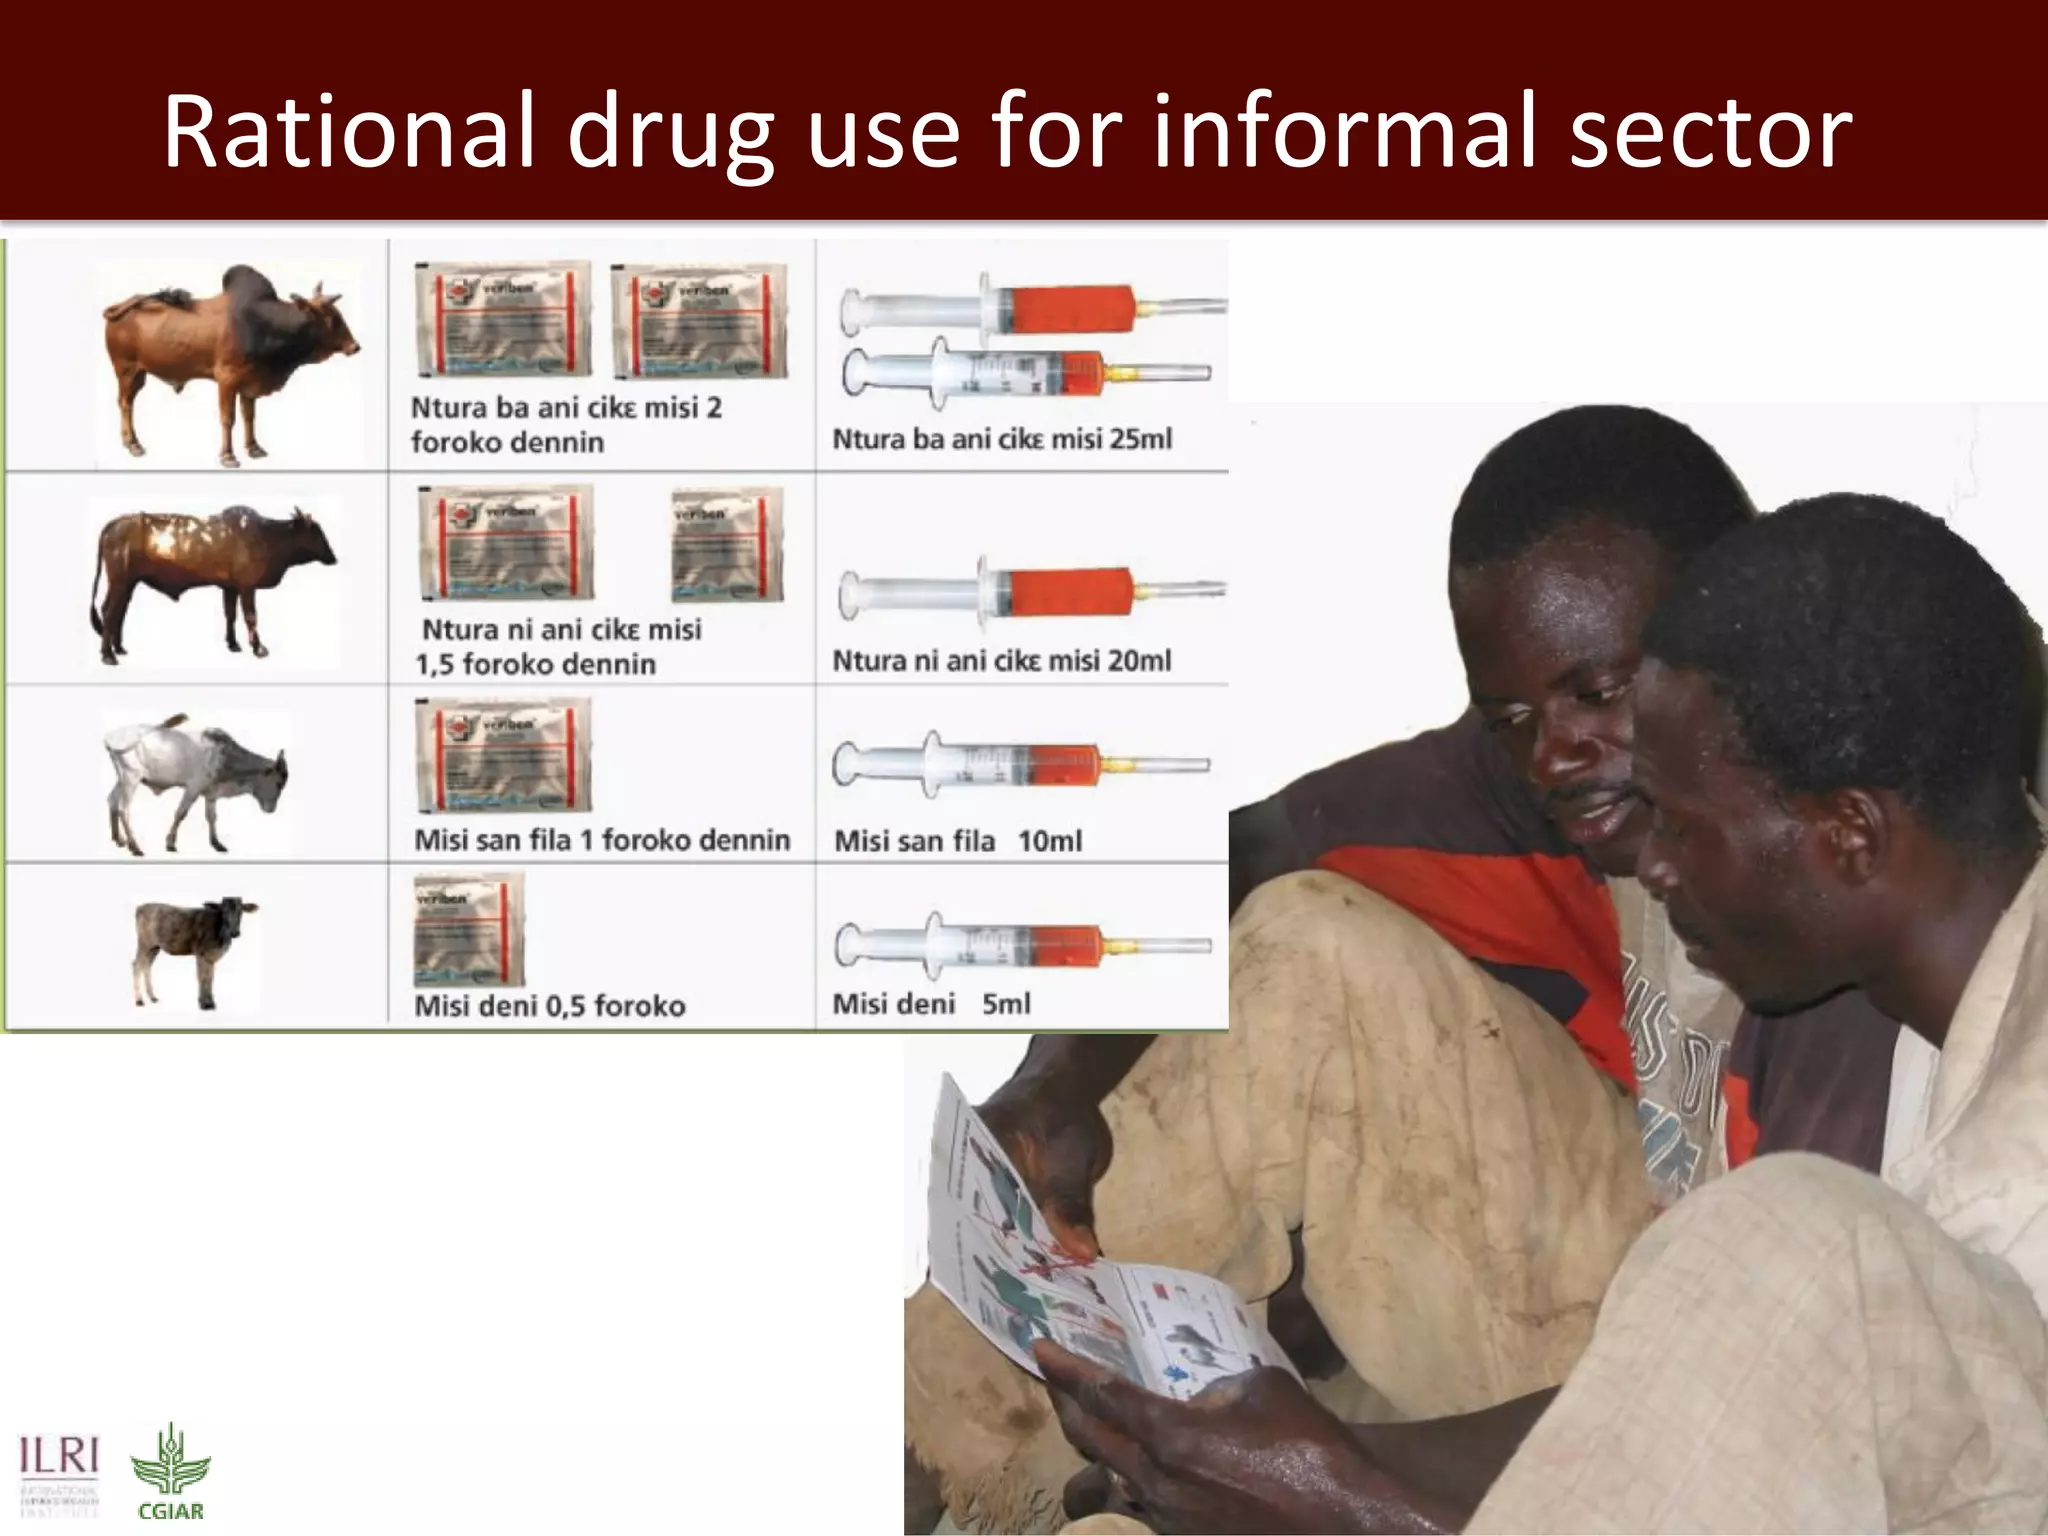
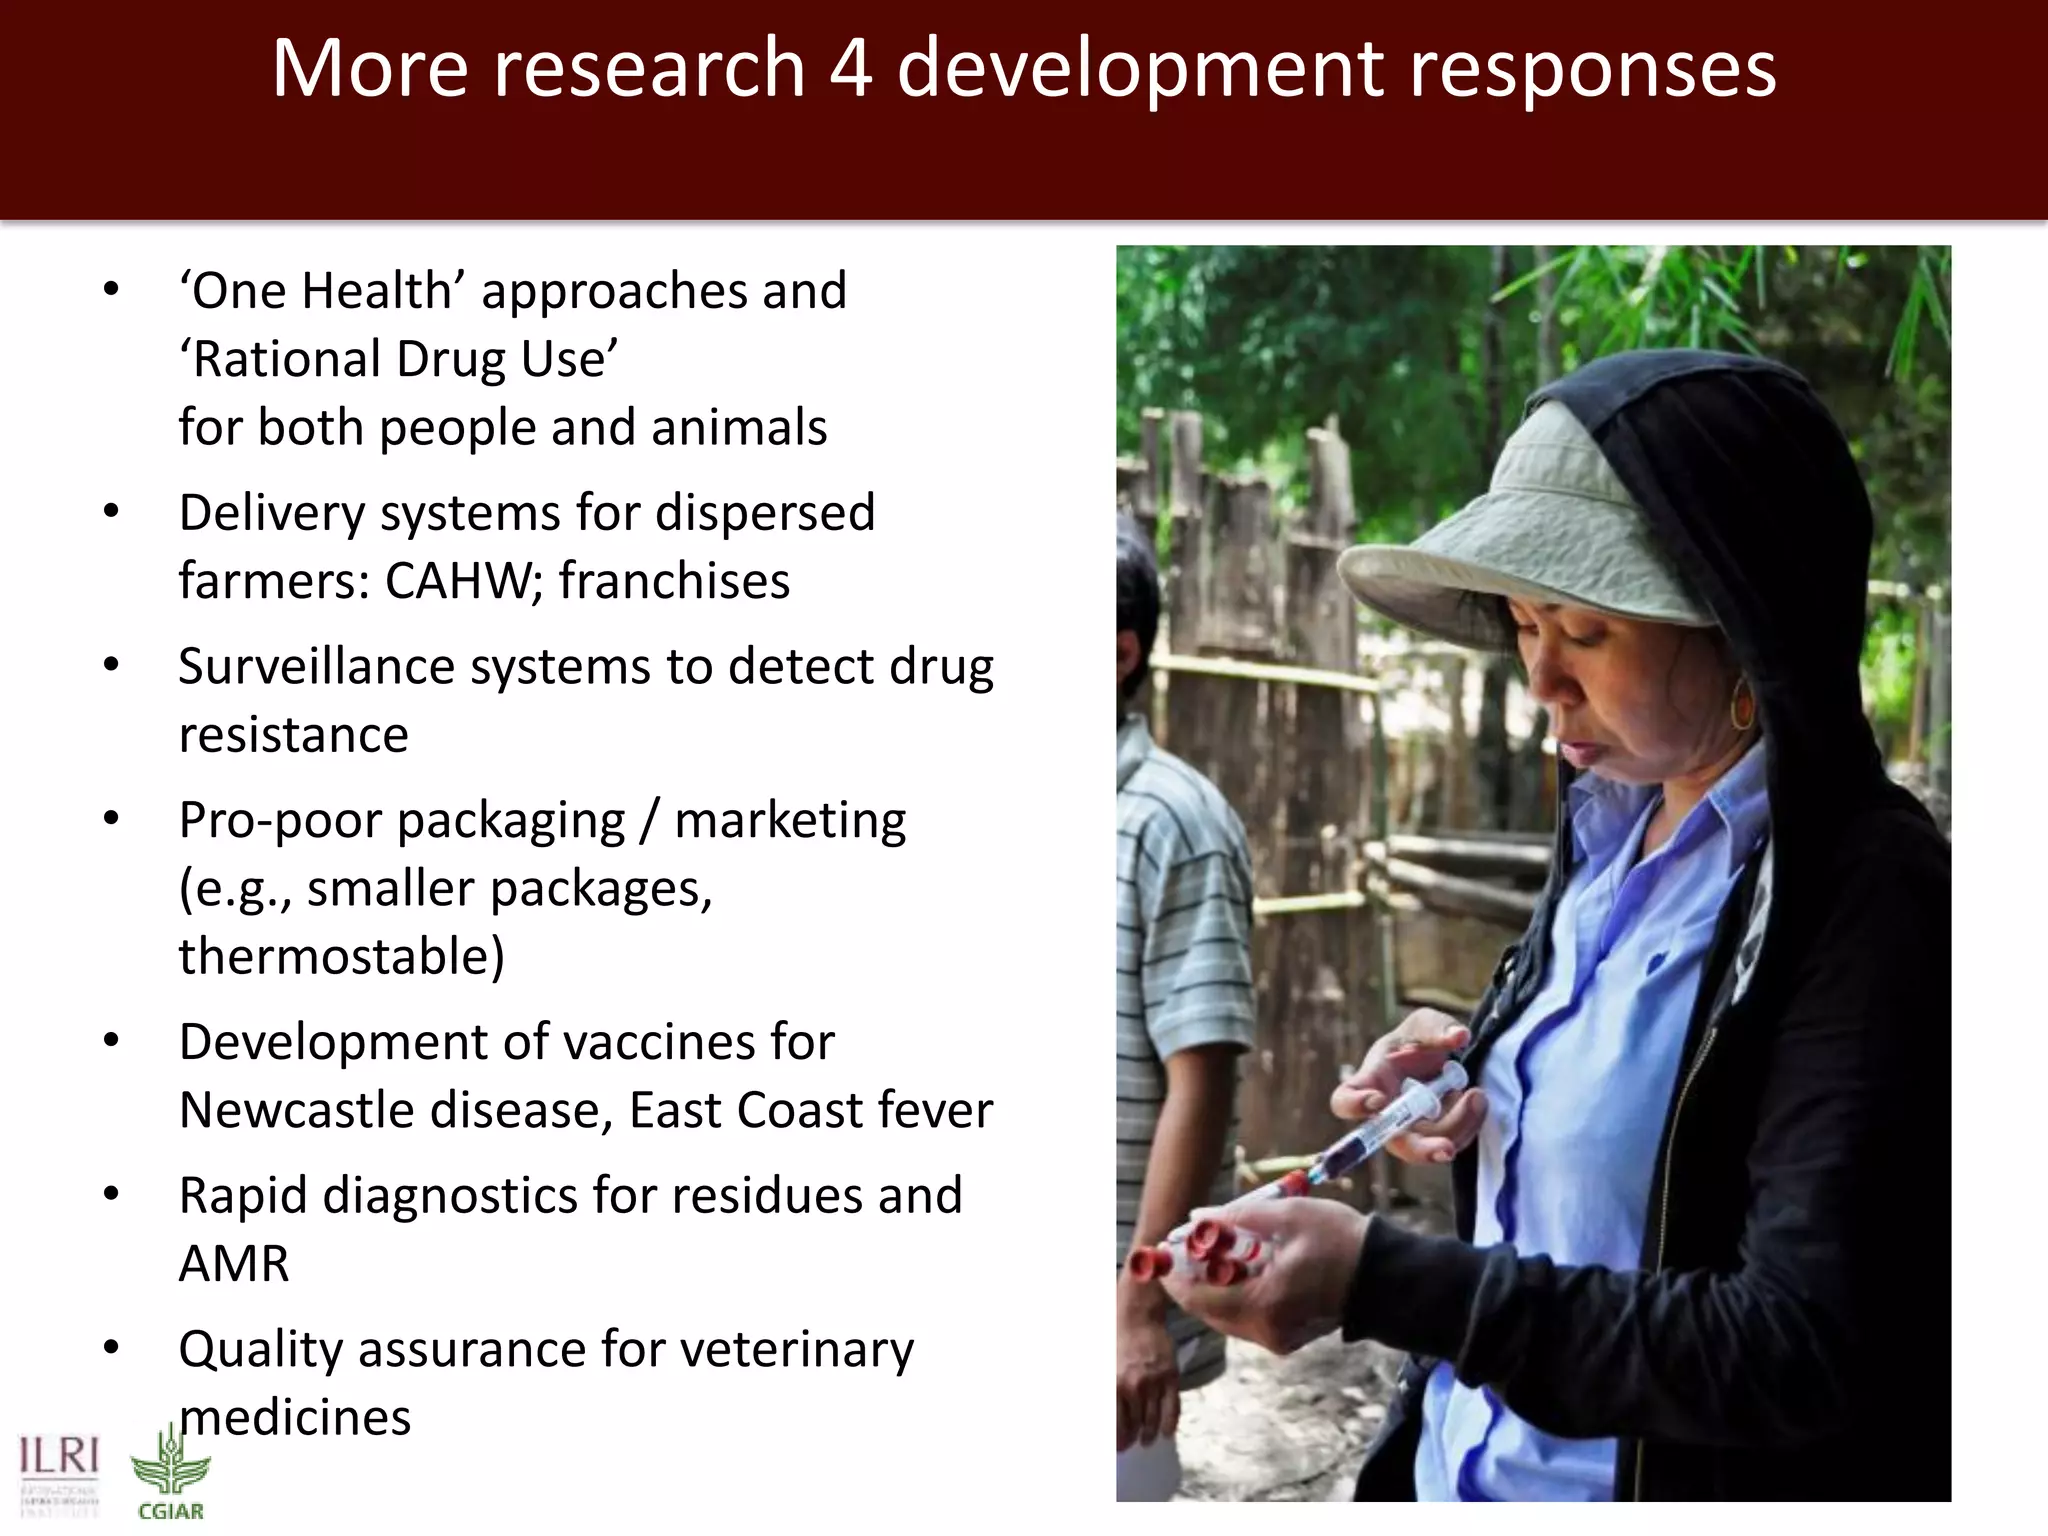

The document discusses the rising demand for antibiotics in livestock due to increasing meat consumption in developing countries, where livestock productivity is hampered by preventable diseases. It highlights significant antibiotic usage patterns, with a focus on countries like India and Vietnam, and identifies the need for improved drug use practices and veterinary policies. The report emphasizes the importance of a 'One Health' approach to address antibiotic resistance and improve livestock health sustainably.


