Downloaded 113 times

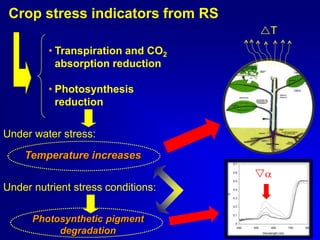
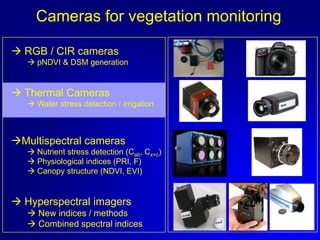
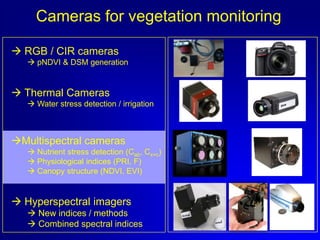
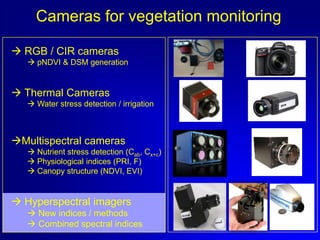
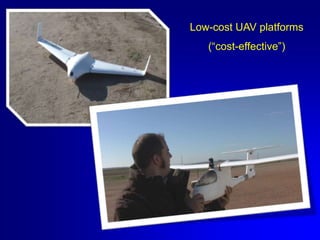
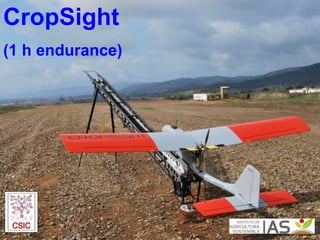
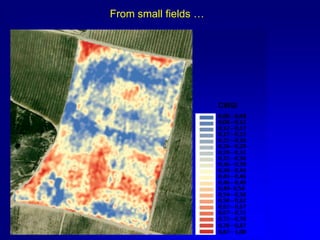

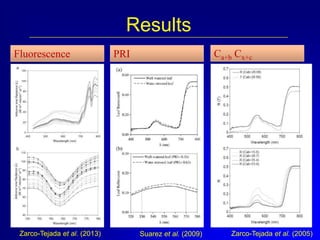
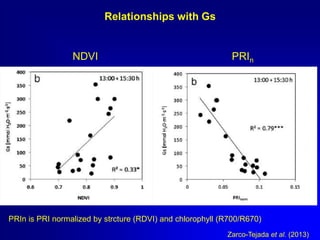
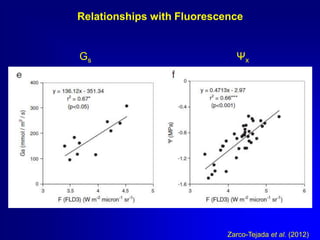
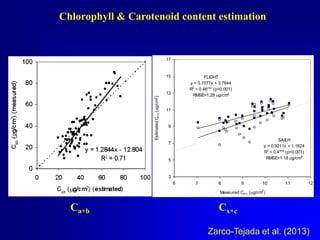
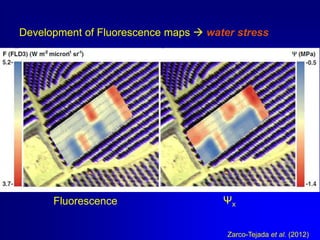
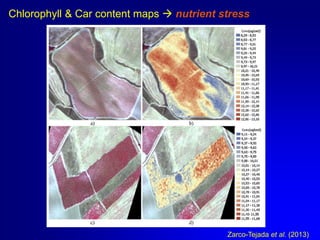
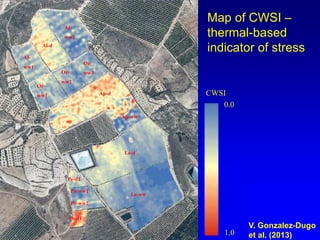
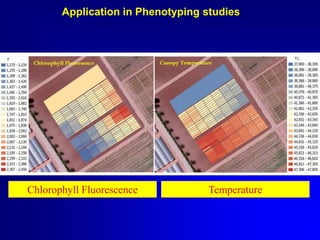
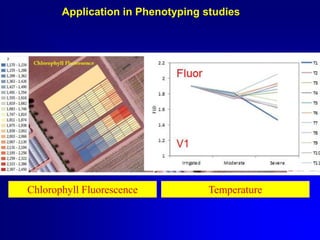

The document discusses the use of remote sensing techniques, including fluorescence and thermal imagery, to detect crop stress related to physiological conditions. It outlines the objectives, methods, and results of research conducted with various imaging platforms, emphasizing the effectiveness of using low-cost UAVs for precision agriculture and phenotyping studies. The findings suggest that these technologies can successfully generate stress maps and relate well to physiological indicators.


