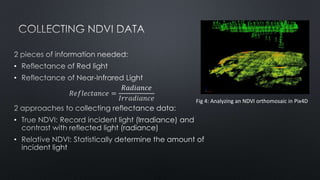
This document discusses remote sensing techniques for monitoring crop health and stress. It includes figures showing RGB vs NDVI maps, the absorption spectrum of chlorophyll, Landsat satellites, analyzing NDVI data in software, converting a camera to near infrared, thermal images of cotton, an agricultural drone, intercept and slope values for correlating NDVI to crop yield in various crops, examples of vapor pressure deficit for soybeans, a thermal imaging camera, and an NDVI image indicating drainage issues. References are provided for the topics discussed.

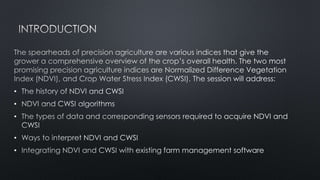
![•
•
•
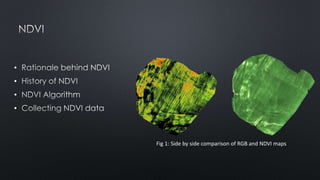
Fig 2: Absorption spectrum of Chlorophyll [2]](https://image.slidesharecdn.com/c6ecb11f-2df4-4fa6-9193-04cc4ed618c8-151006164344-lva1-app6891/85/Indices-for-Precision-Agriculture-4-320.jpg)
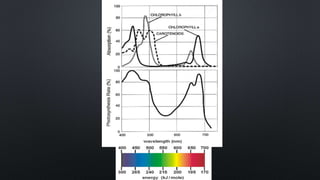
![•
•
Fig 3: Sketch of Landsat1 Satellite [3]](https://image.slidesharecdn.com/c6ecb11f-2df4-4fa6-9193-04cc4ed618c8-151006164344-lva1-app6891/85/Indices-for-Precision-Agriculture-6-320.jpg)
![•
•
•
•
•
•
Fig 2: Absorption spectrum of Chlorophyll [2]](https://image.slidesharecdn.com/c6ecb11f-2df4-4fa6-9193-04cc4ed618c8-151006164344-lva1-app6891/85/Indices-for-Precision-Agriculture-8-320.jpg)
![•
•
•
•
Fig 6: Thermal image of a cotton field in Arizona [5]](https://image.slidesharecdn.com/c6ecb11f-2df4-4fa6-9193-04cc4ed618c8-151006164344-lva1-app6891/85/Indices-for-Precision-Agriculture-12-320.jpg)
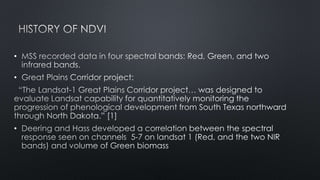
![Crop
Intercept
(b)
Slope
(m)
Alfalfa 0.51 -1.92
Barley (pre-
heading)
2.01 -2.25
Barley (post-
heading)
1.72 -1.23
Bean 2.91 -2.35
Beet 5.16 -2.3
Corn (no tassels) 3.11 -1.97
Cotton 1.49 -2.09
Cowpea 1.32 -1.84
Cucumber 4.88 -2.52
Lettuce, leaf 4.18 -2.96
Potato 1.17 -1.83
Soybean 1.44 -1.34
Tomato 2.86 -1.96
Wheat (pre-
heading)
3.38 -3.25
Wheat (post-
heading)
2.88 -2.11
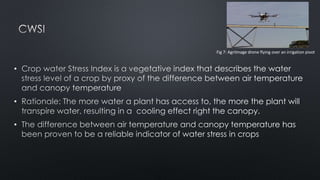
An example of the slope and intercept values for Soybeans is given below, followed by values for
various other crops:
Fig 8: Example Vapor Pressure deficit Baseline for Soybeans [5]
Intercept and Slope values for various crops [5]](https://image.slidesharecdn.com/c6ecb11f-2df4-4fa6-9193-04cc4ed618c8-151006164344-lva1-app6891/85/Indices-for-Precision-Agriculture-18-320.jpg)
![•
•
•
•
•
•
•
•
Fig 9: Flir Thermal Imaging Camera [8]](https://image.slidesharecdn.com/c6ecb11f-2df4-4fa6-9193-04cc4ed618c8-151006164344-lva1-app6891/85/Indices-for-Precision-Agriculture-20-320.jpg)
![•
•
•
•
•
•
•
•
•
Fig 9: NDVI image showing drainage issues [8]](https://image.slidesharecdn.com/c6ecb11f-2df4-4fa6-9193-04cc4ed618c8-151006164344-lva1-app6891/85/Indices-for-Precision-Agriculture-21-320.jpg)
![[1] D. Deering and R. H. Hass, "Using Landsat Digital Data for Estimating Green Biomass," NASA, Greenbelt, MD, 1980.
[2] J. Whitmarsch and Govindjee, "The Photosynthetic Process," 1995. [Online]. Available: http://www.life.illinois.edu/govindjee/paper/gov.html#52. [Accessed 22 August
2015].
[3] NASA, "Landsat Science," NASA, 19 August 2015. [Online]. Available: http://landsat.gsfc.nasa.gov/?p=3172. [Accessed 22 August 2015].
[4] Public Labs, "Near Infrared Camera," Public Labs, June 2015. [Online]. Available: http://publiclab.org/wiki/near-infrared-camera. [Accessed 25 August 2015].
[5] USDA agricultural Research Service, "Crop water Stress Detection," USDA, 15 December 2005. [Online]. Available:
http://www.ars.usda.gov/Main/docs.htm?docid=9715&pf=1. [Accessed 24 August 2015].
[6] R. D. W. P. K. a. B. J. C. Jackson, "A reexamination of the crop water stress index.," Irrigation Science, vol. 9, no. 4, pp. 309-317, 1988.
[7] K. P. U. R.L. Snyder, "Measuring Vapor Pressure Deficit in the Field," Regents of the University of California, 6 January 2006. [Online]. Available:
http://biomet.ucdavis.edu/biomet/VPD/vpd.htm. [Accessed 24 August 2015].
[8] Flir, "FLIR Tau 2 LWIR Thermal Imaging Camera Core Series," Flir, 2015. [Online]. Available: http://www.flircameras.com/flir-tau-2/flir-tau-2-thermal-imaging-camera-
core-series.htm. [Accessed 25 August 2015].](https://image.slidesharecdn.com/c6ecb11f-2df4-4fa6-9193-04cc4ed618c8-151006164344-lva1-app6891/85/Indices-for-Precision-Agriculture-23-320.jpg)


