Download as PDF, PPTX

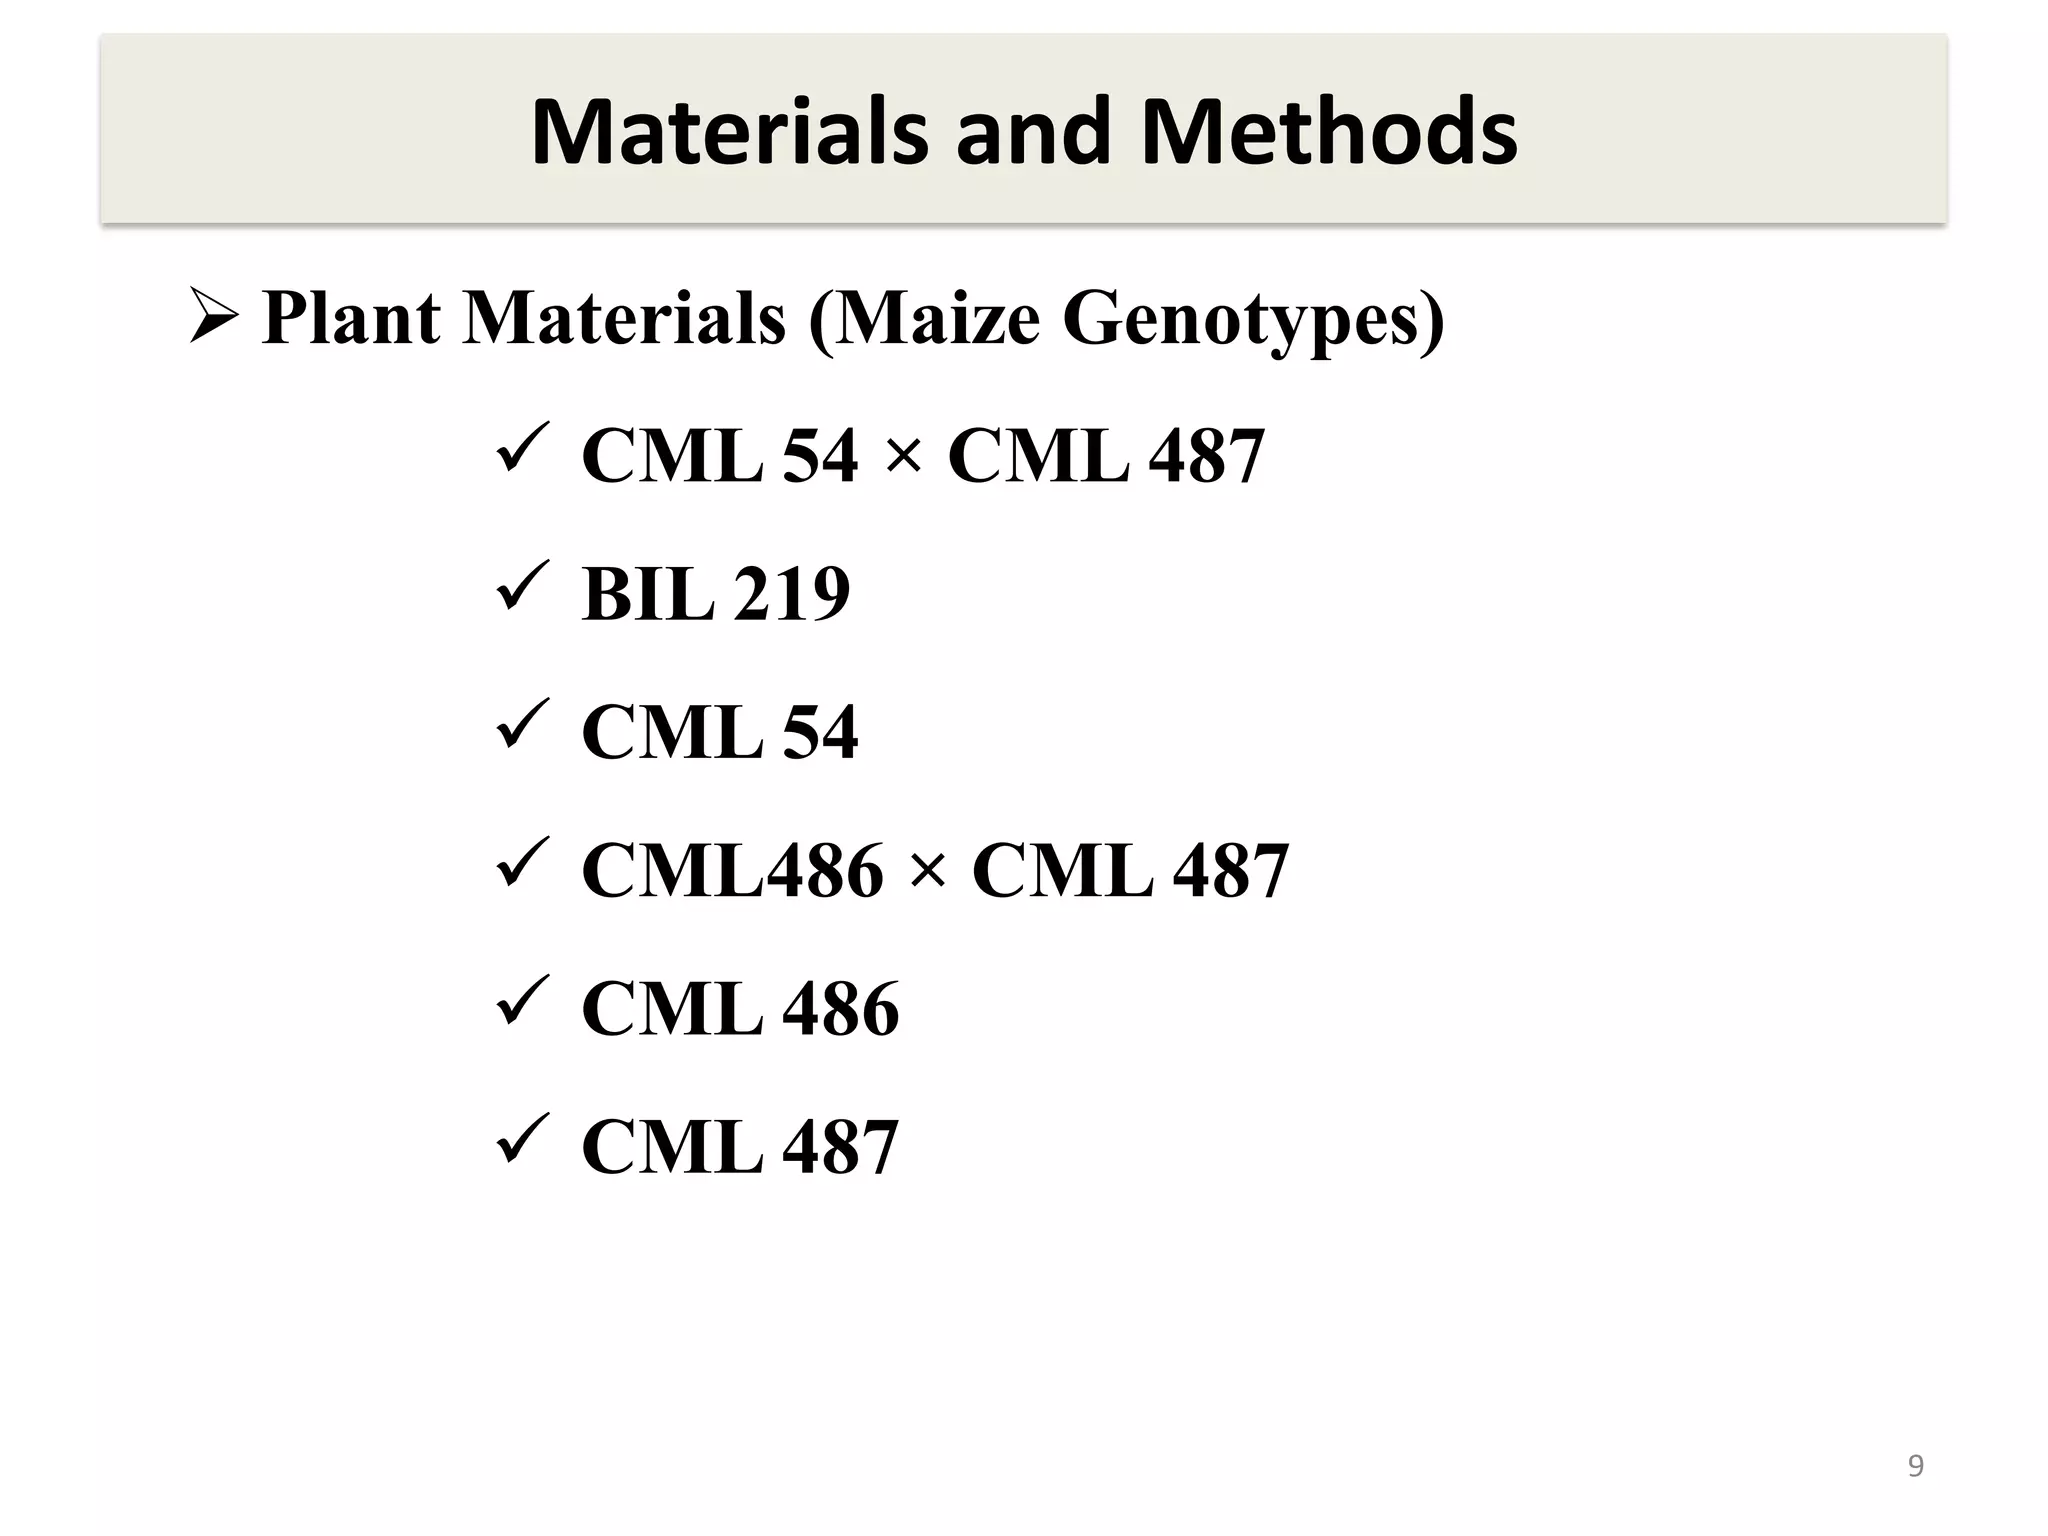

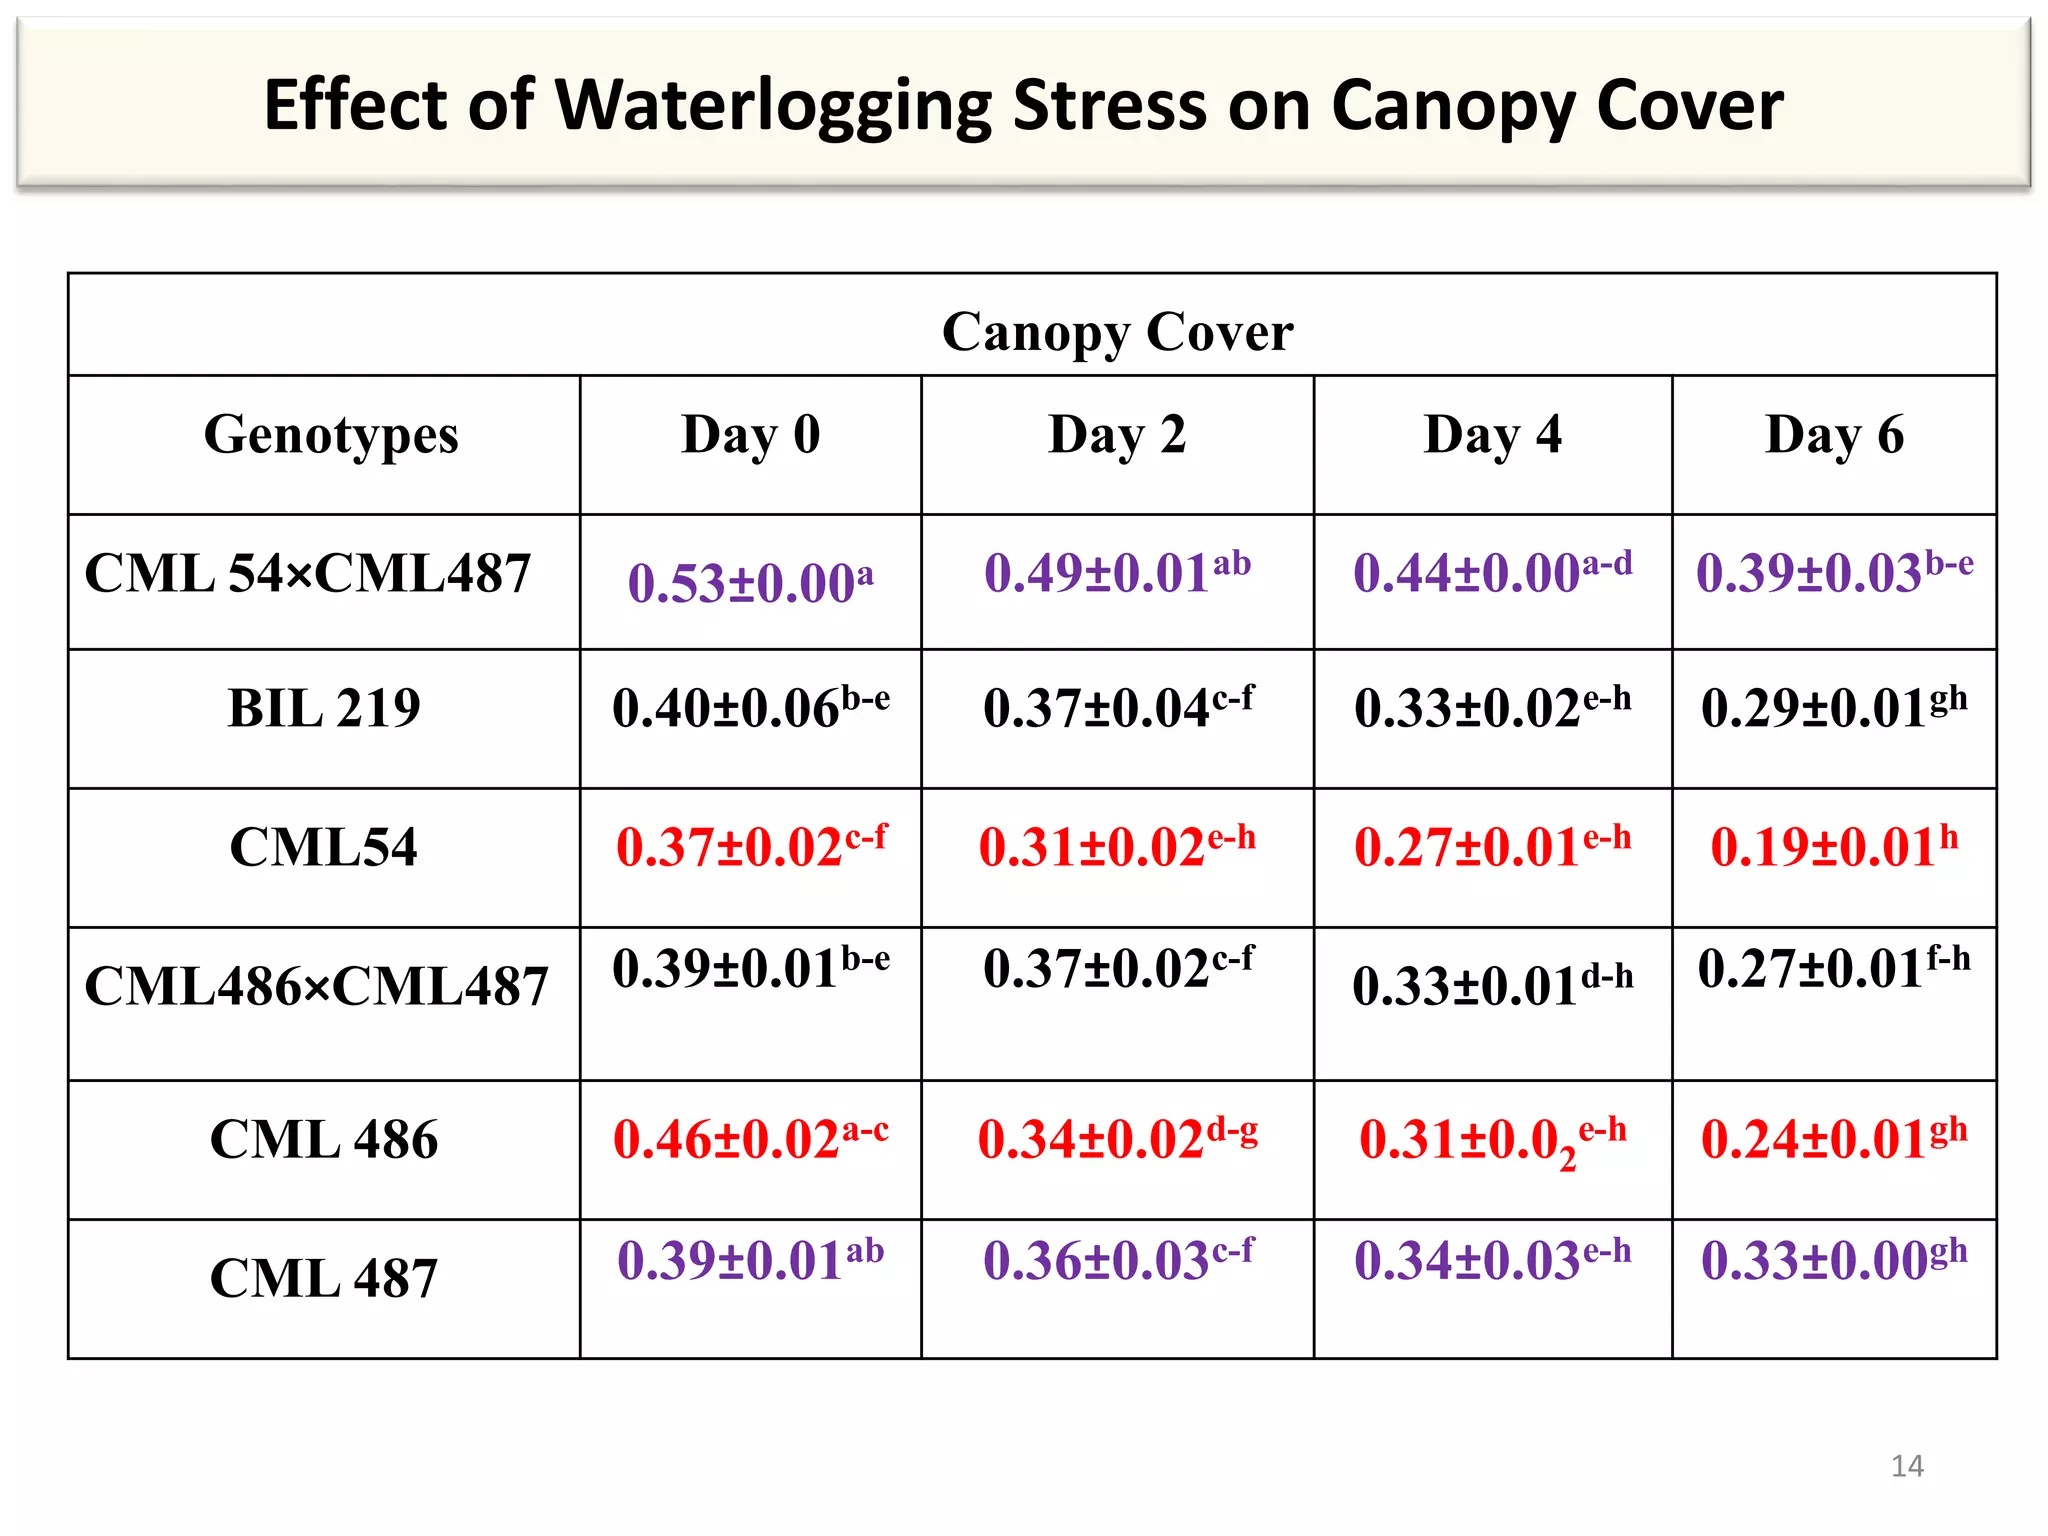
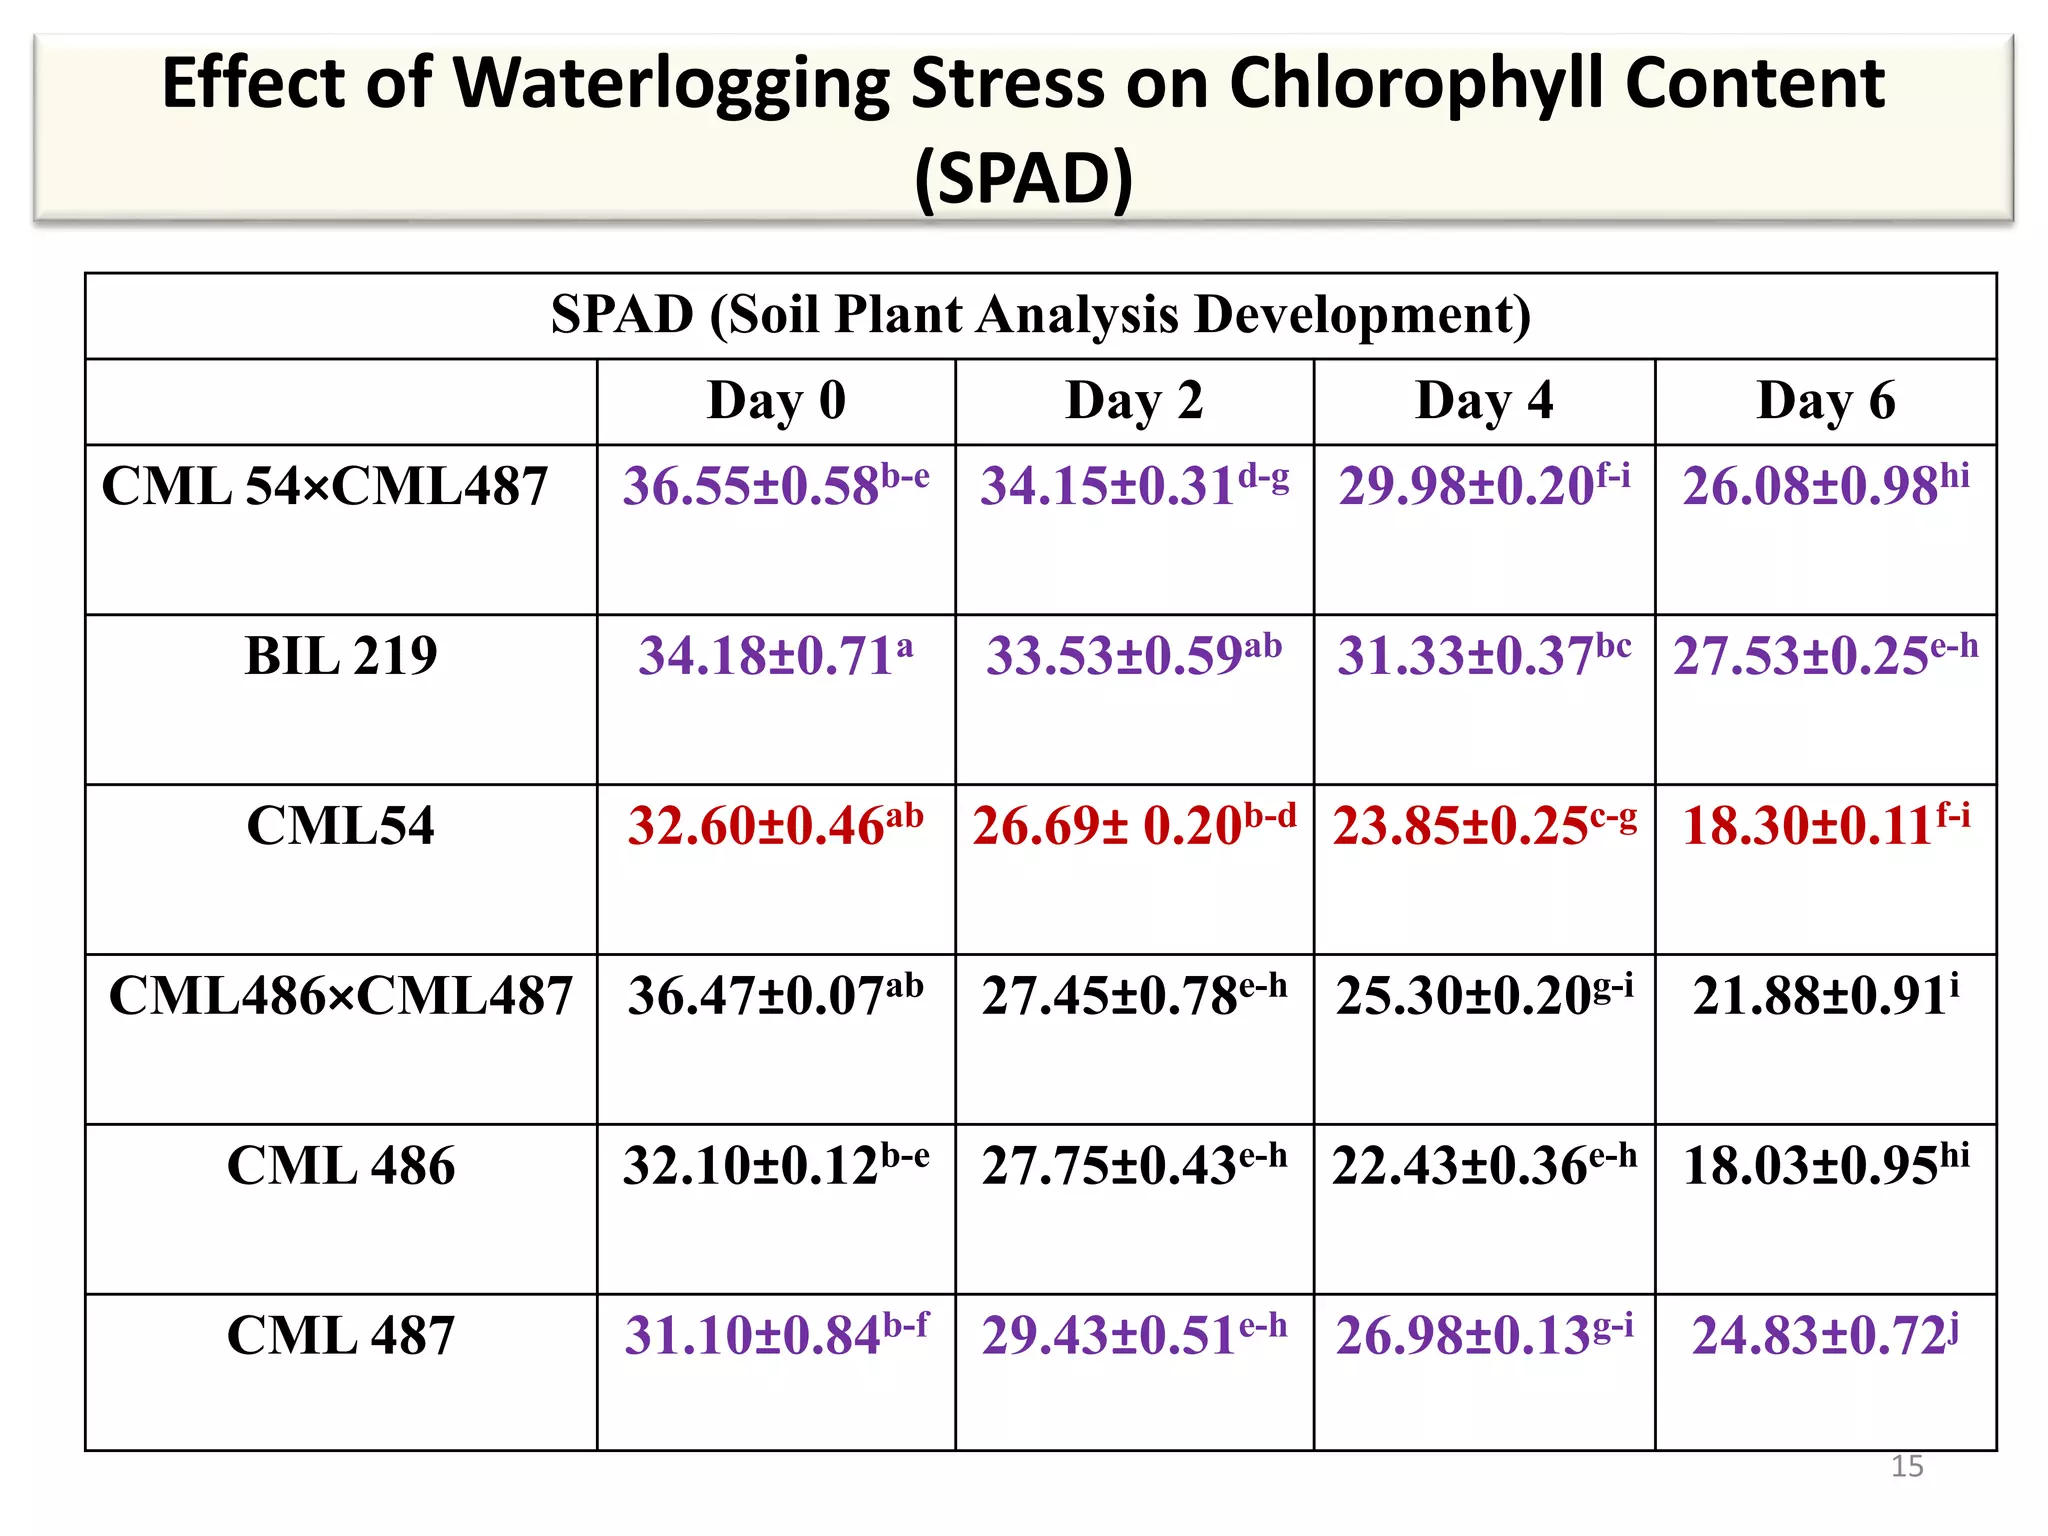
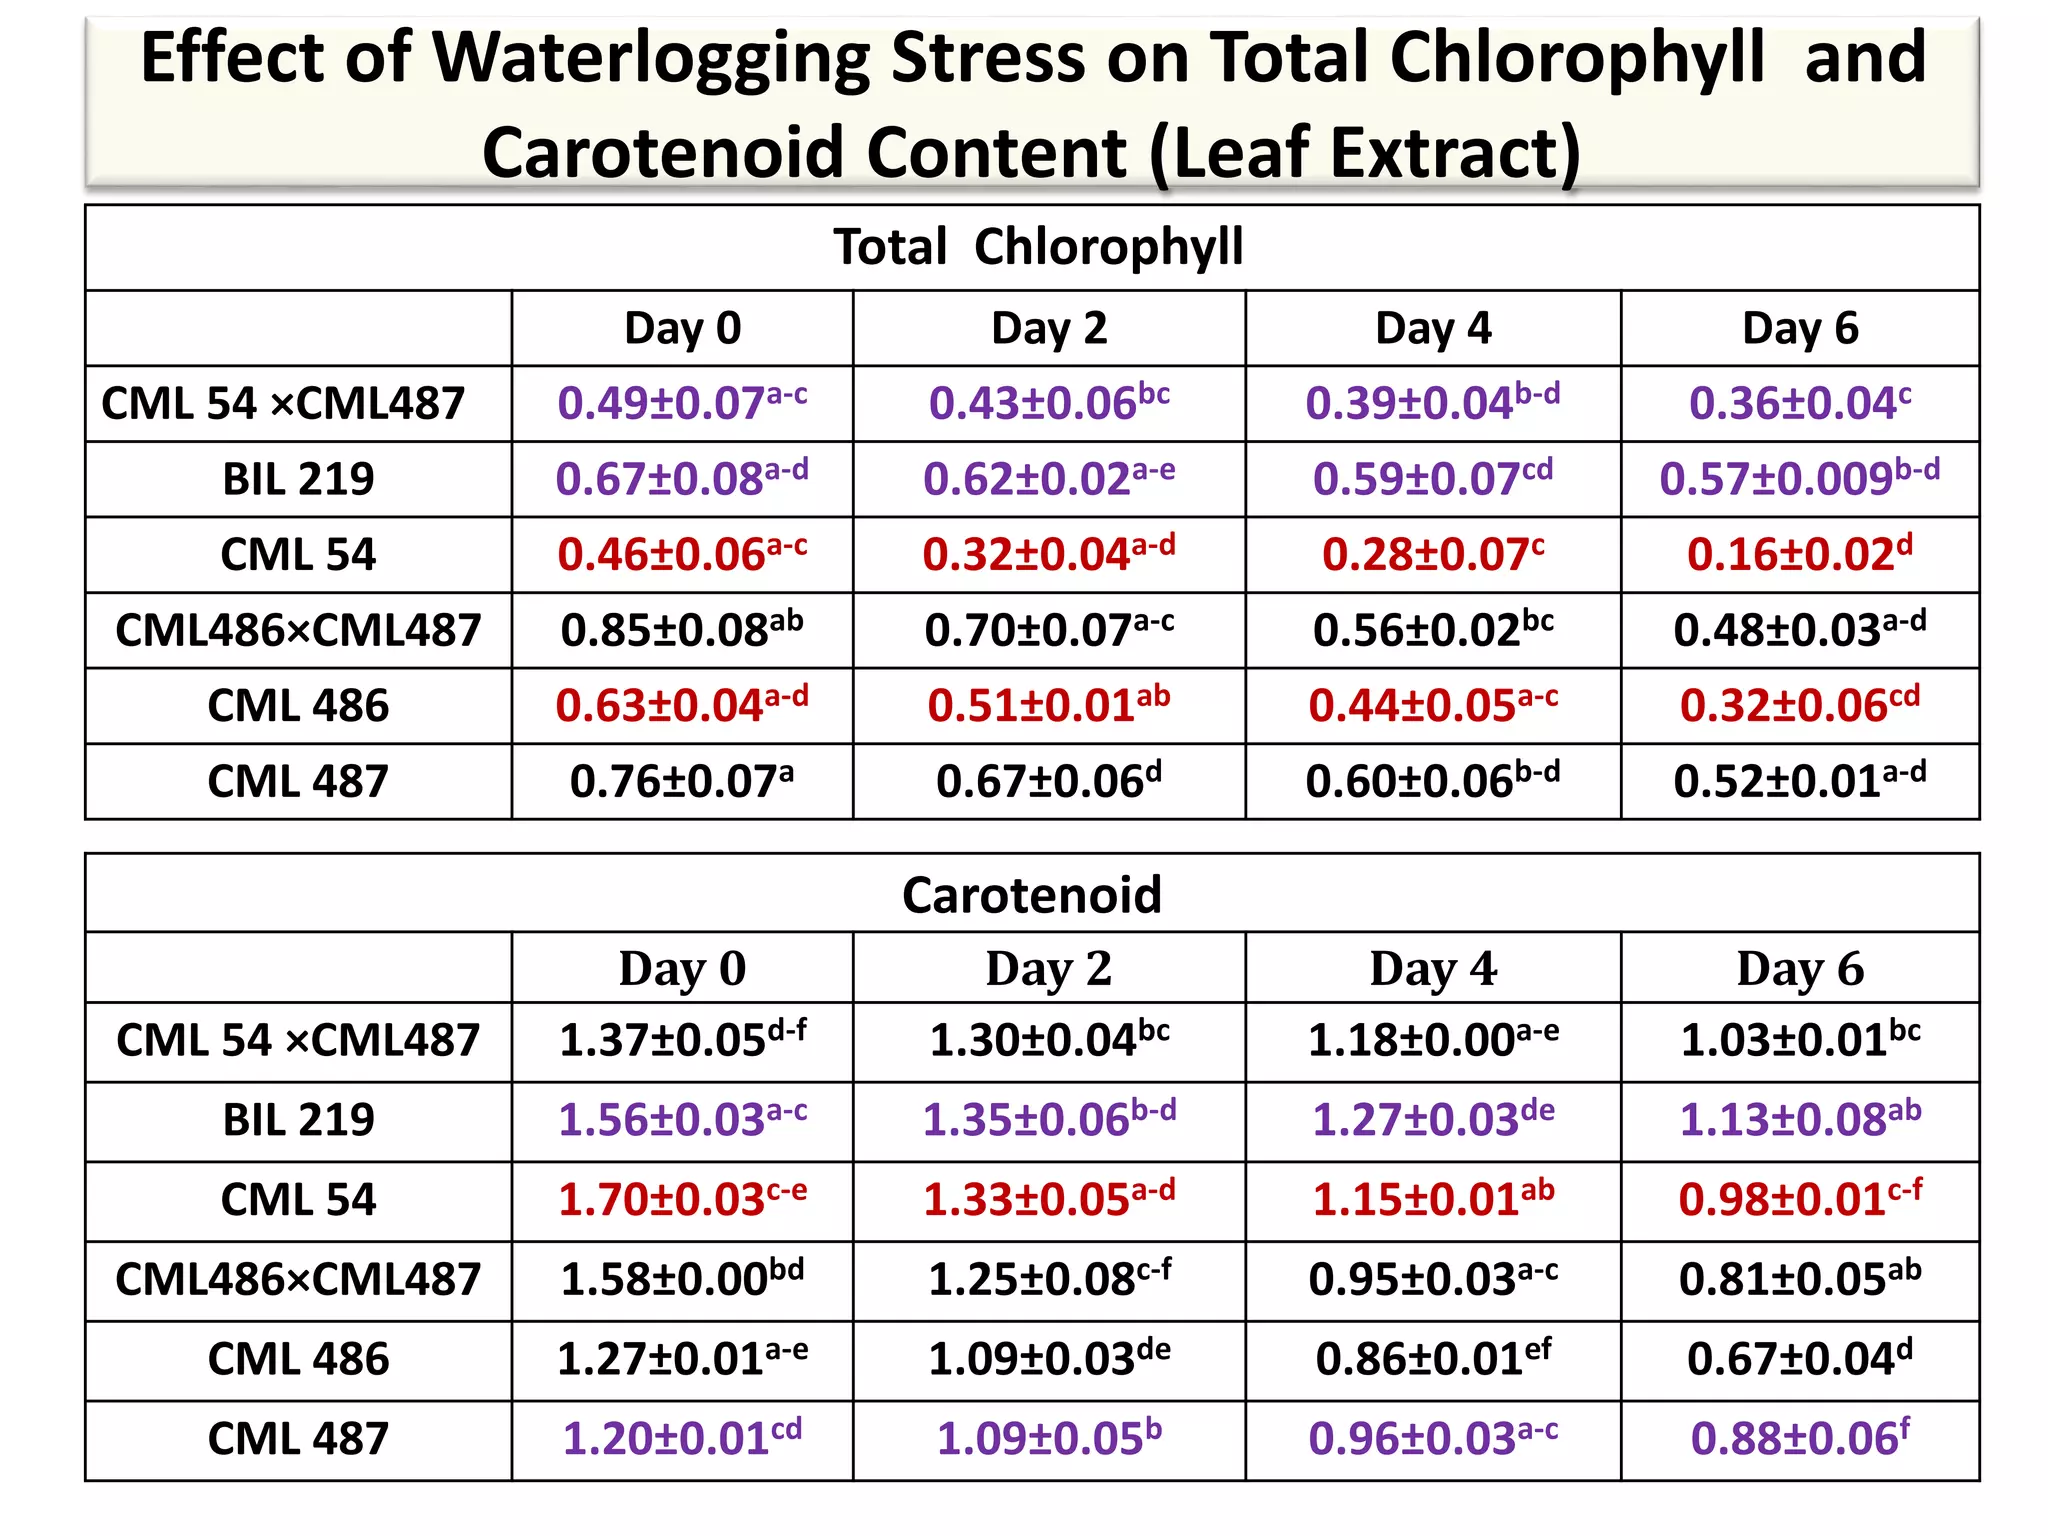
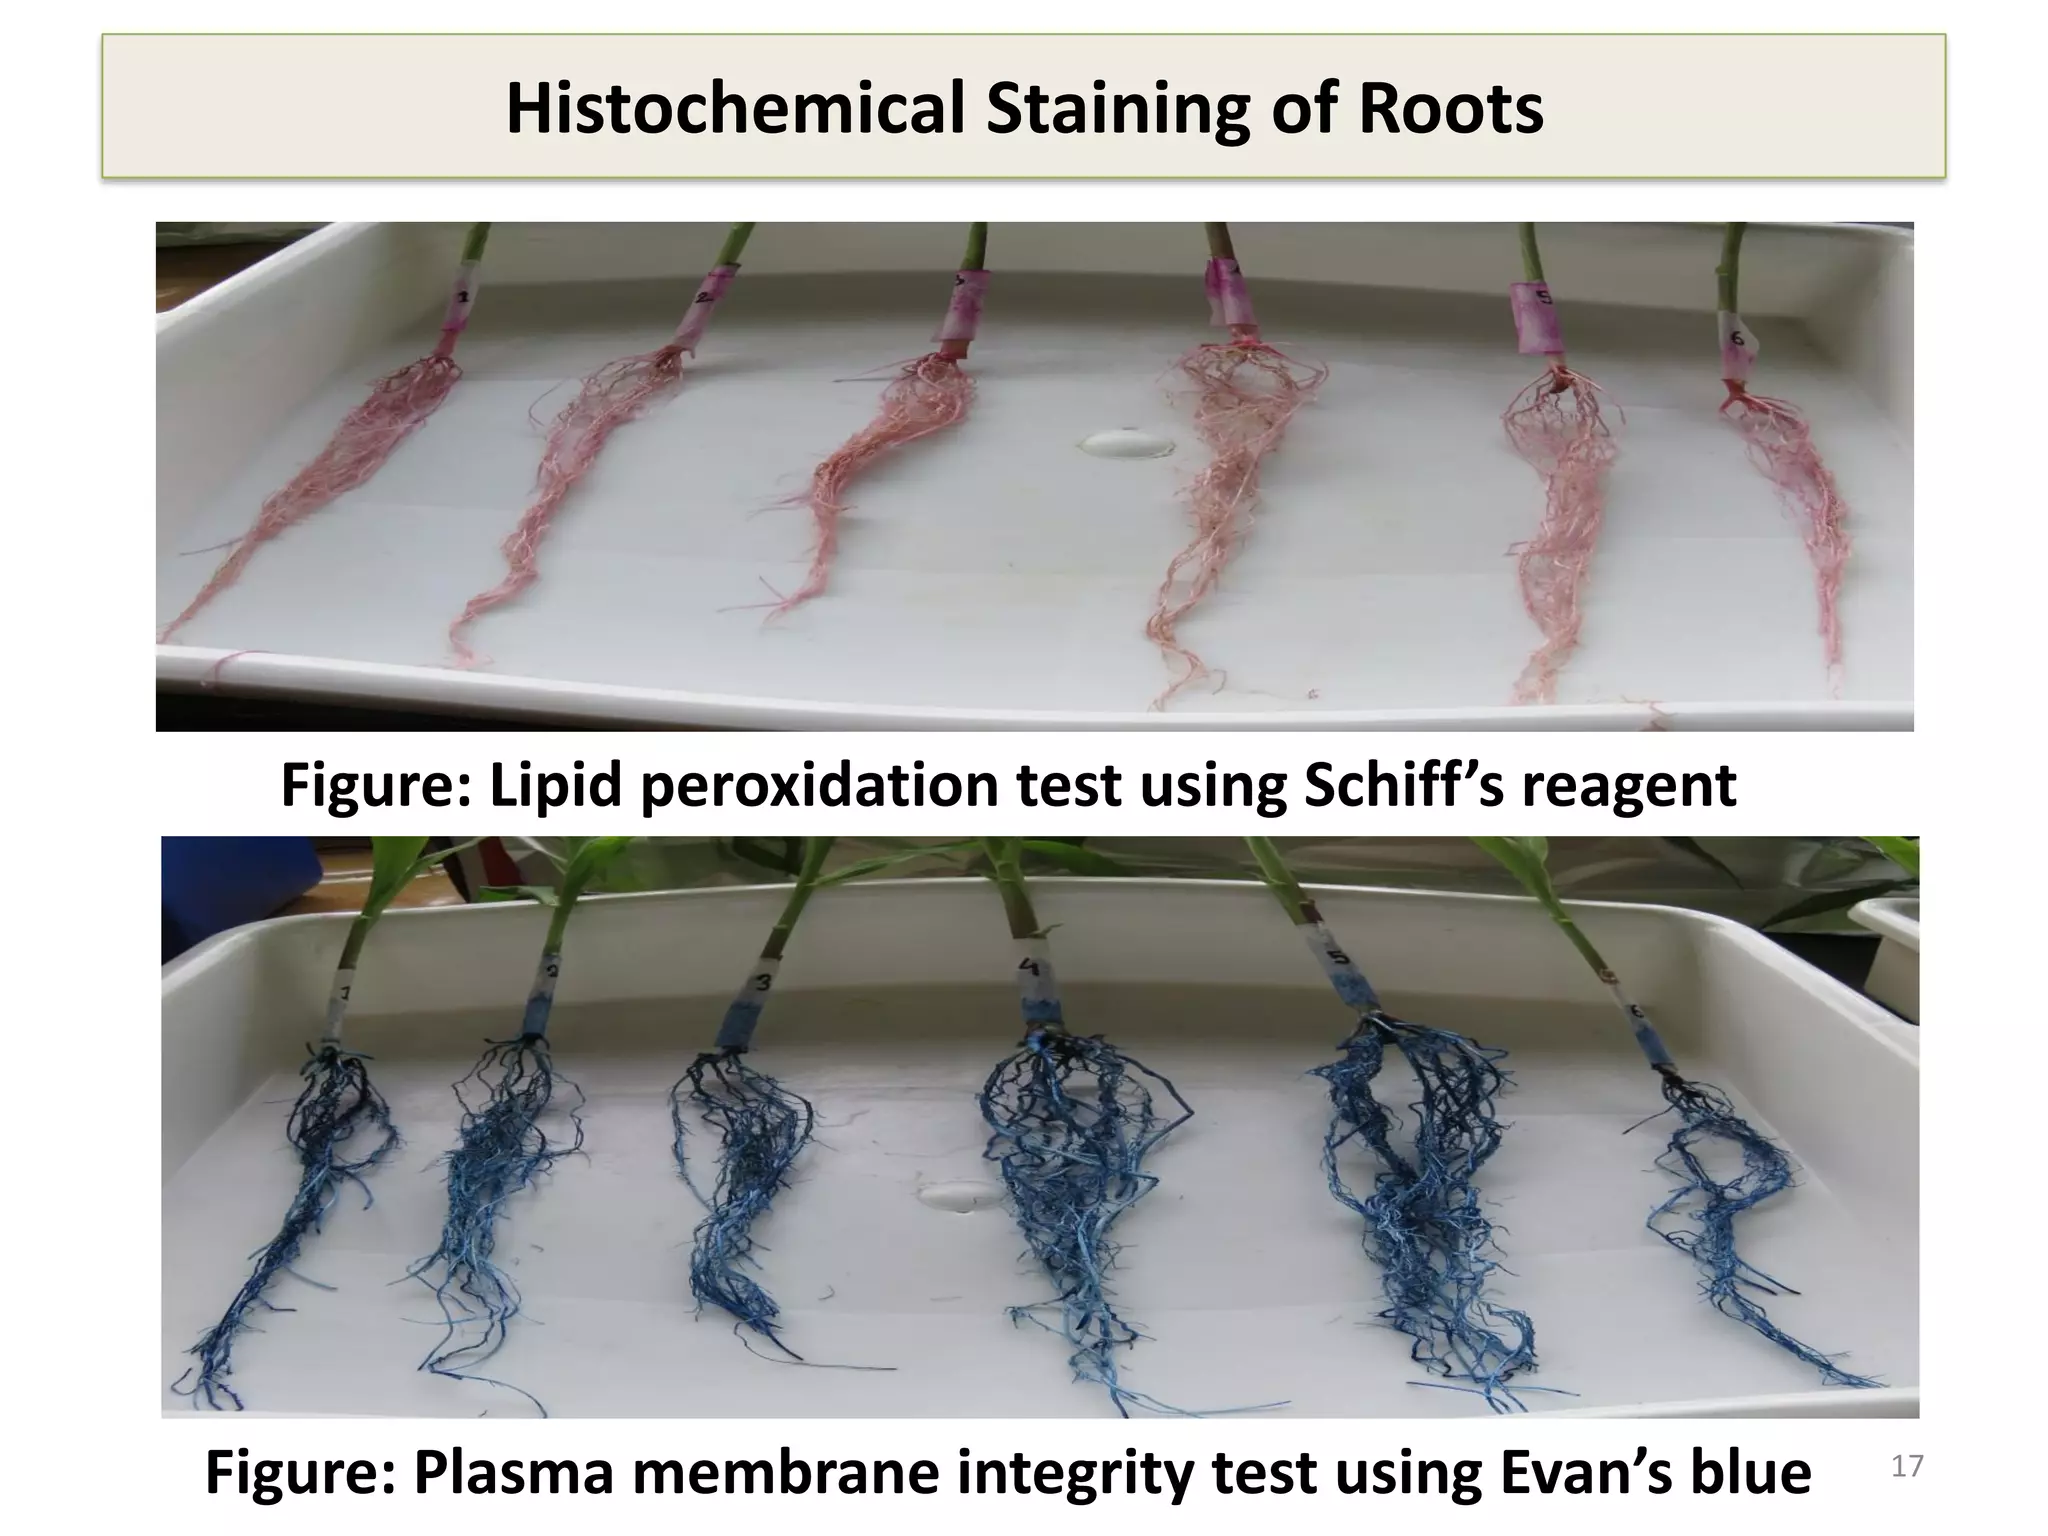
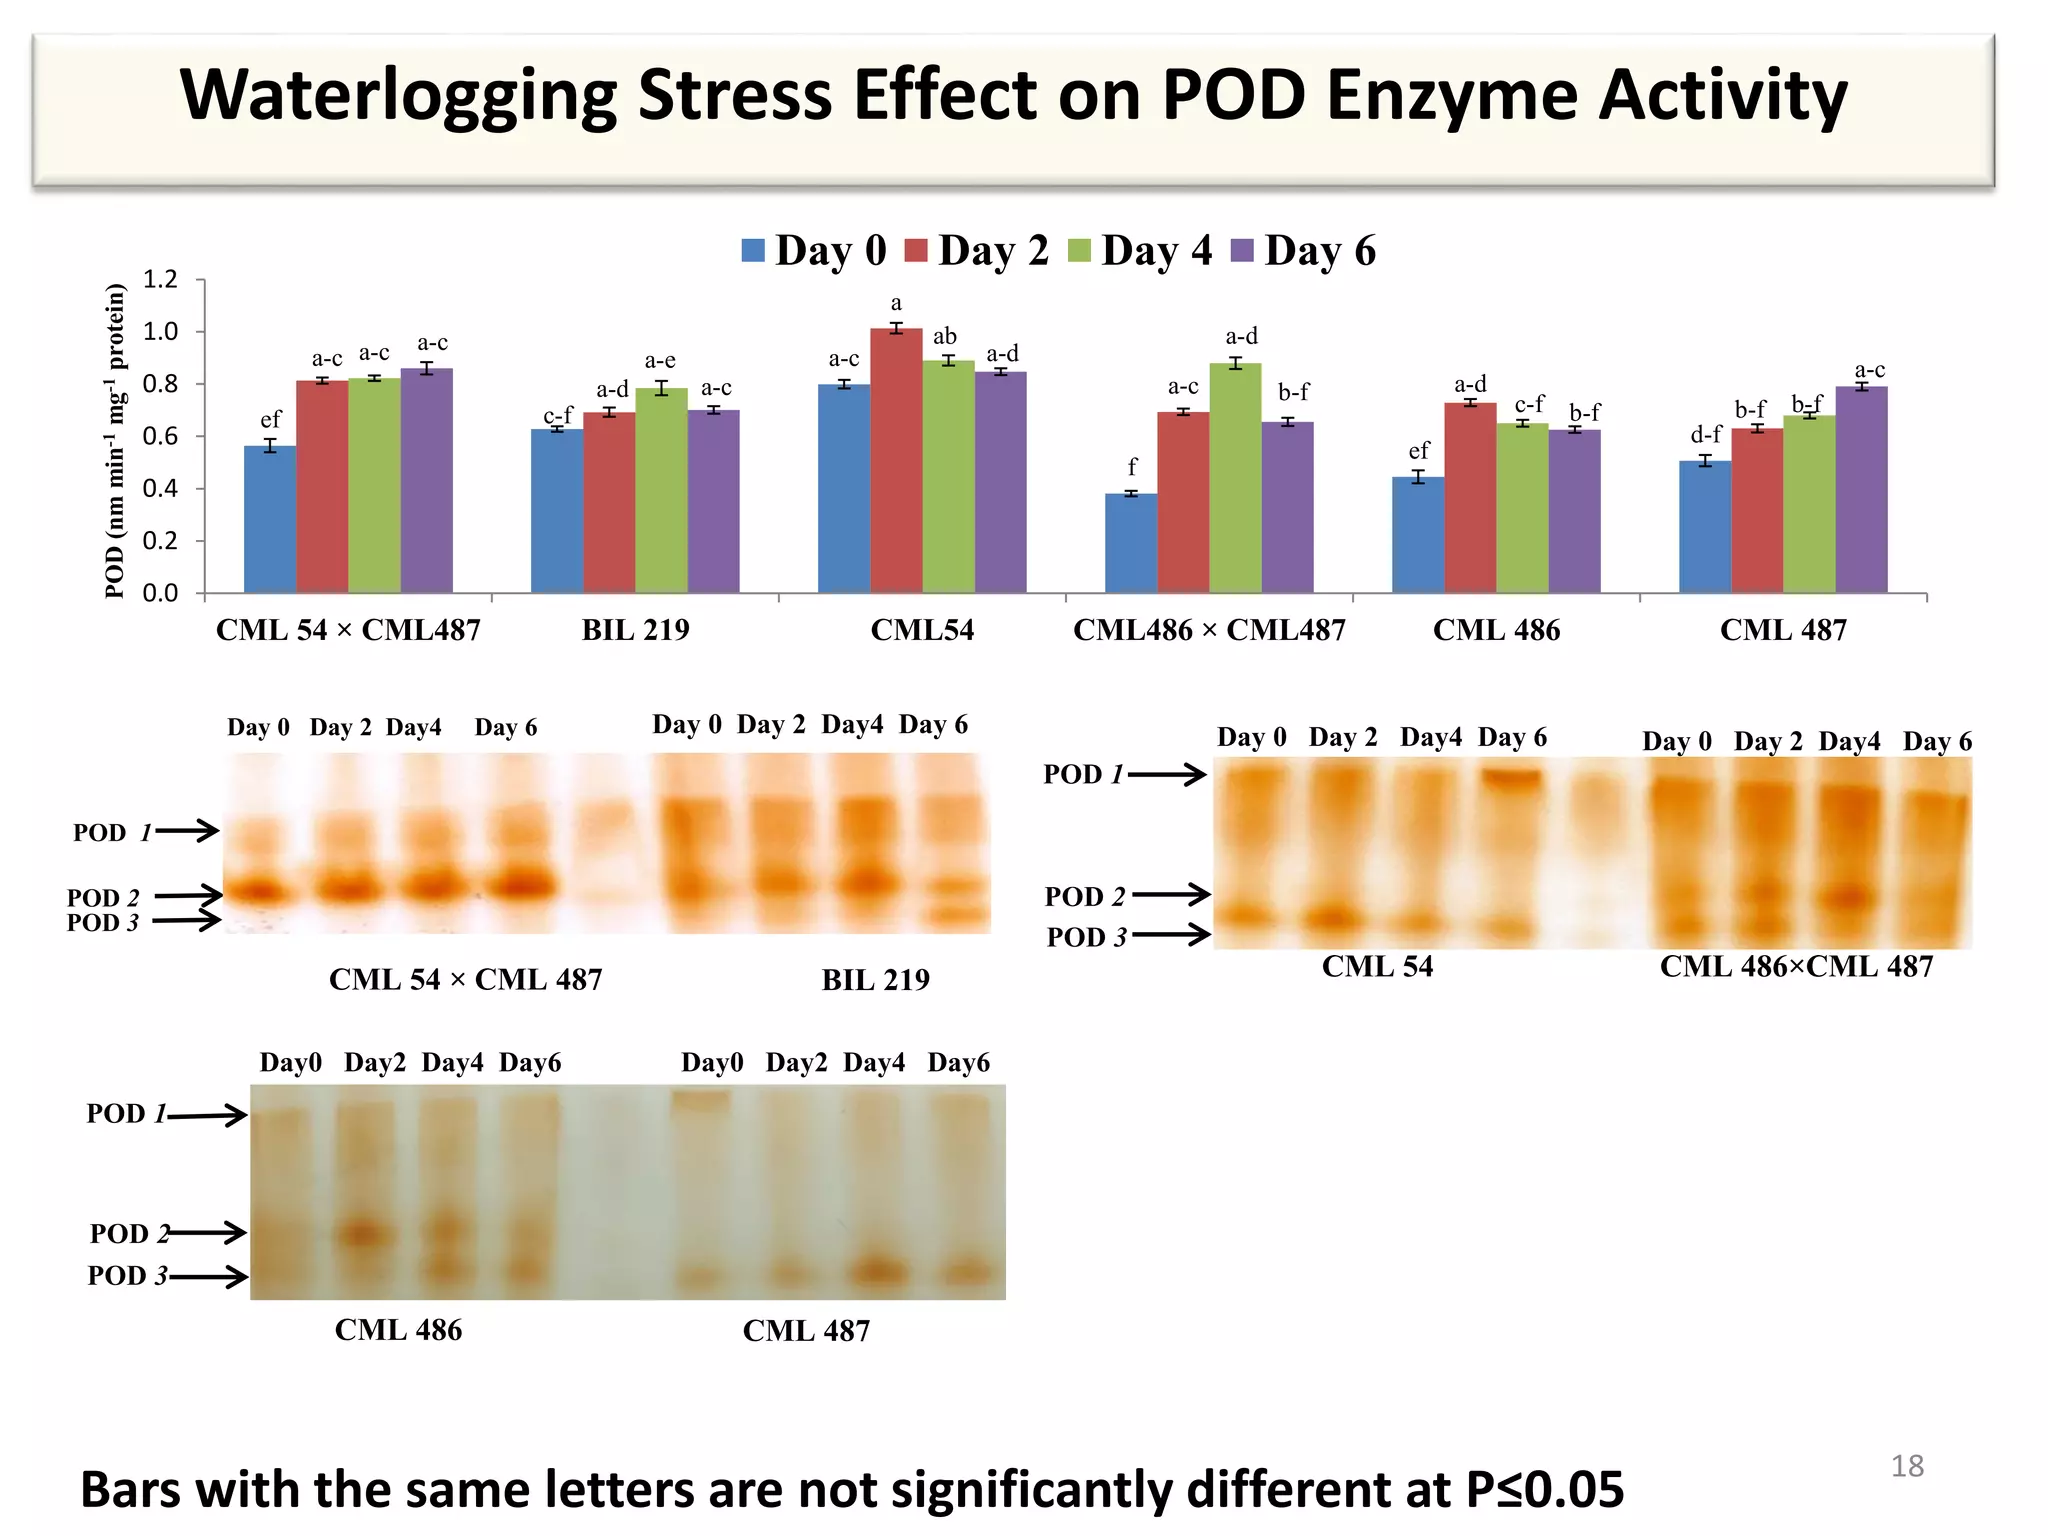
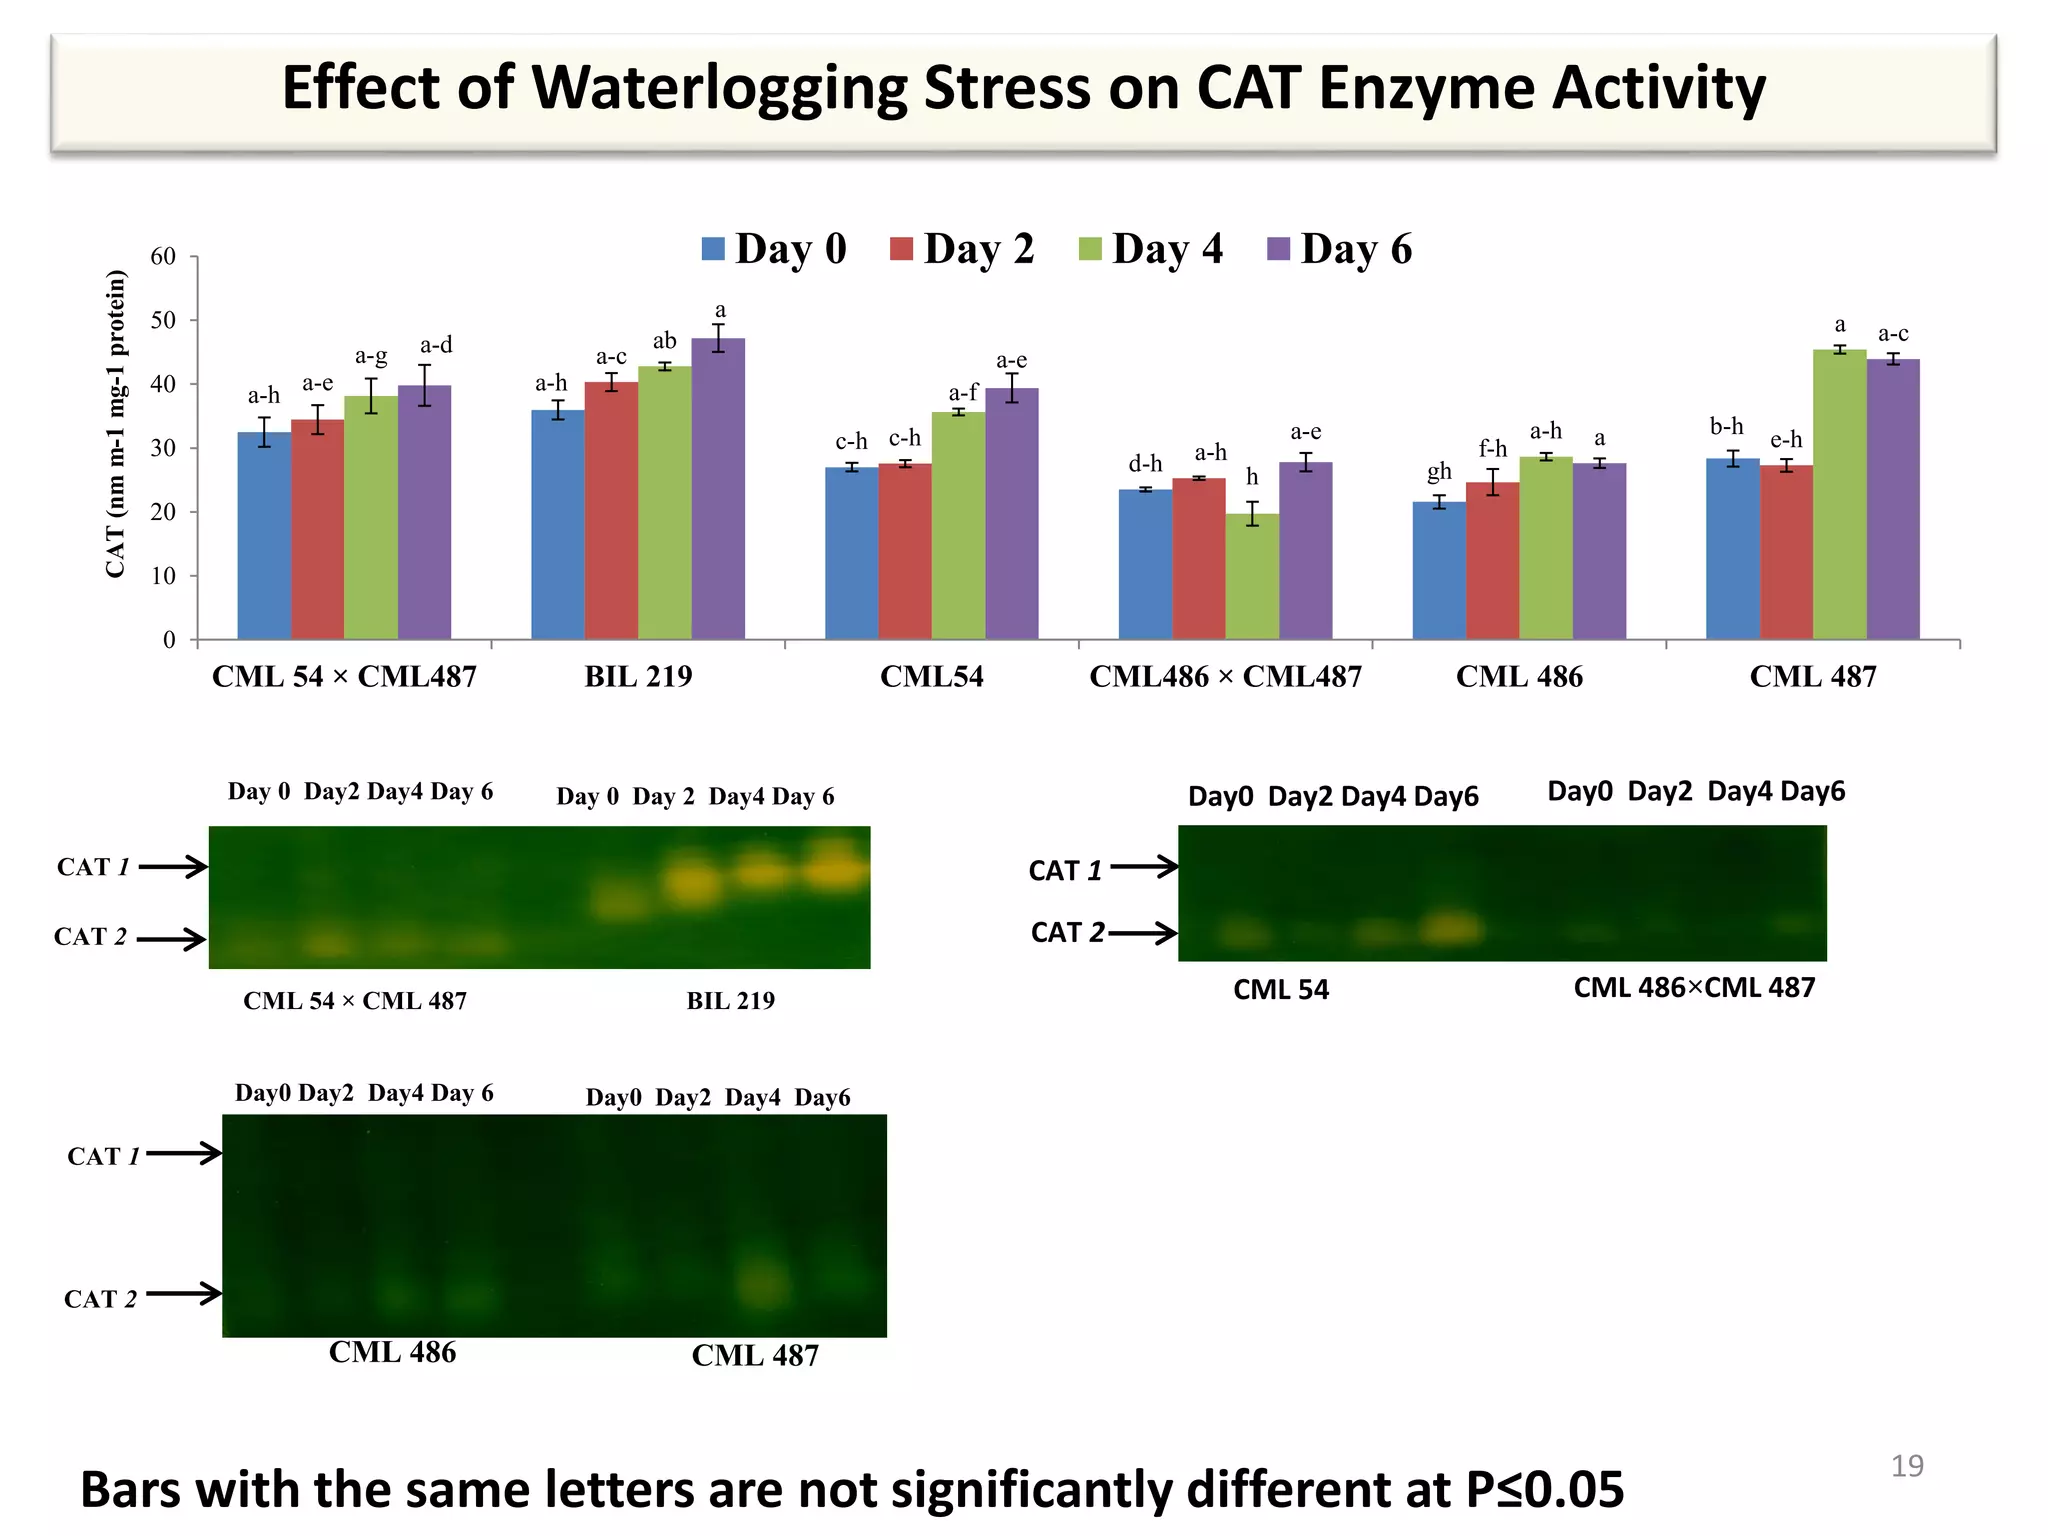
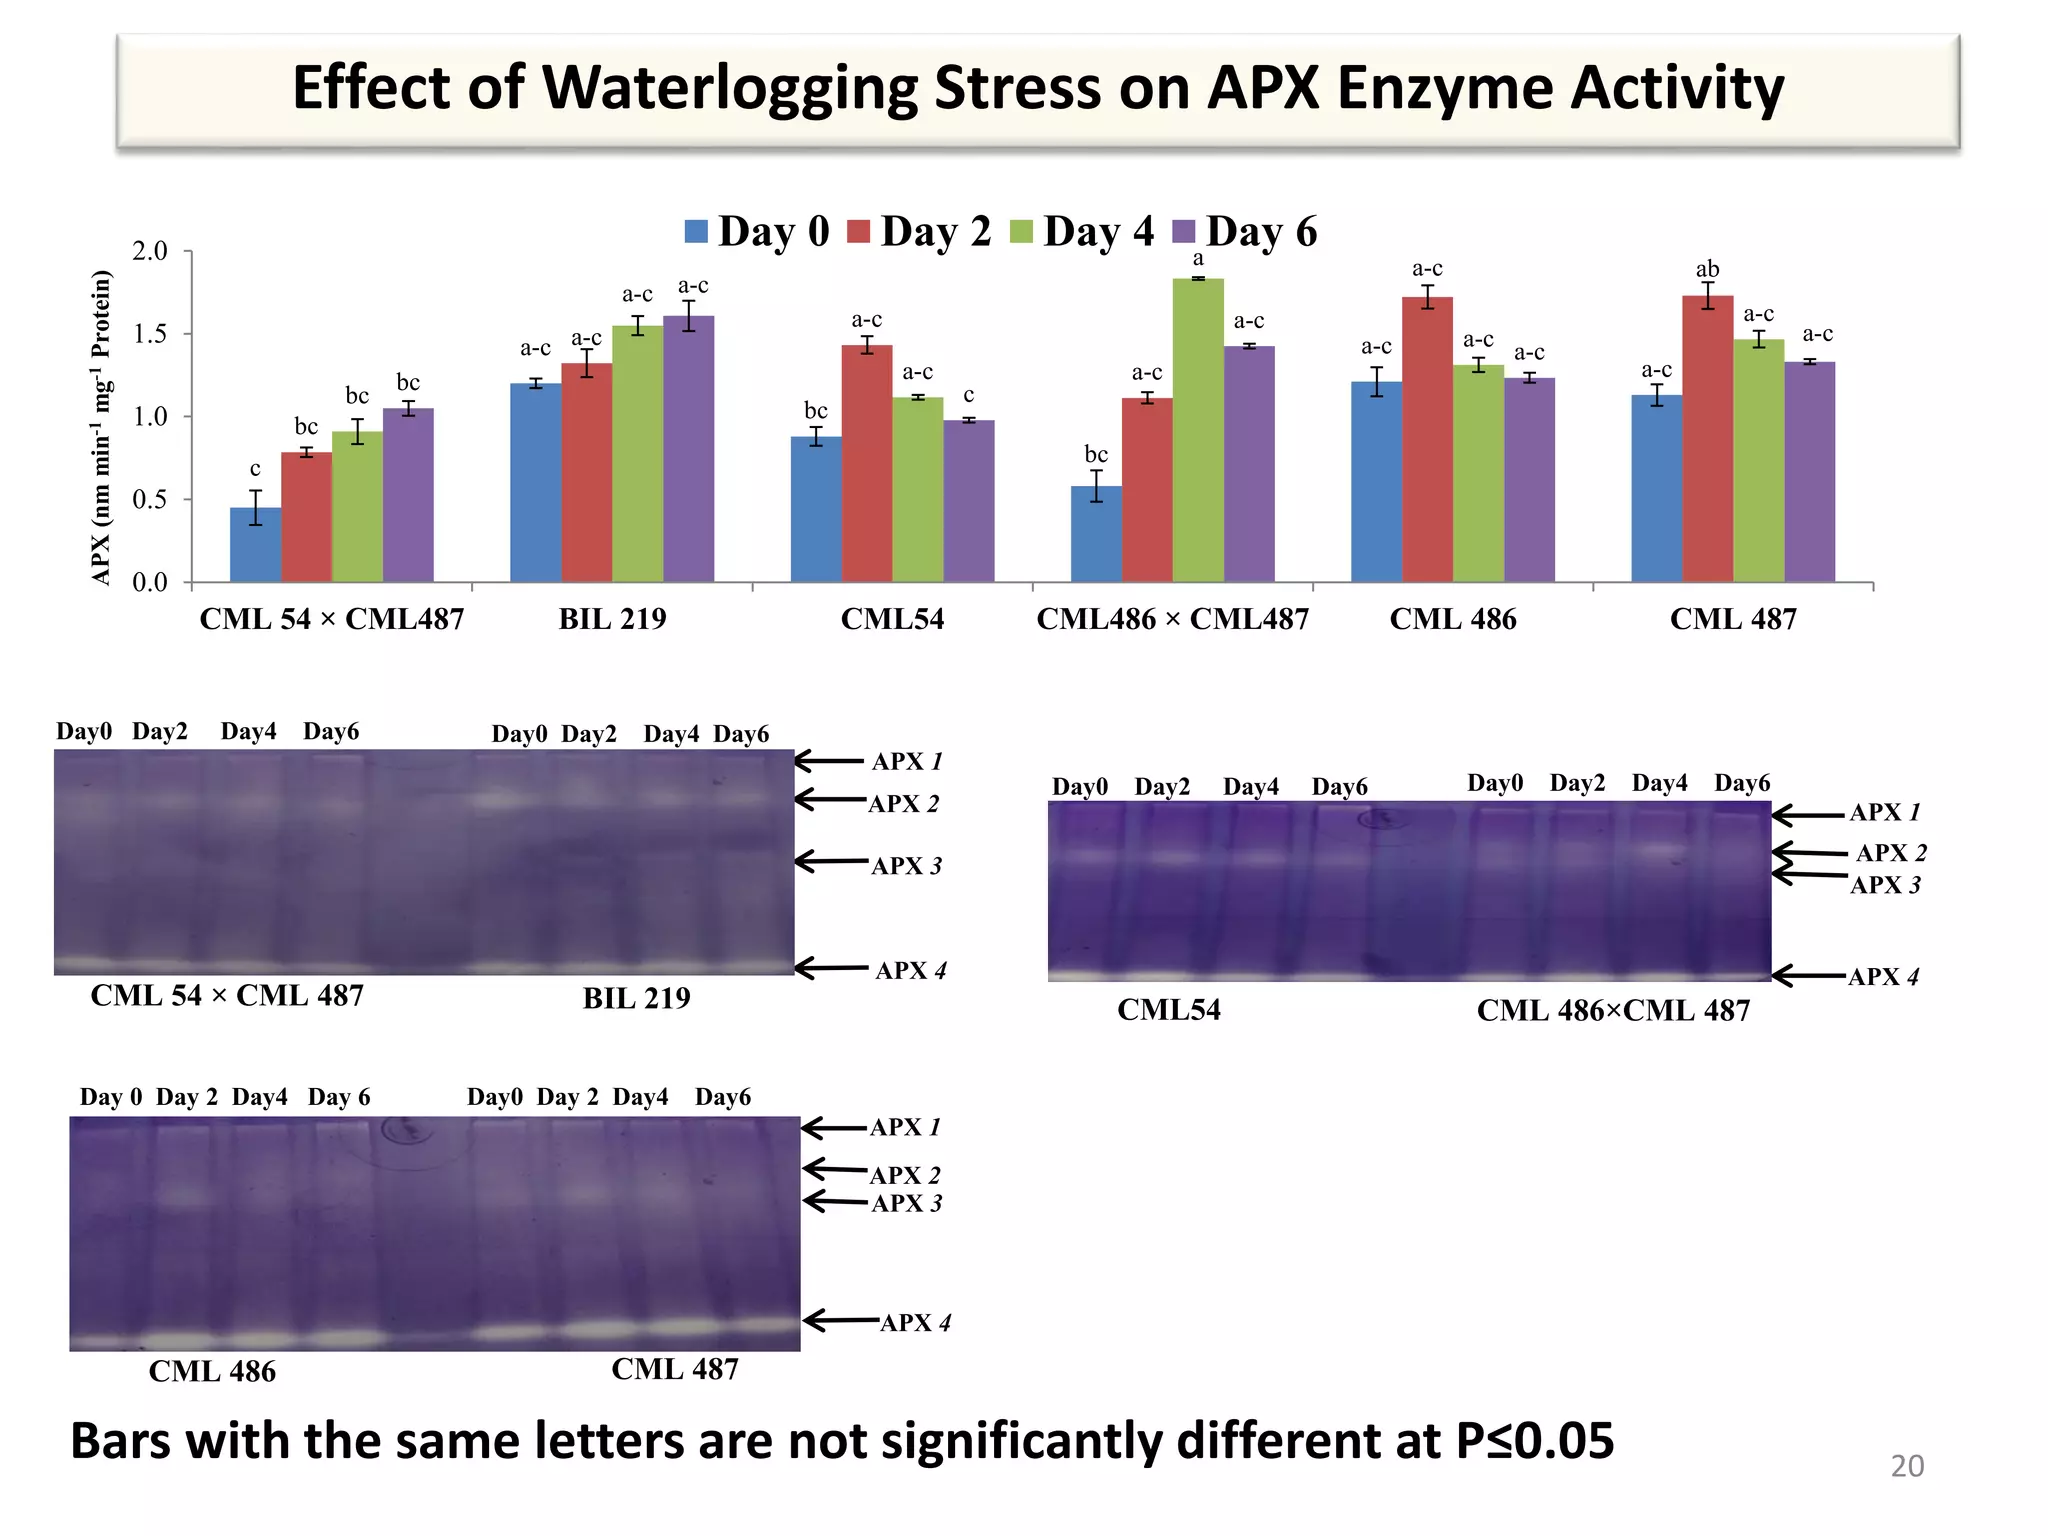
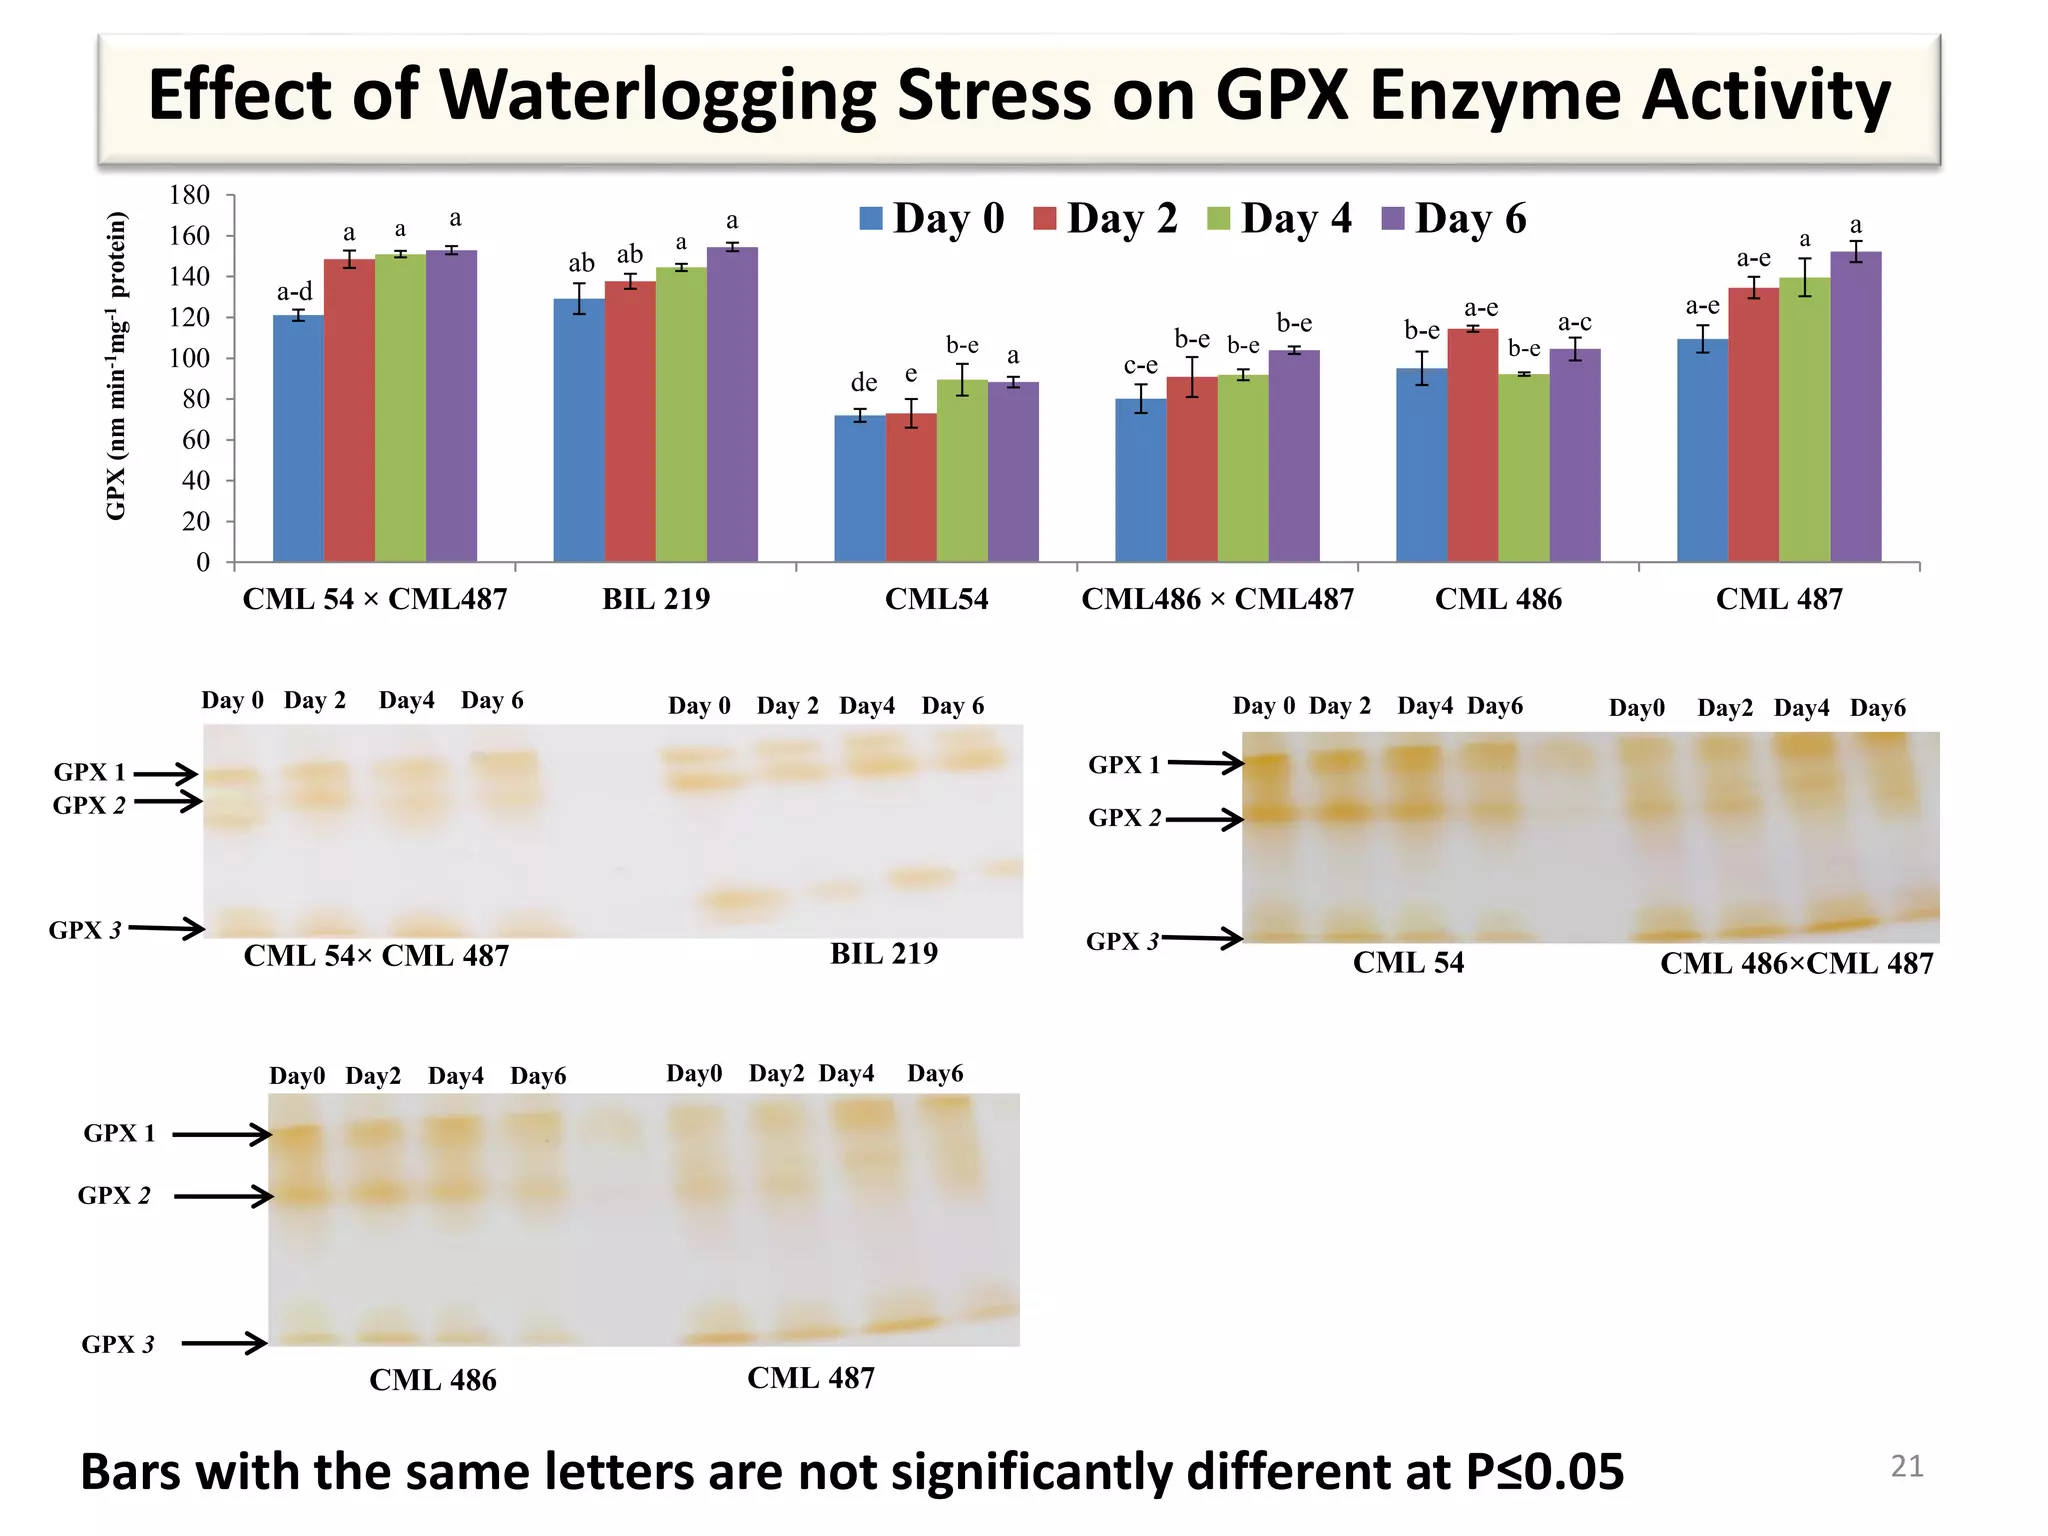

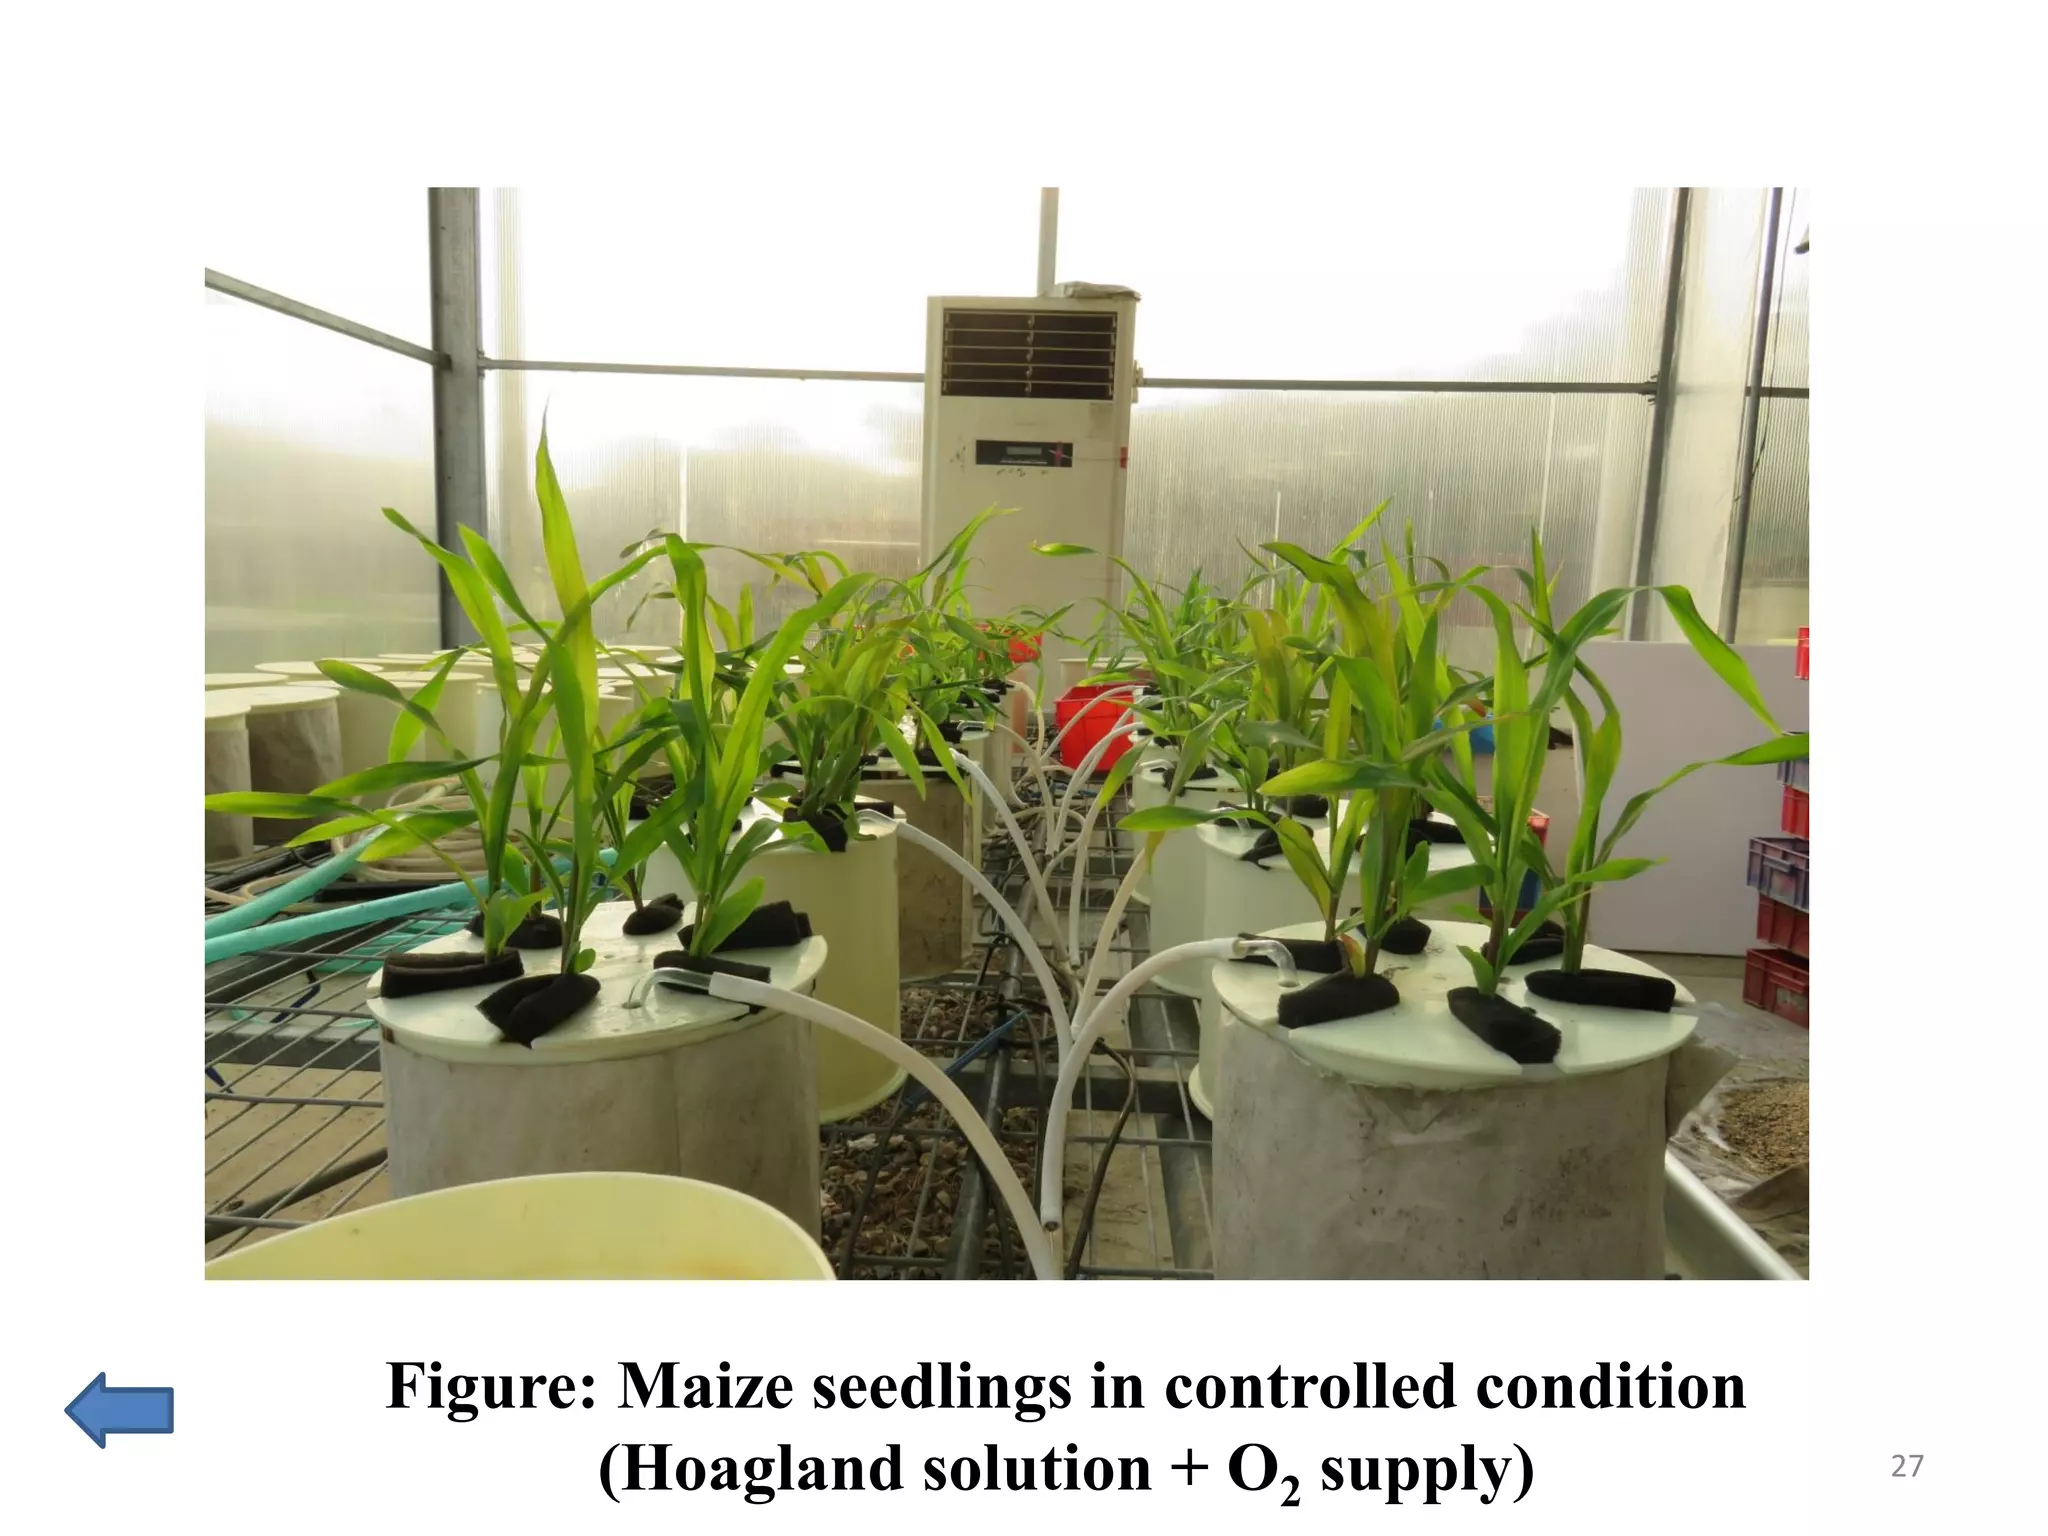
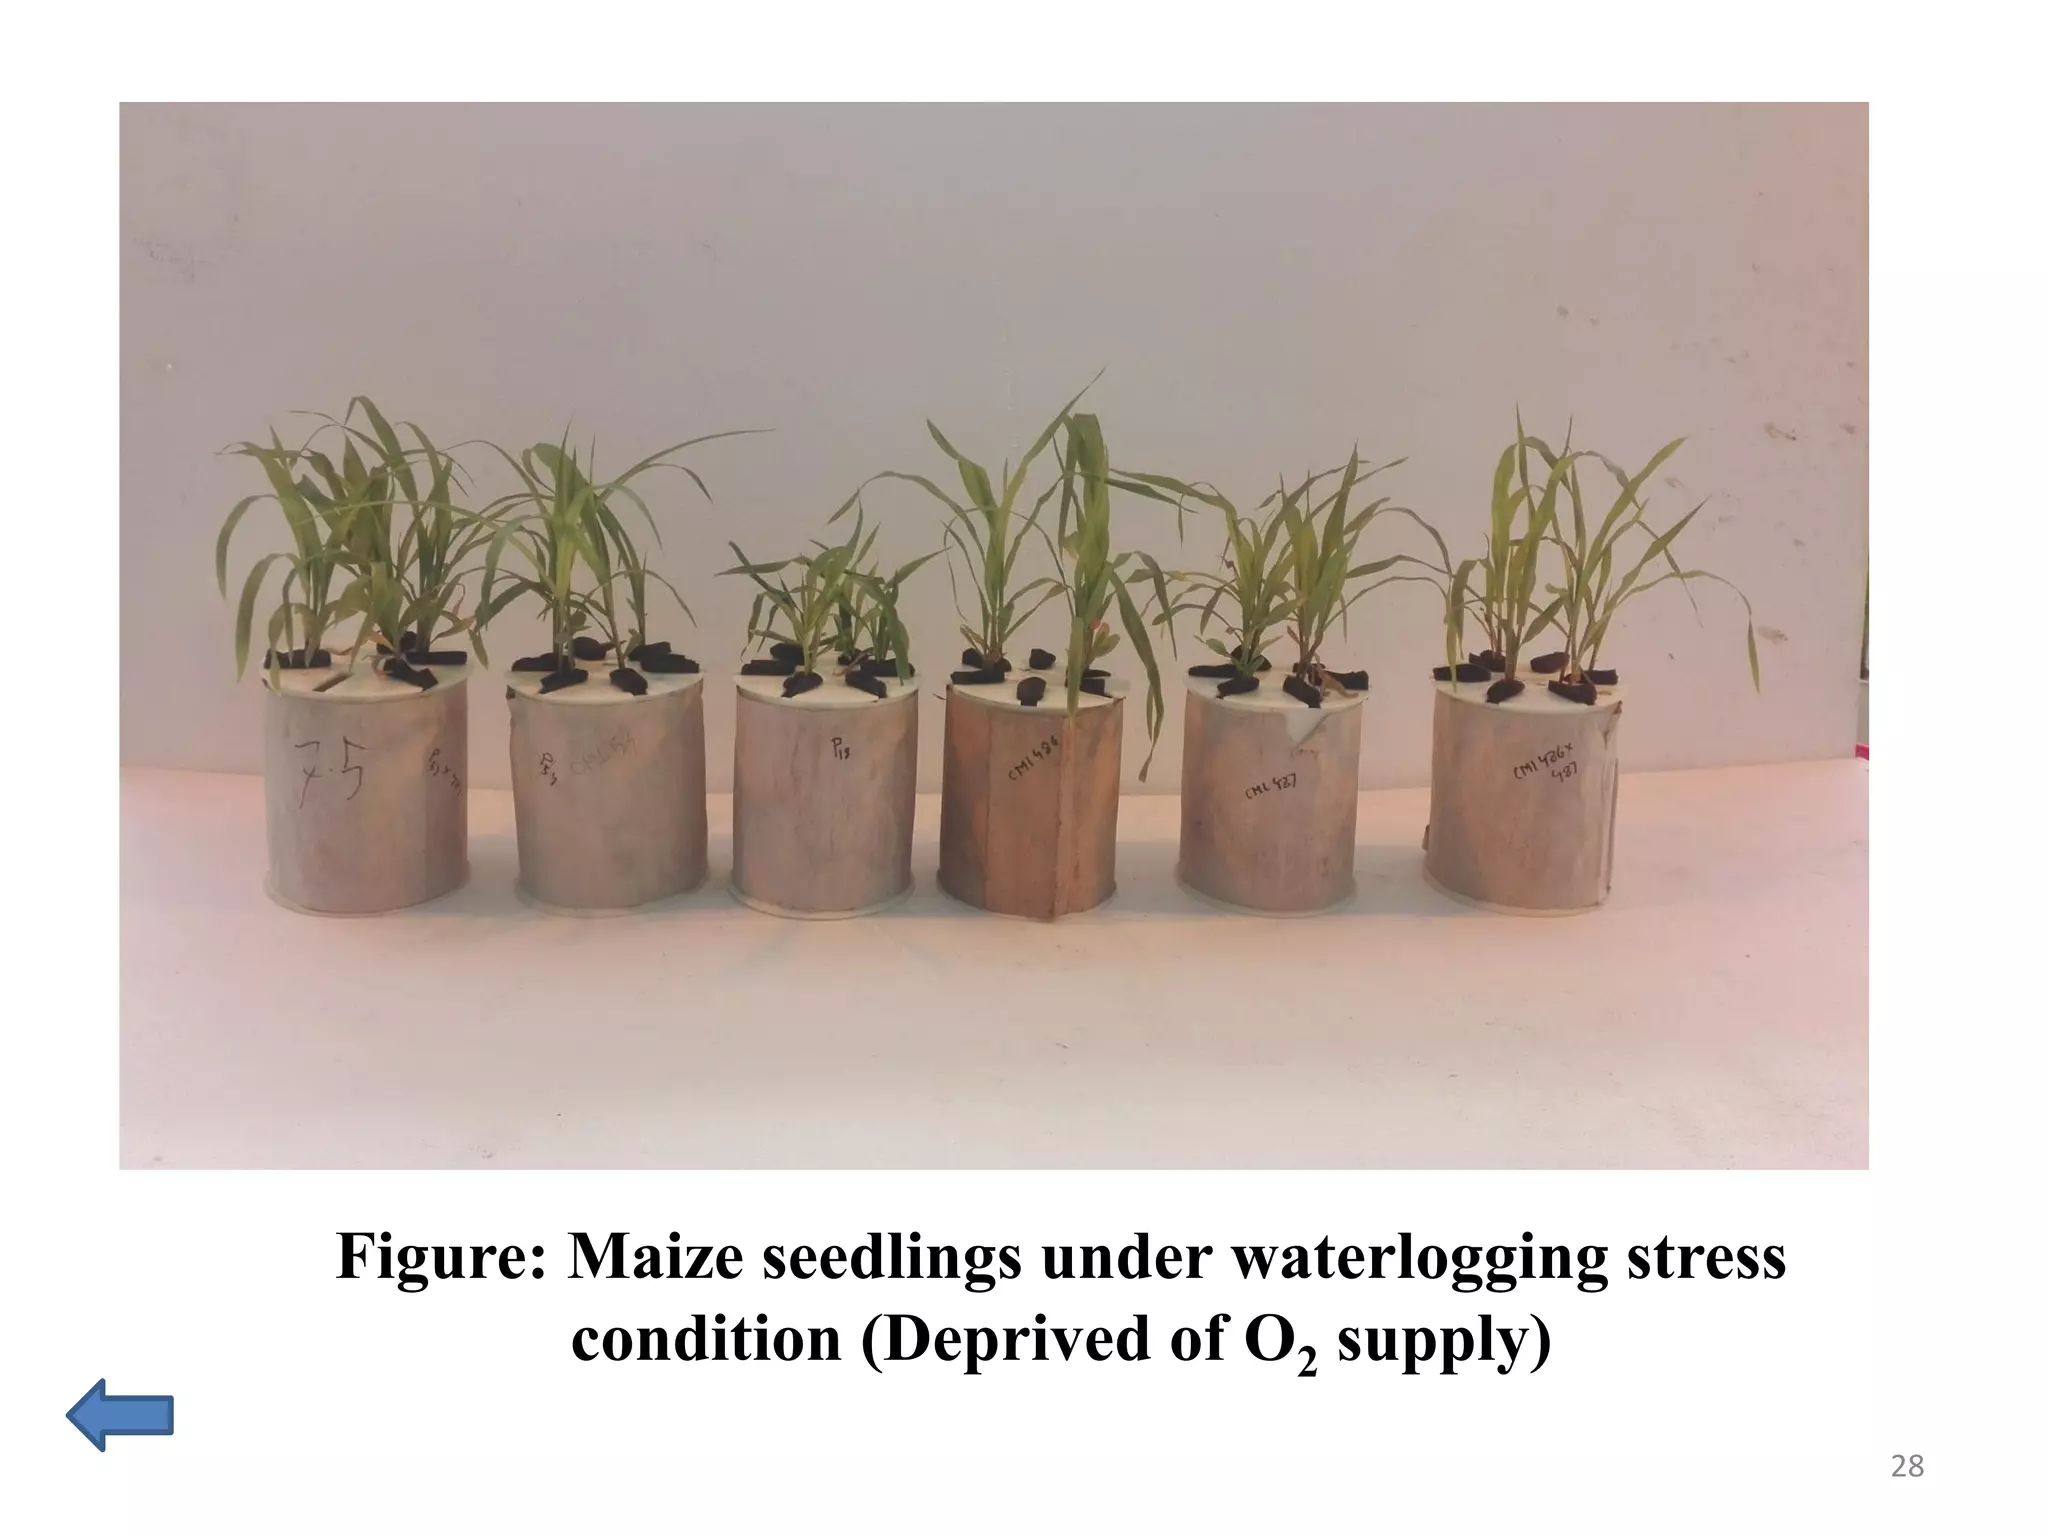

This study compared the biochemical and physiological responses of six maize genotypes under waterlogging stress conditions. The genotypes differed in their canopy cover, chlorophyll content, membrane damage, and antioxidant enzyme activity when exposed to waterlogging over six days. CML 54 x CML 487, BIL 219 and CML 487 showed the best performance under stress, with higher antioxidant enzyme activities and less membrane damage and chlorophyll loss. CML 54 and CML 486 were the most susceptible. The tolerant genotypes will be targets for future breeding programs to develop waterlogging tolerance in maize.


