Download as PDF, PPTX
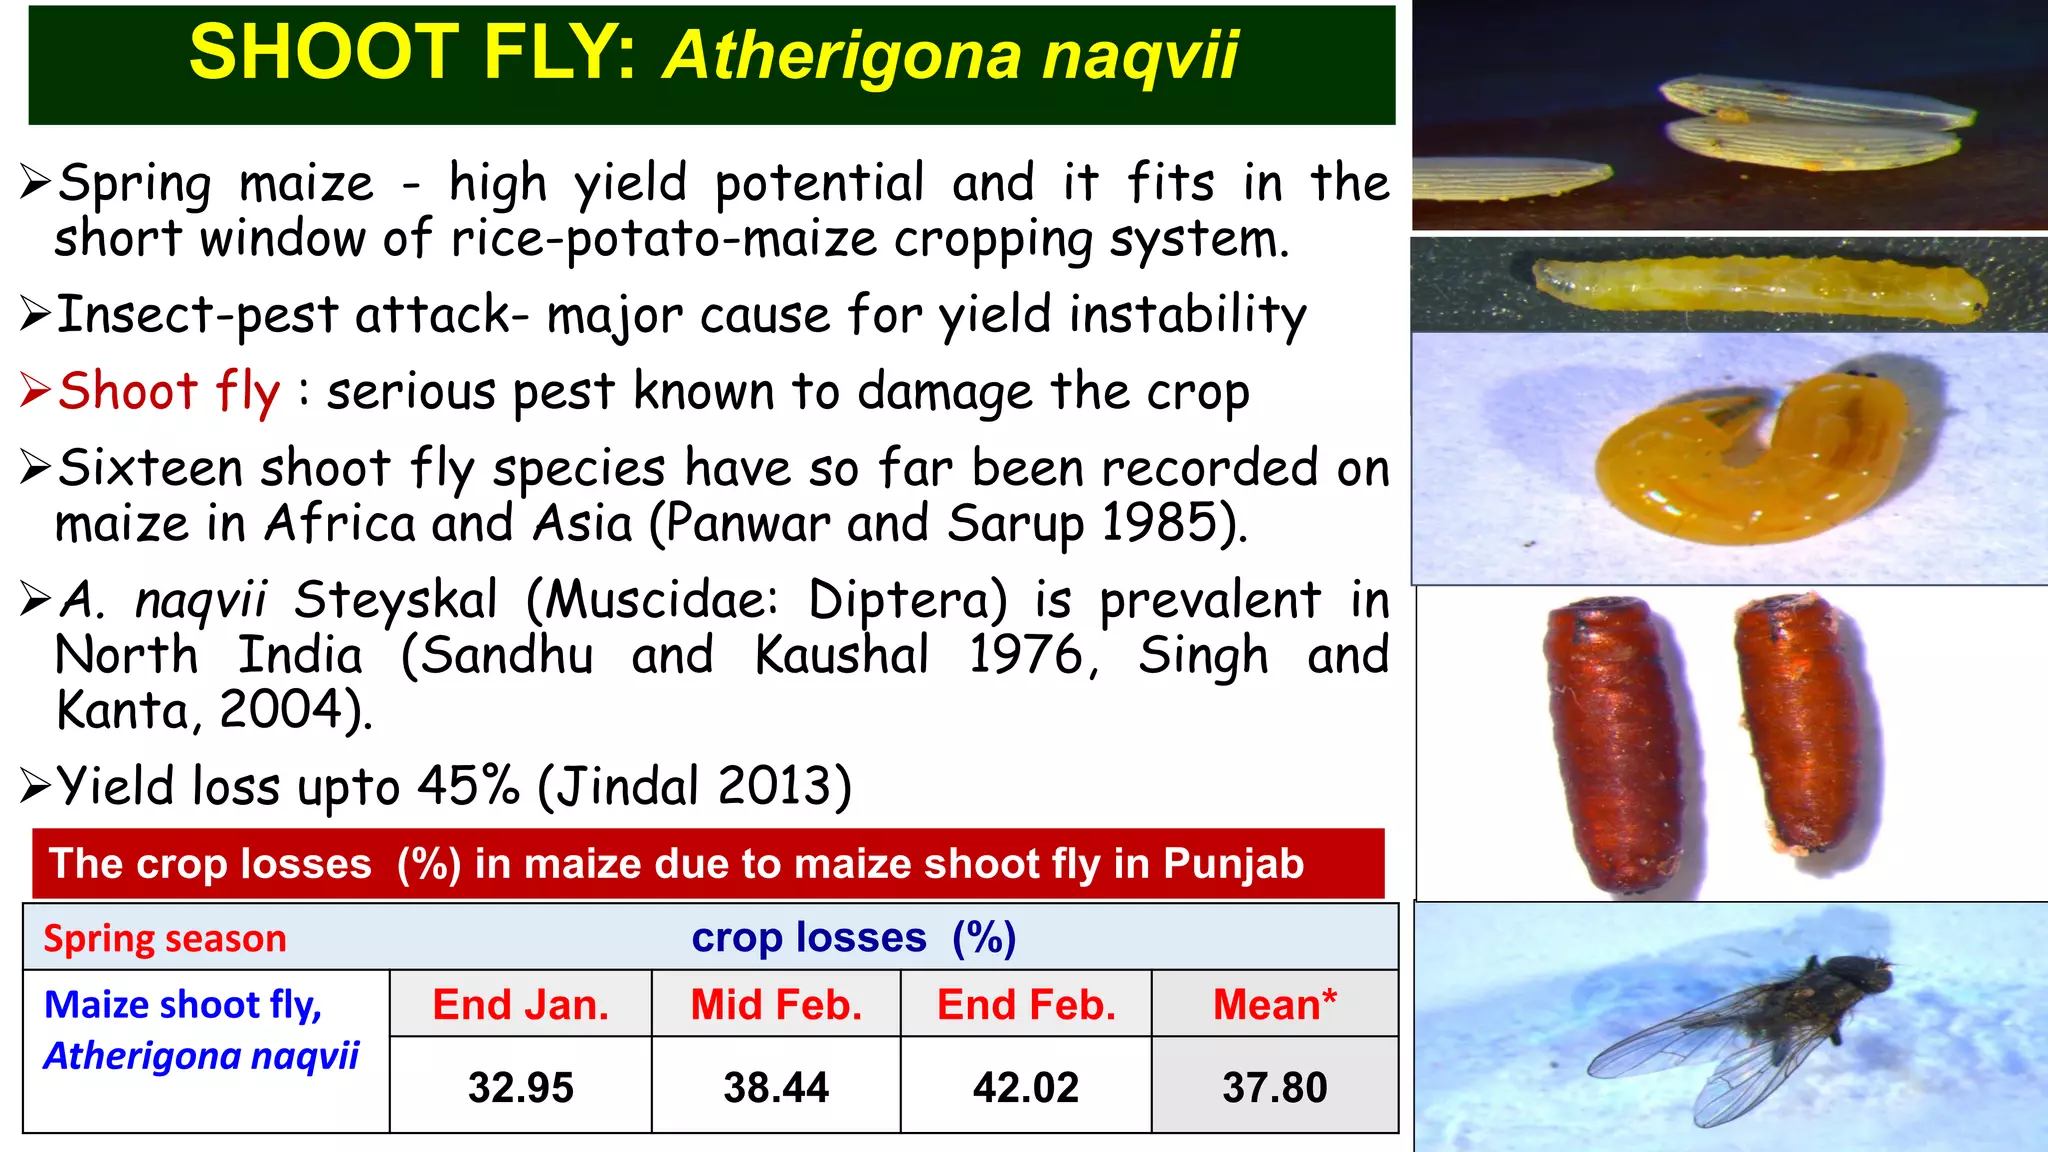
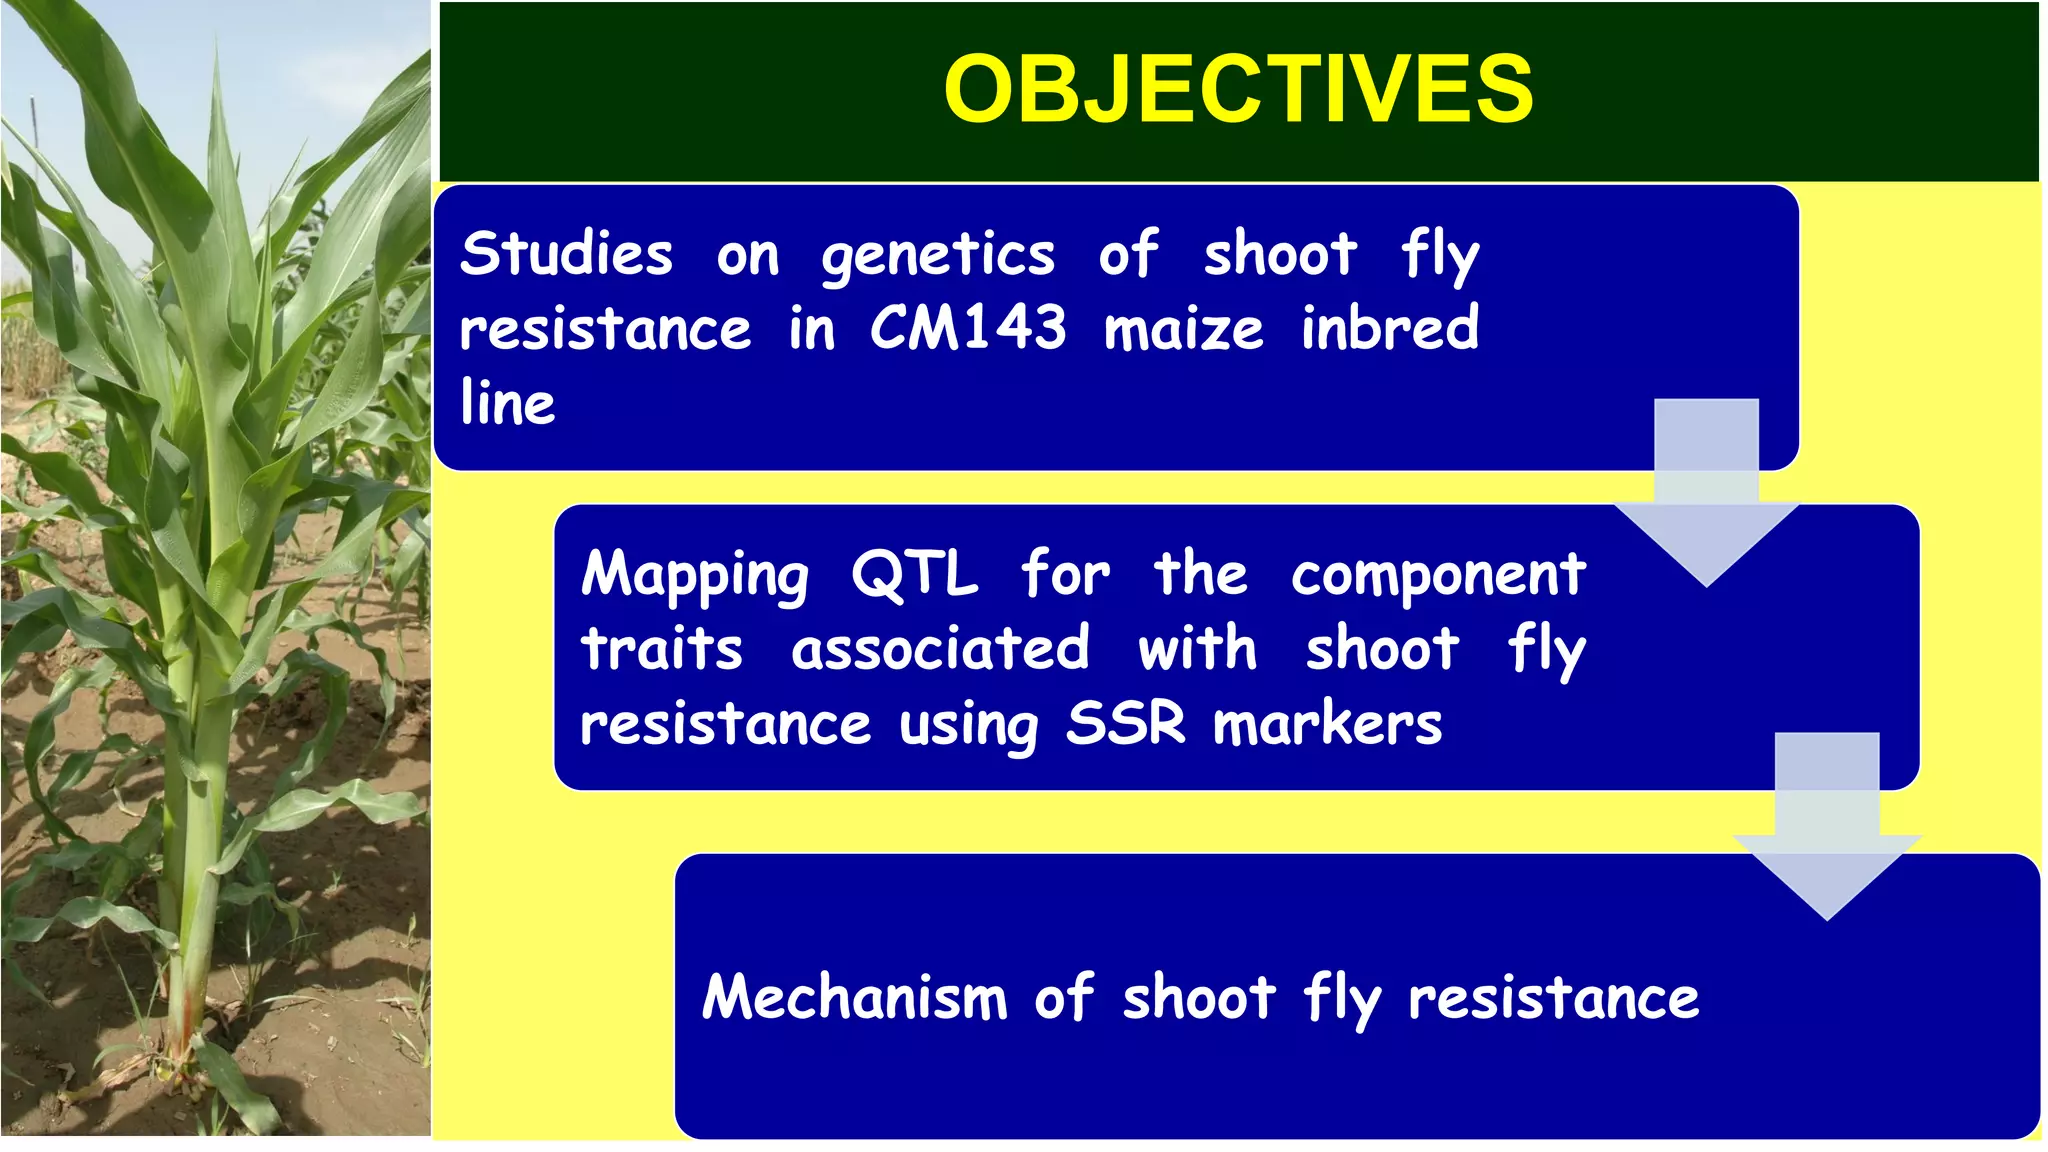
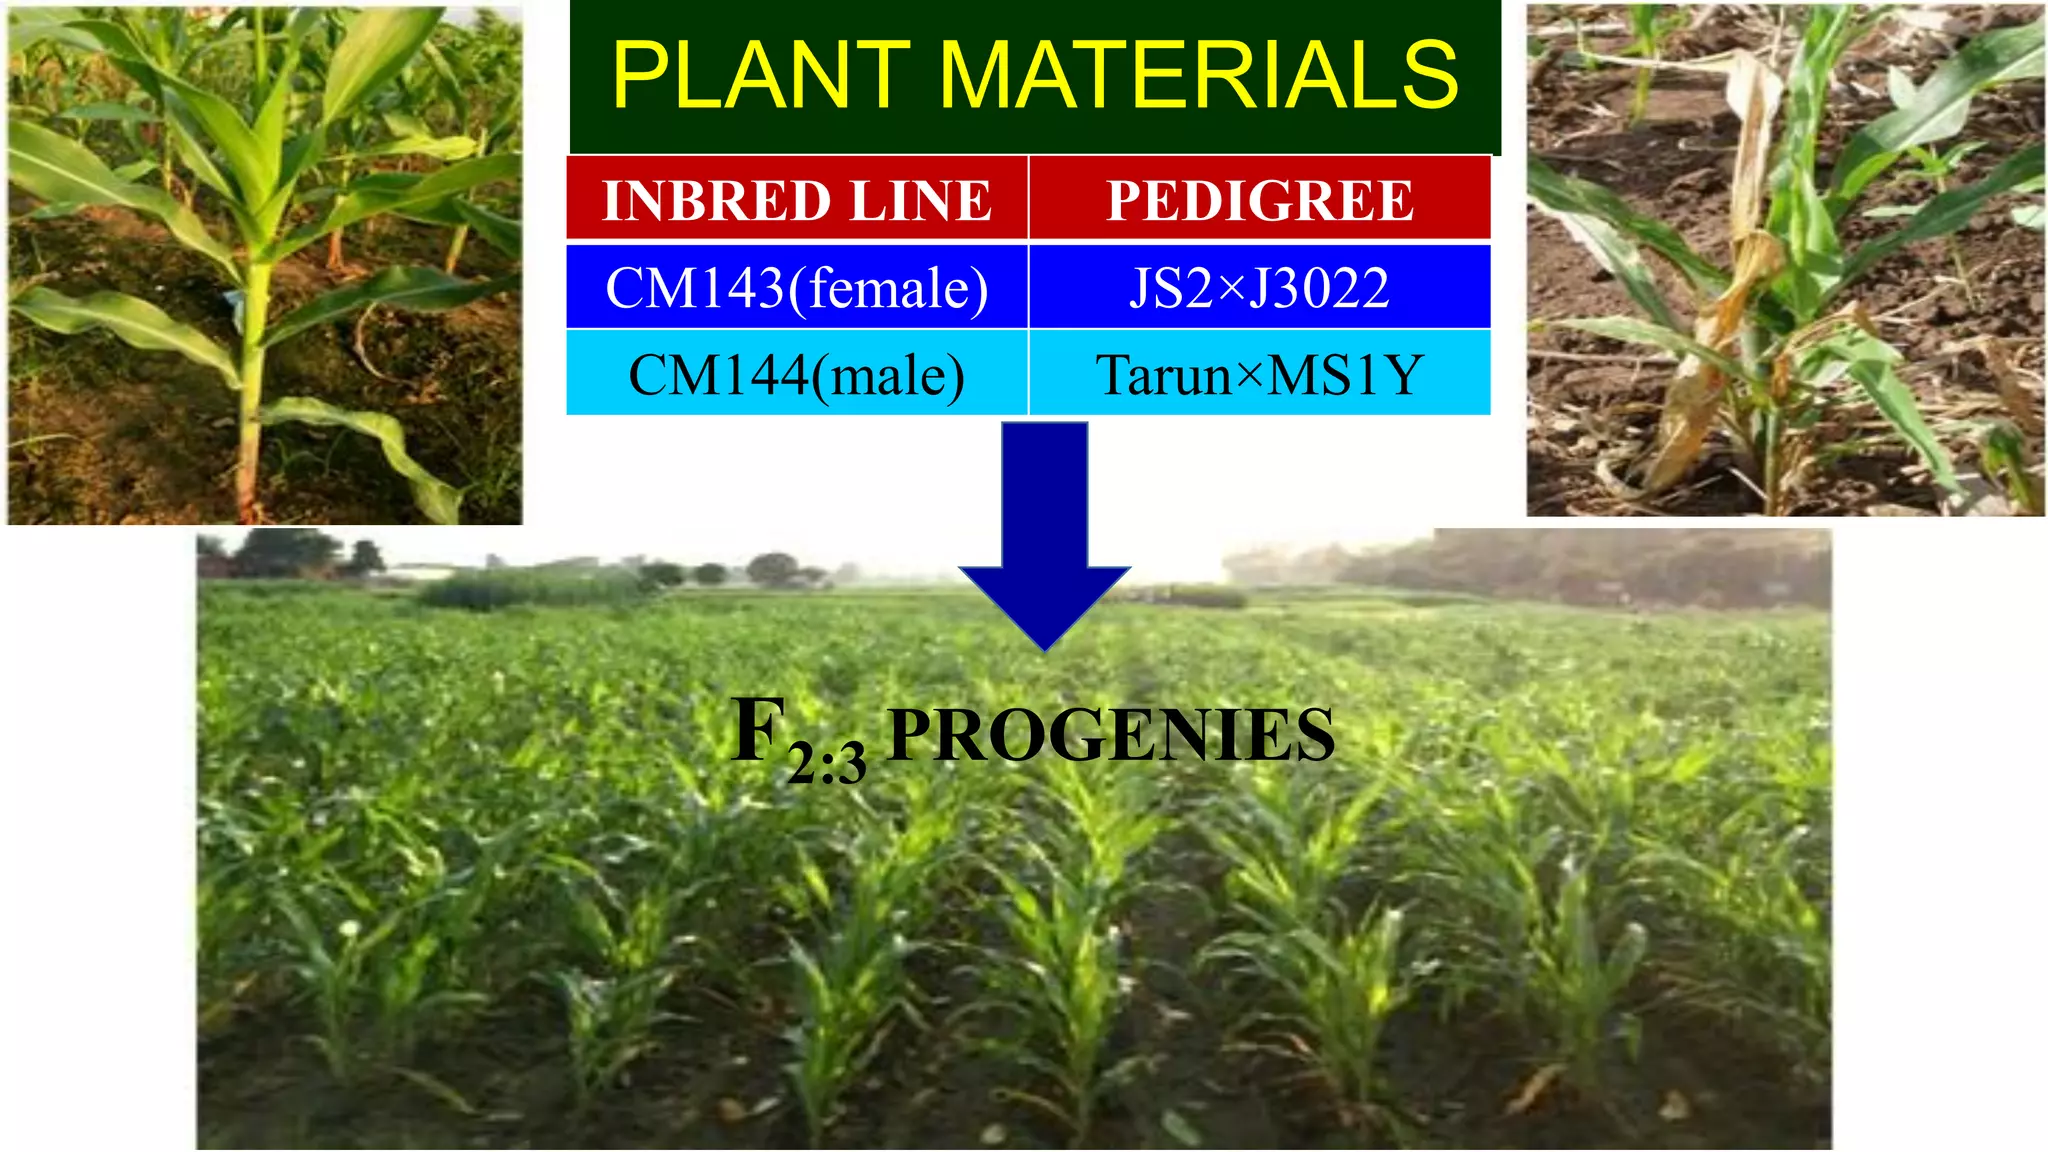
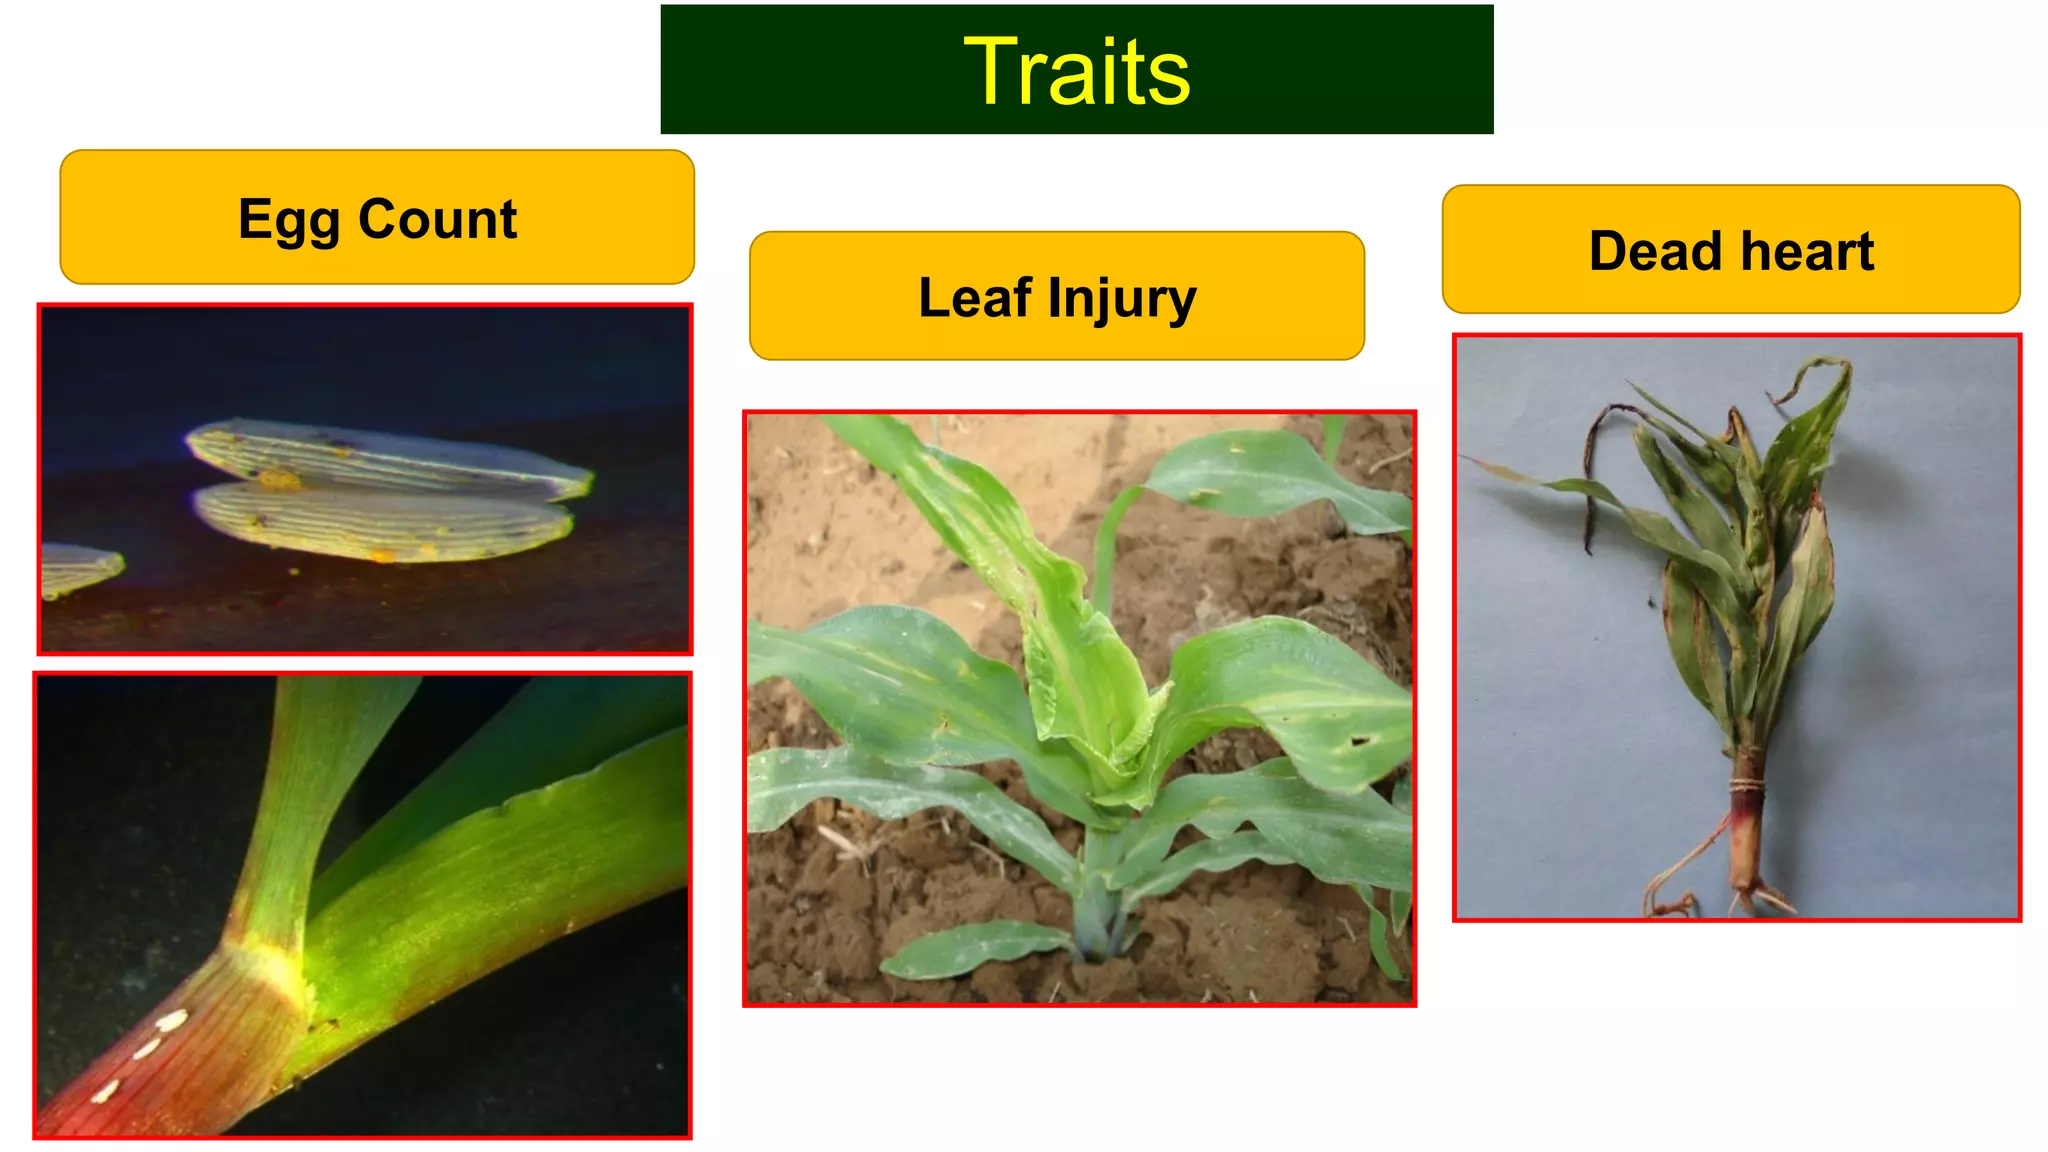
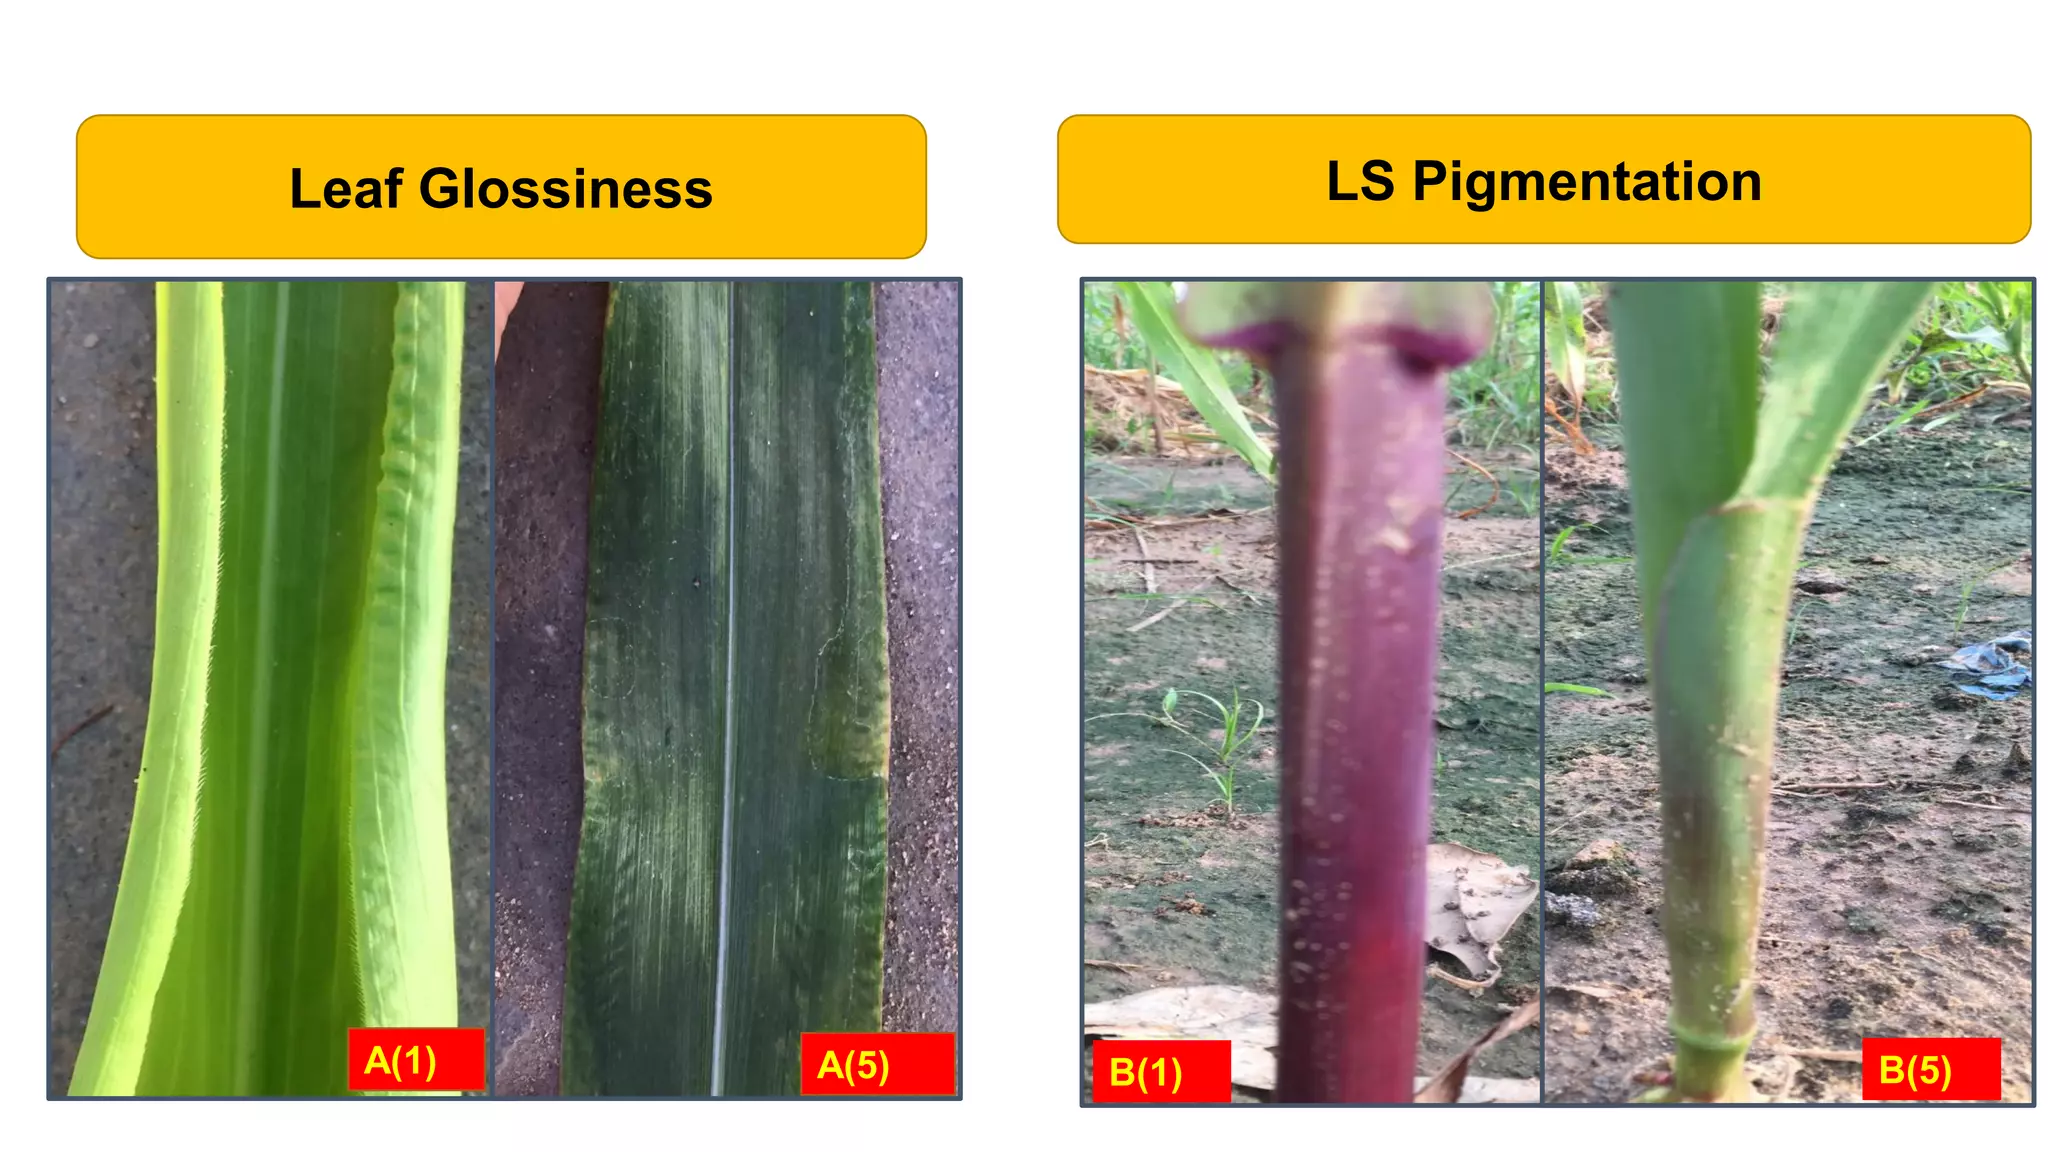
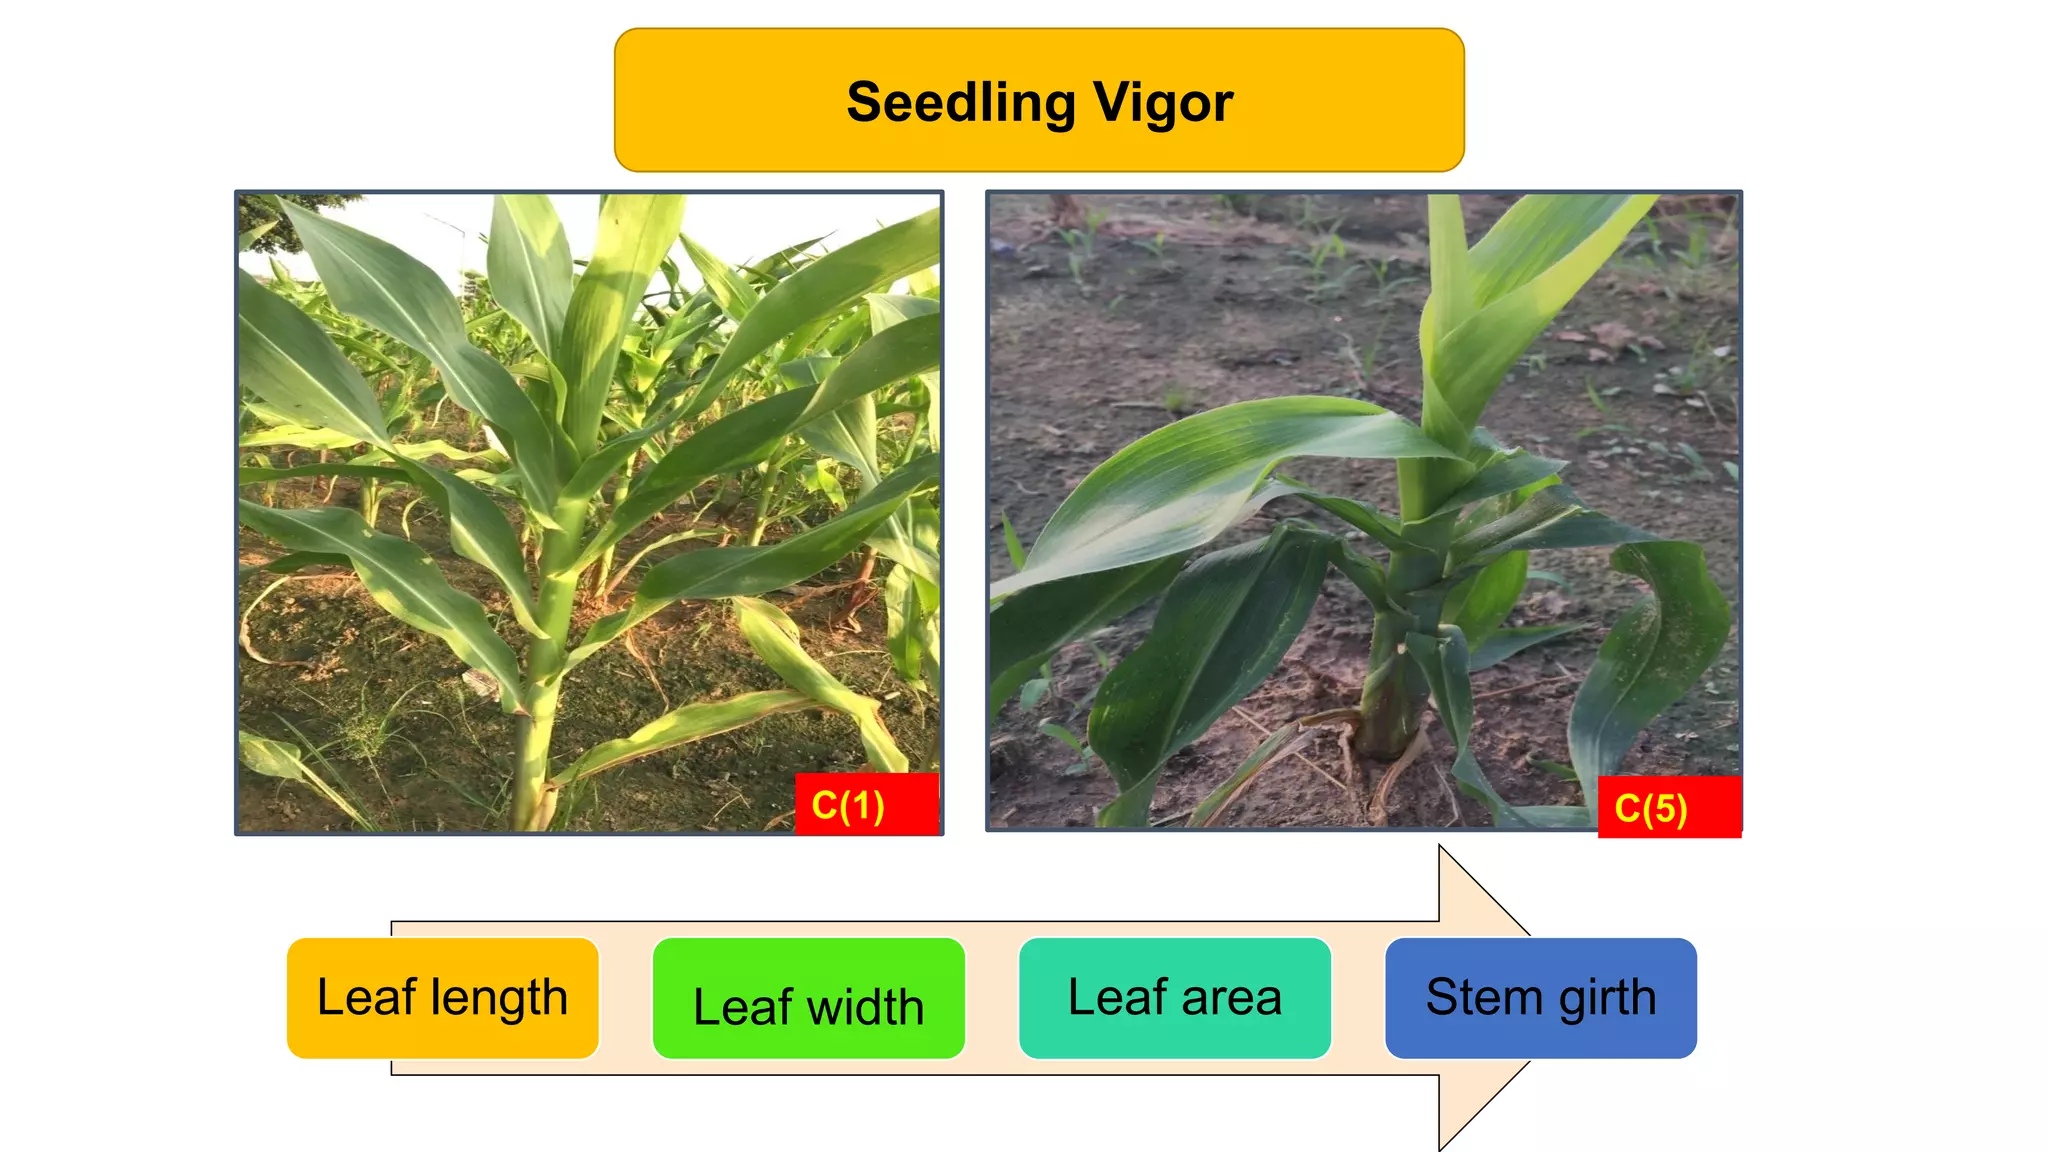
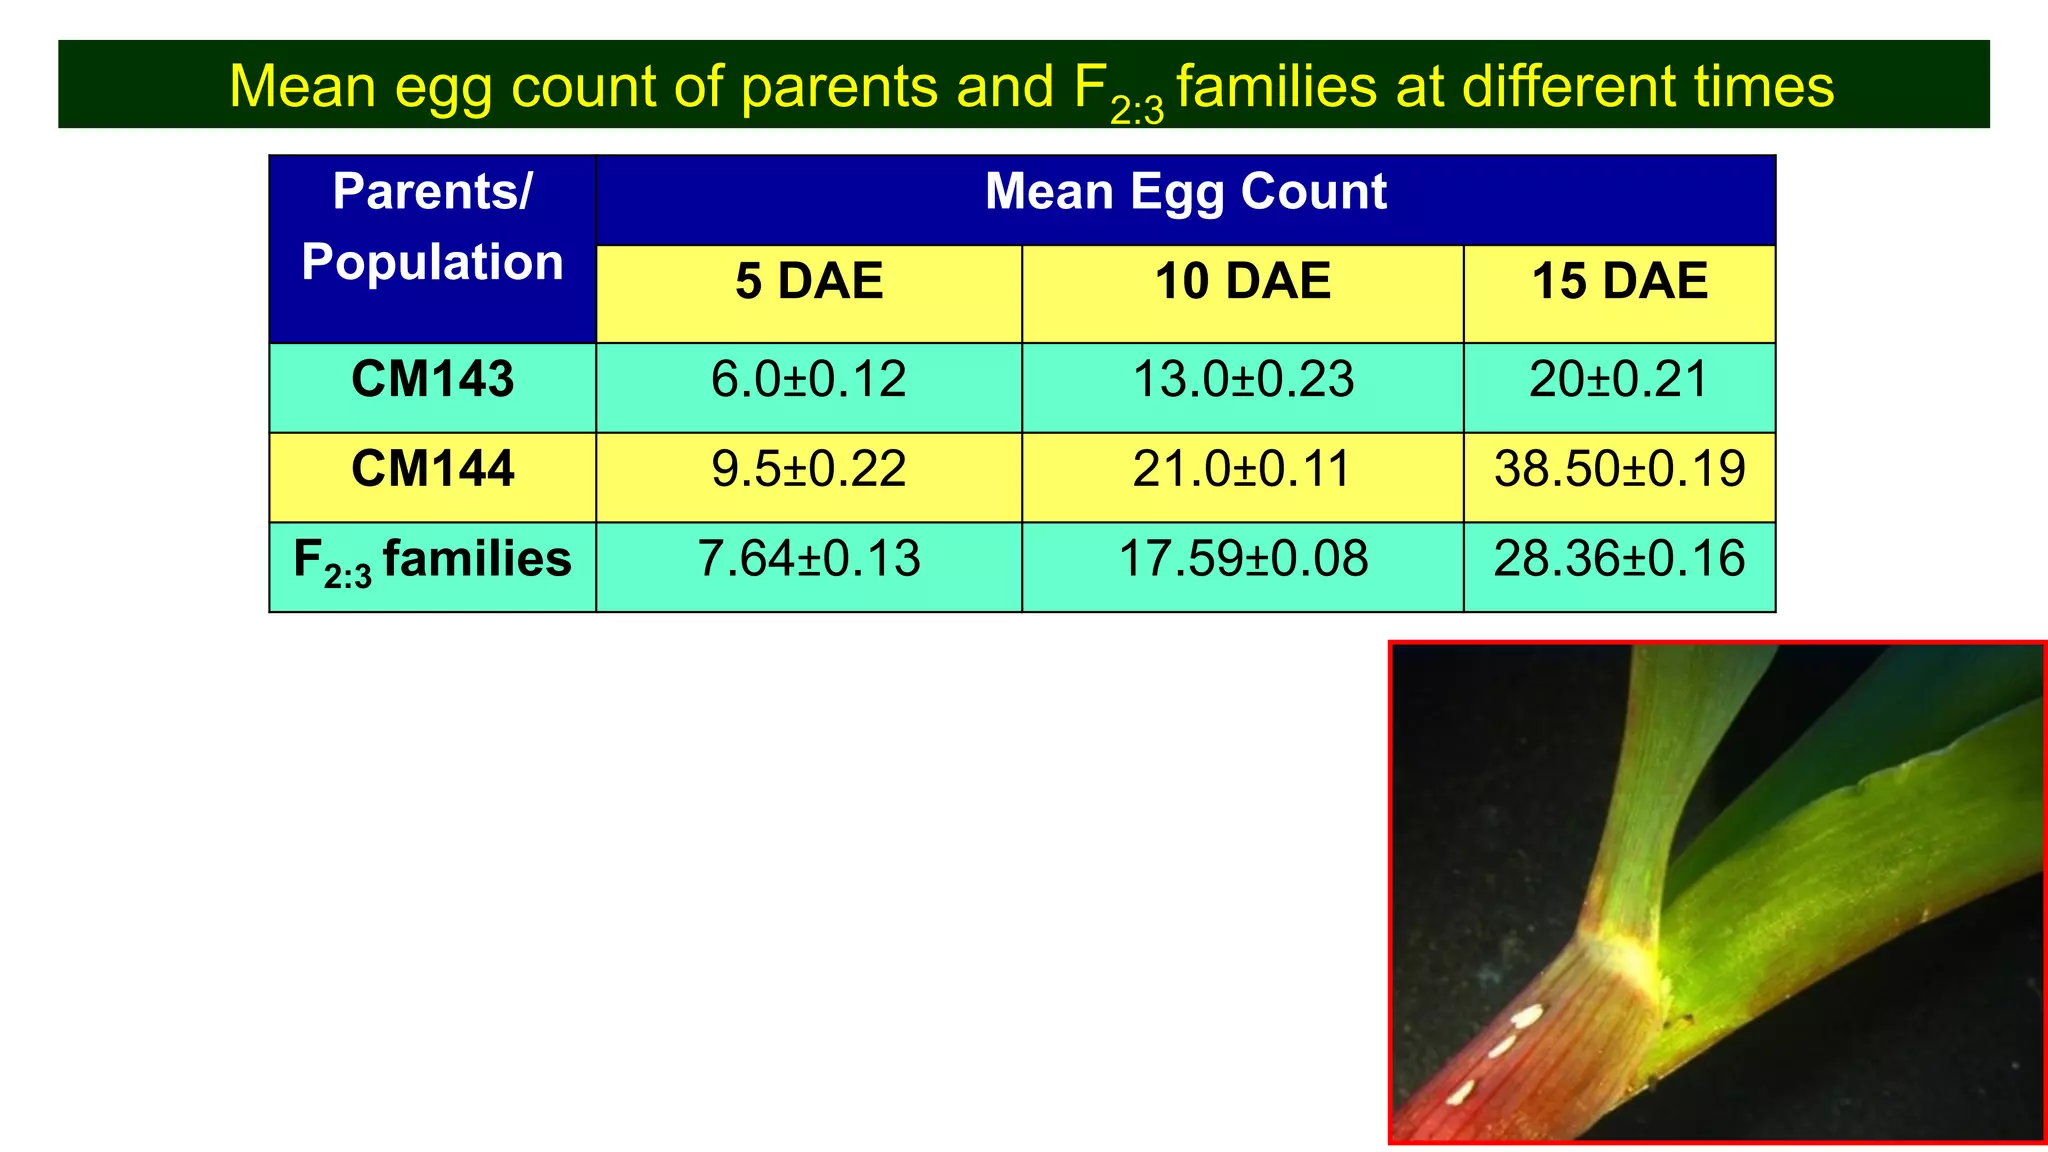
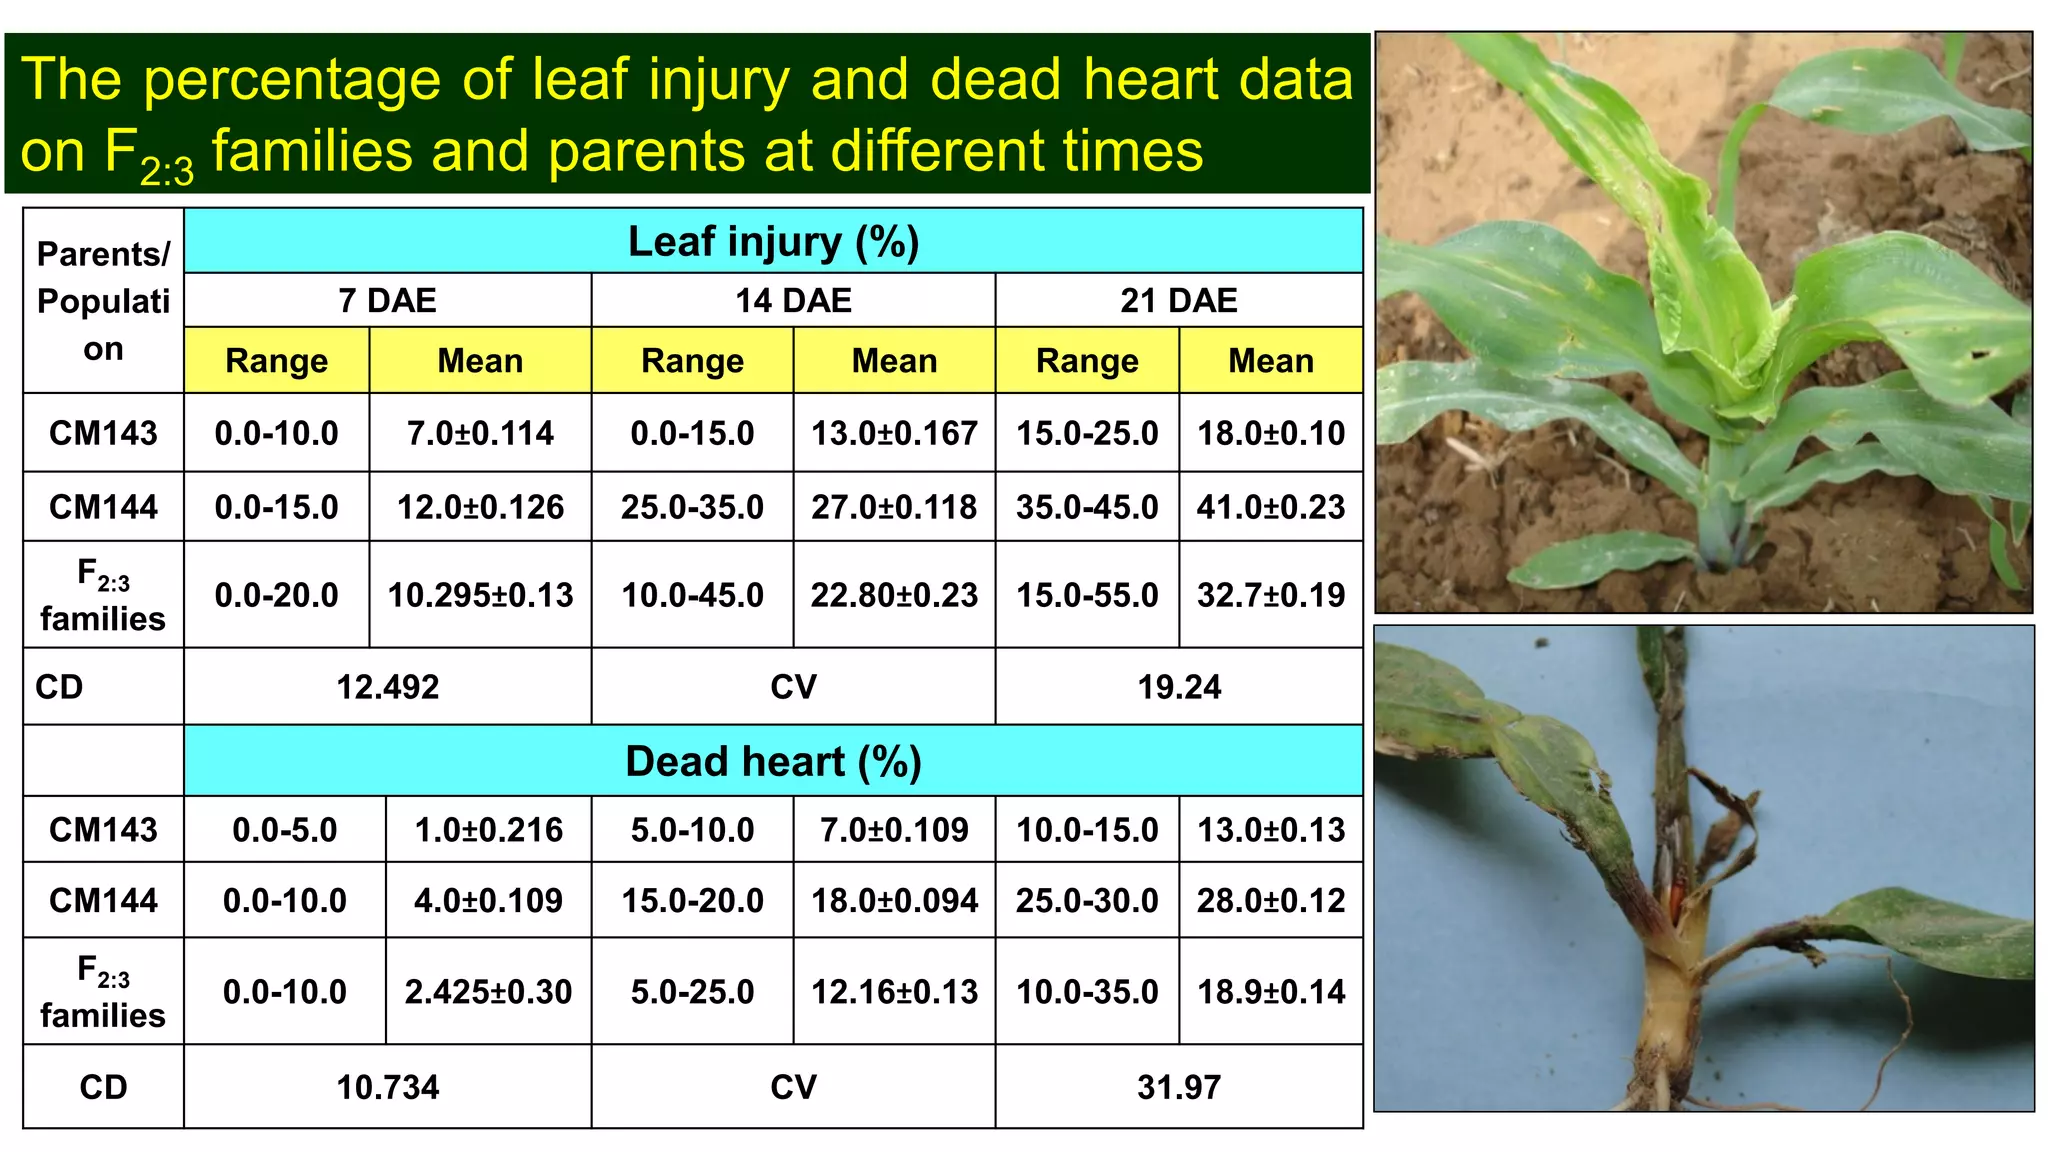
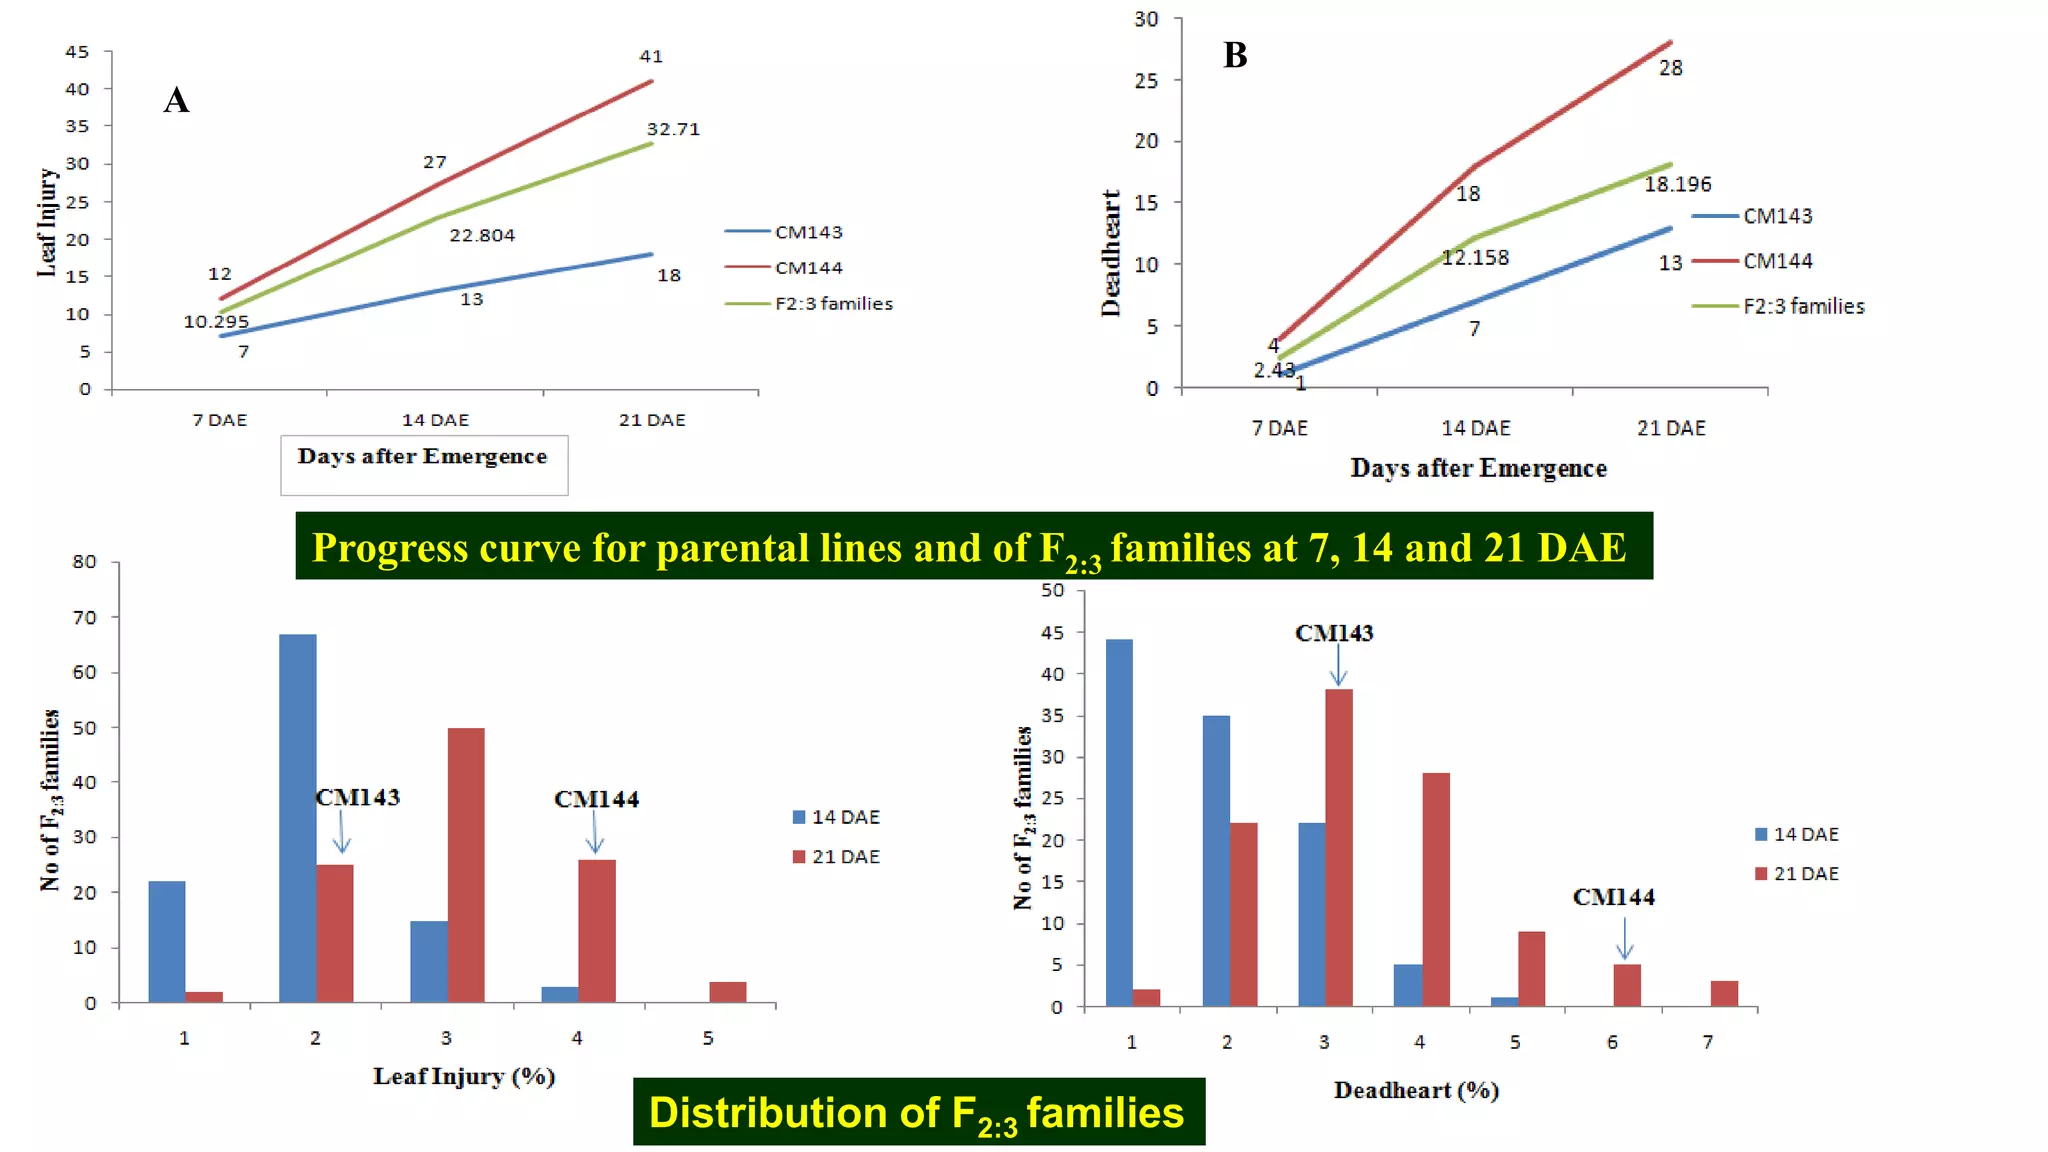
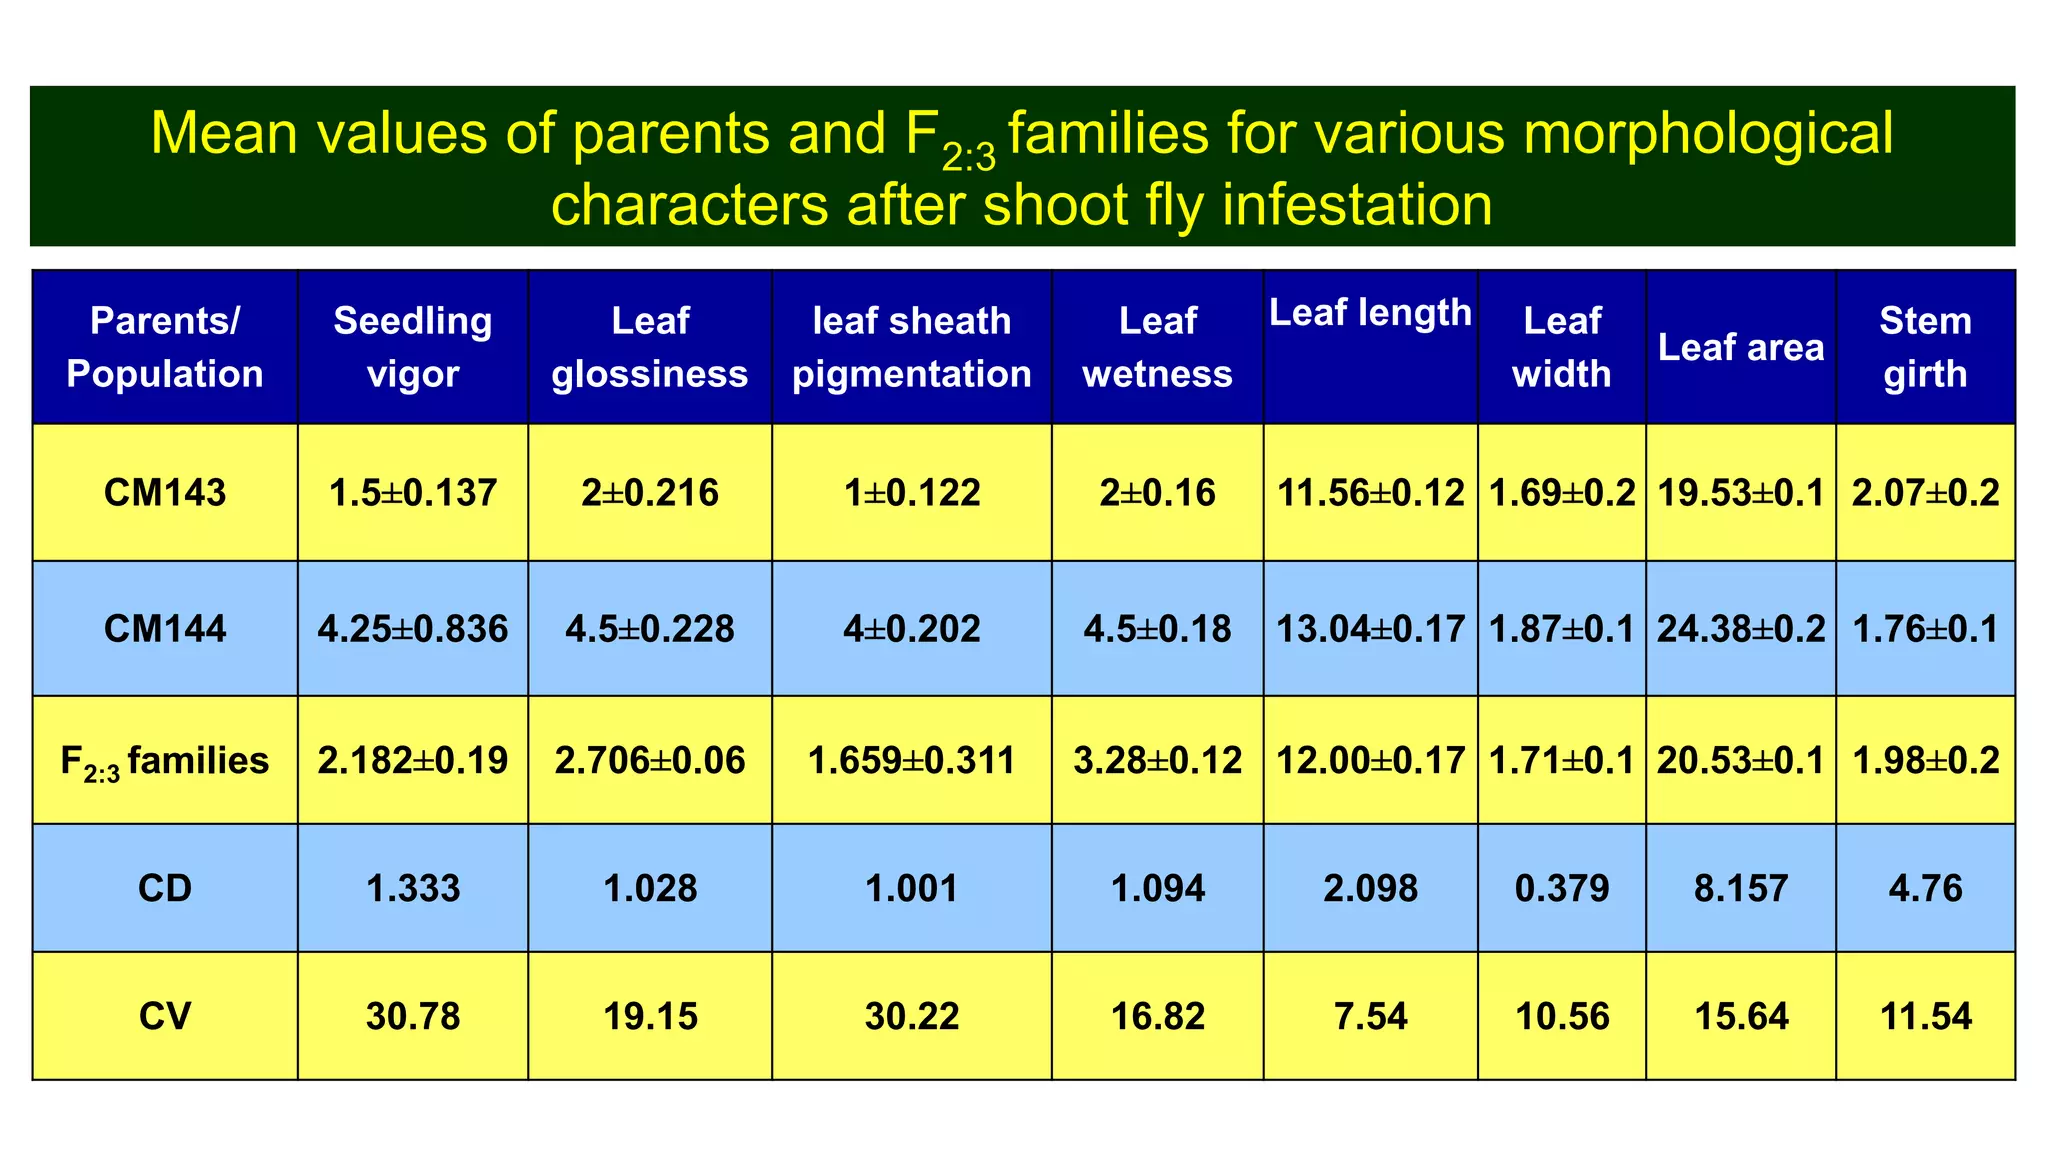
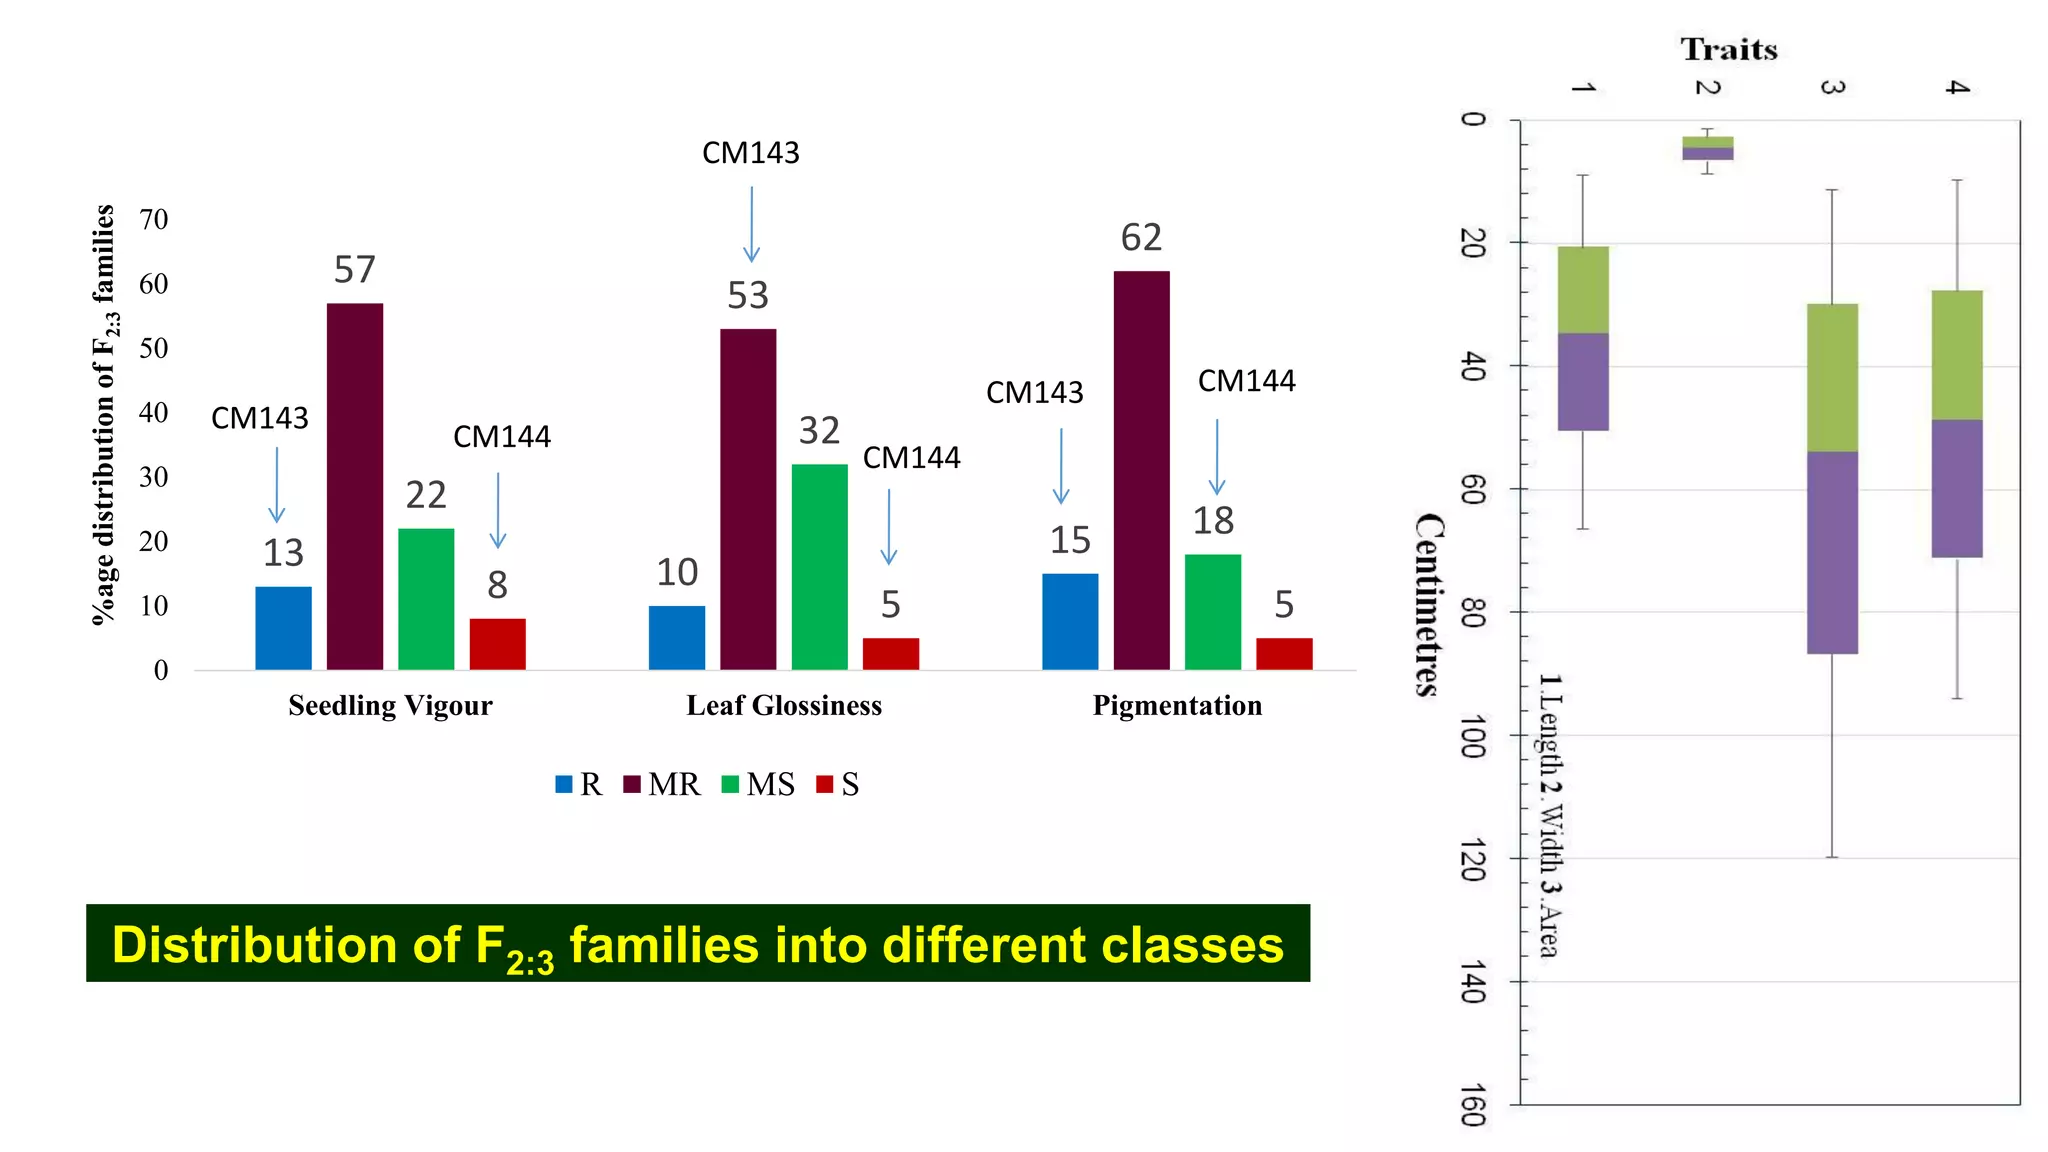
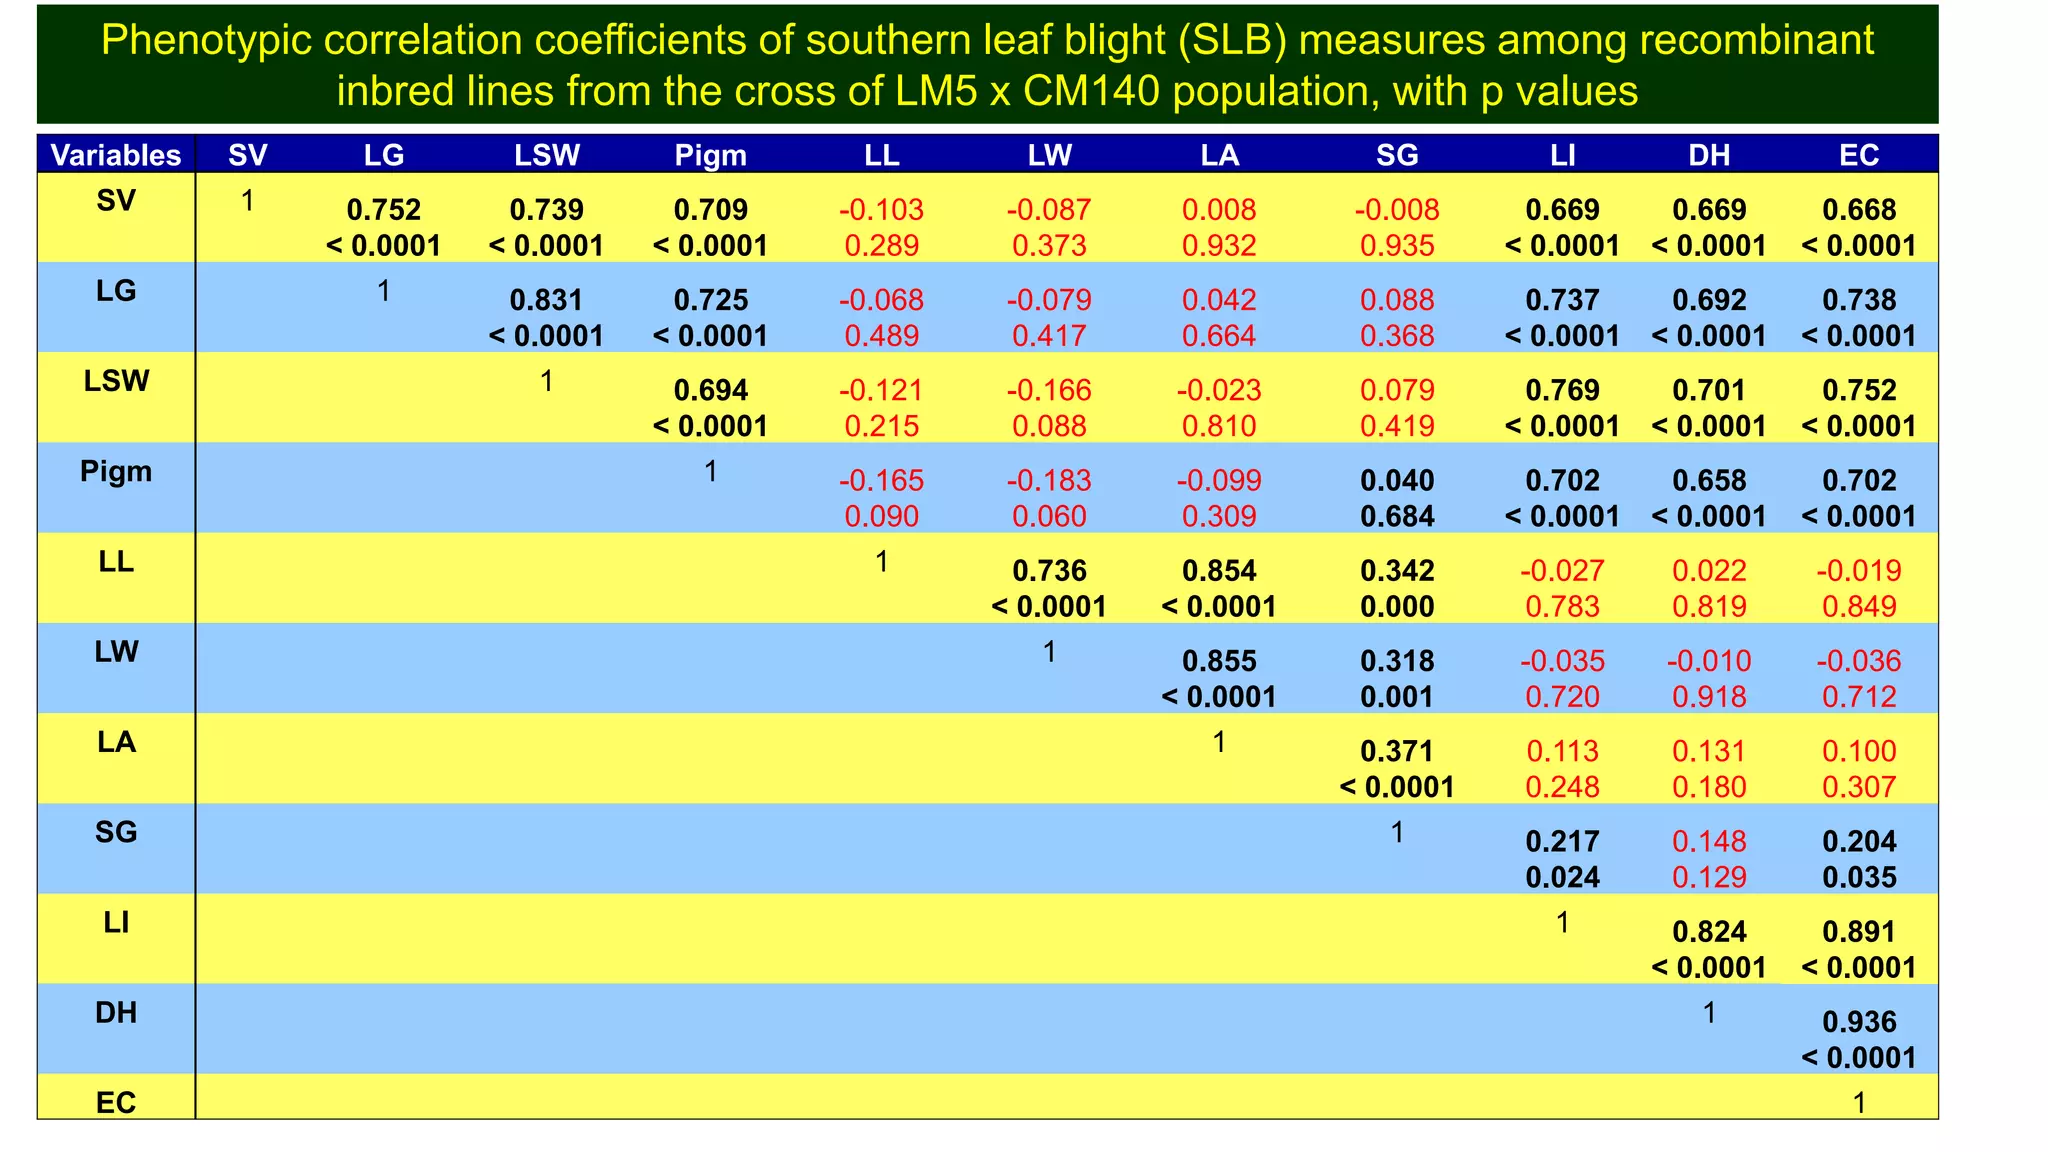
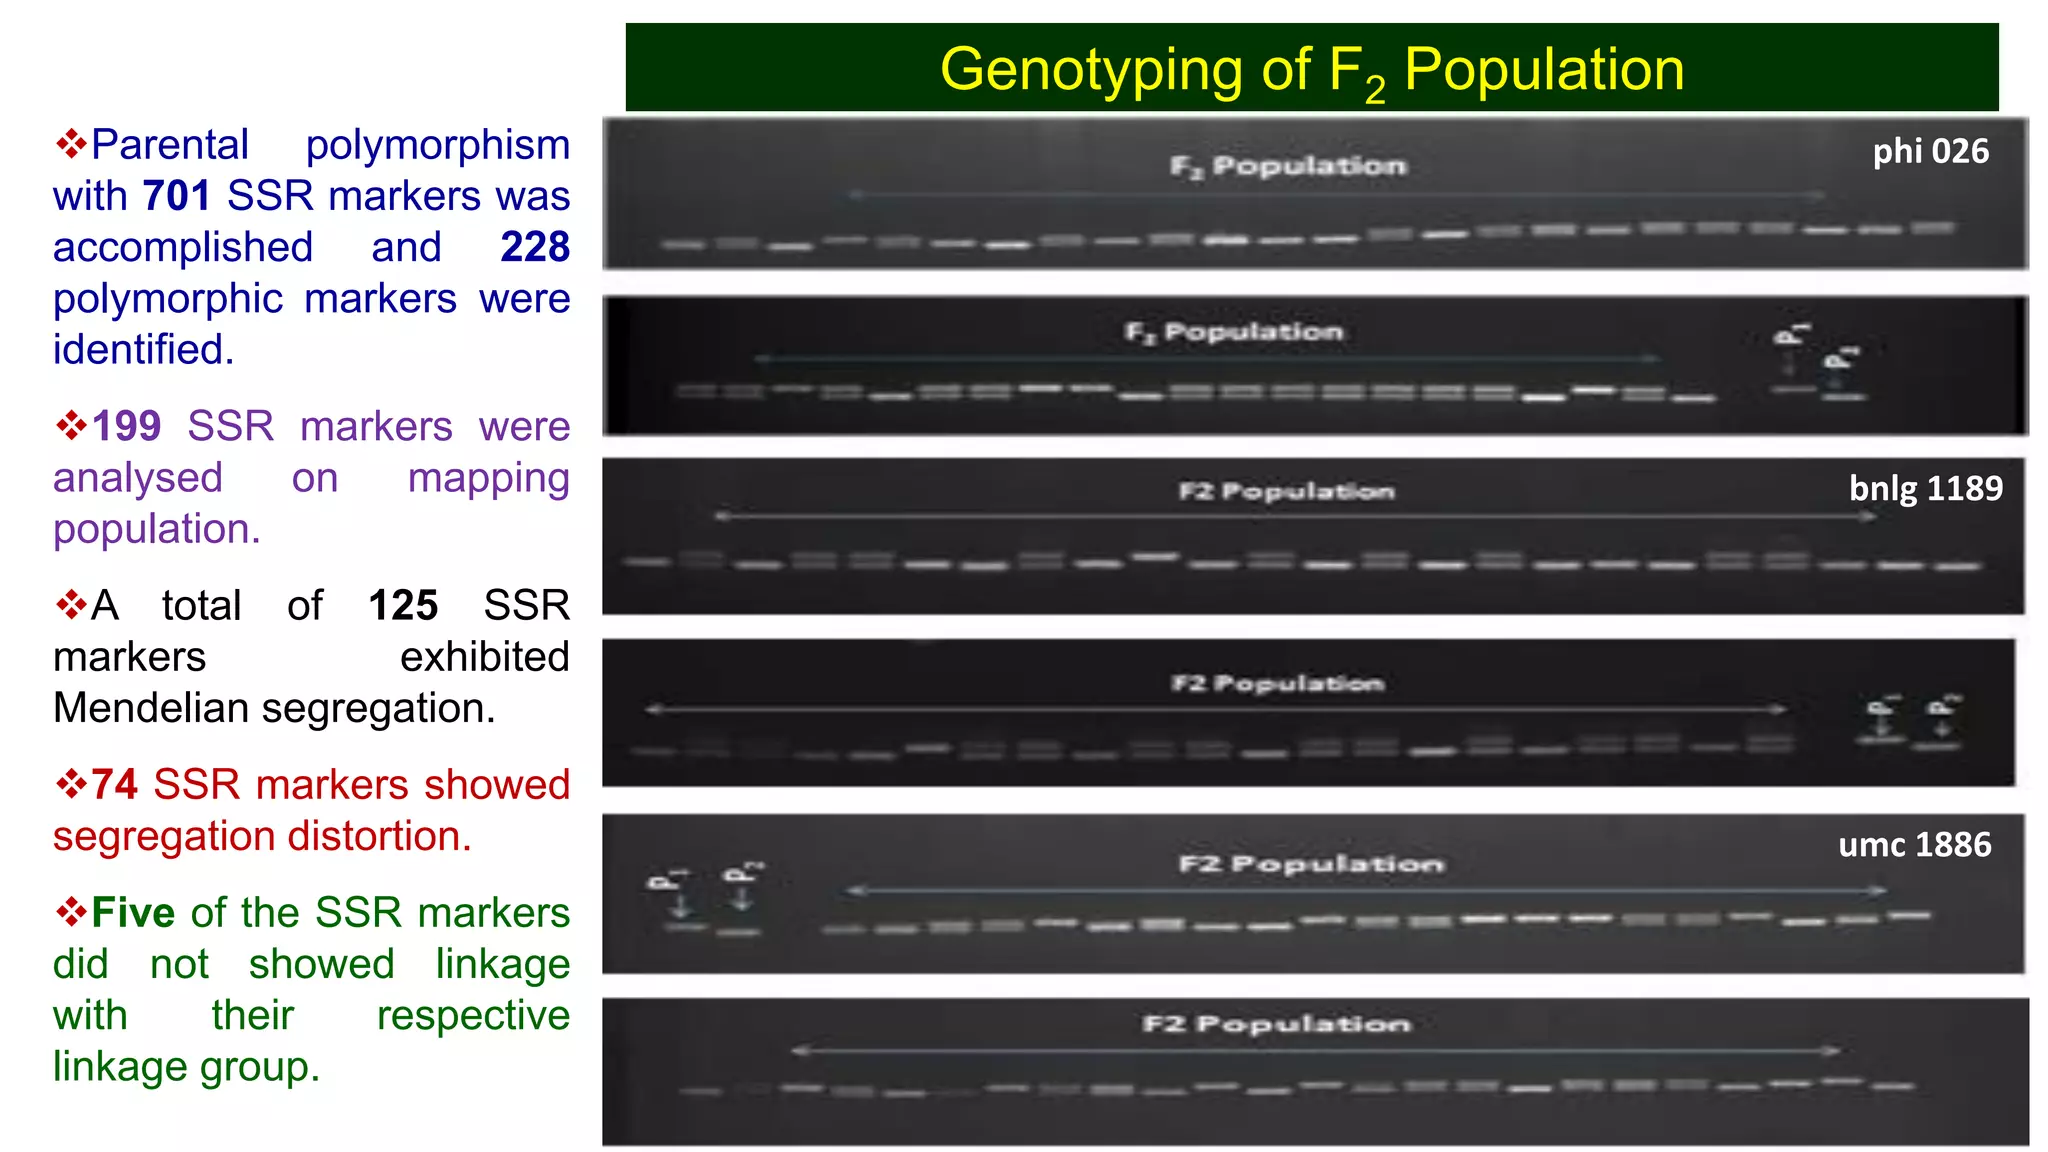
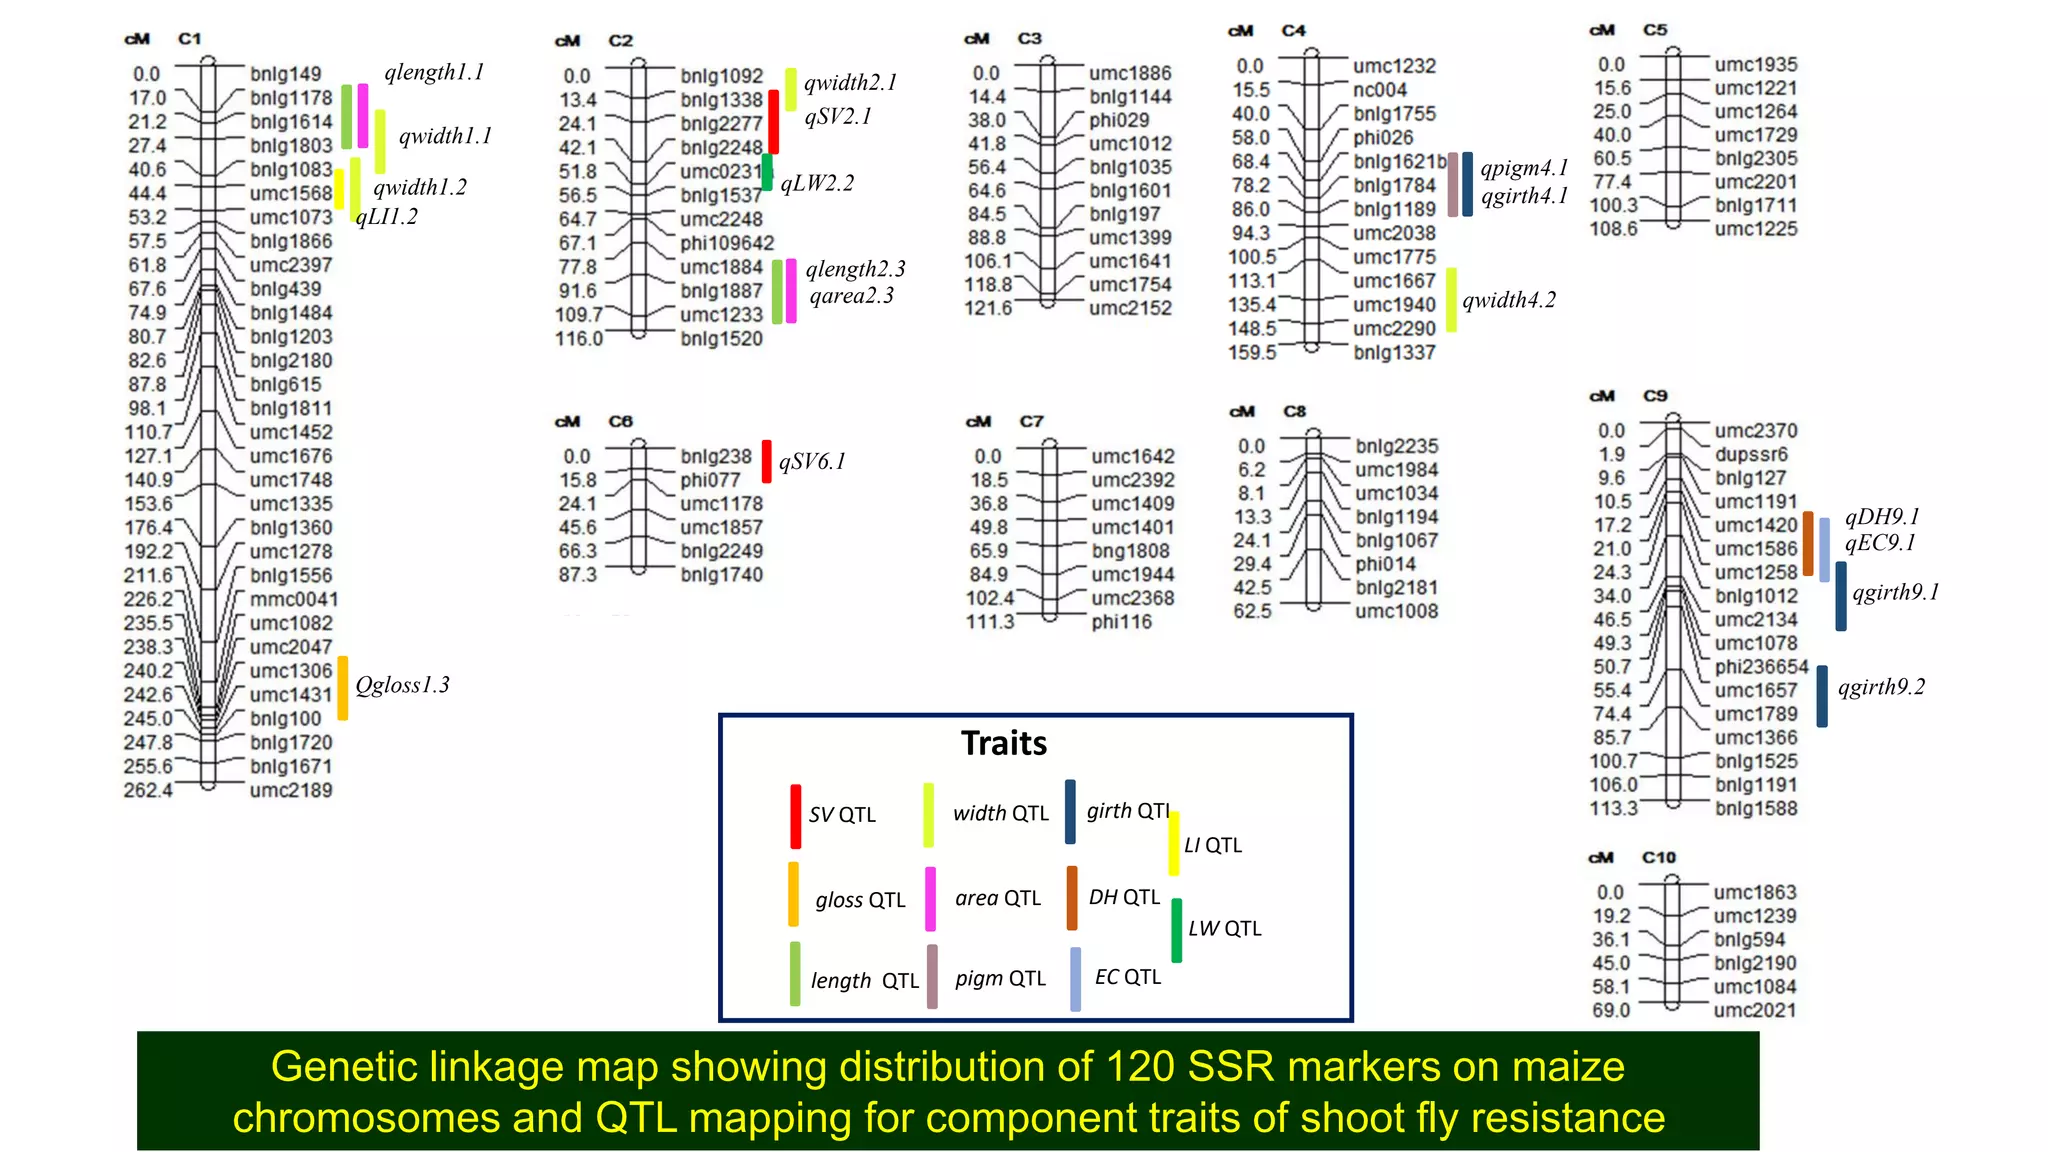
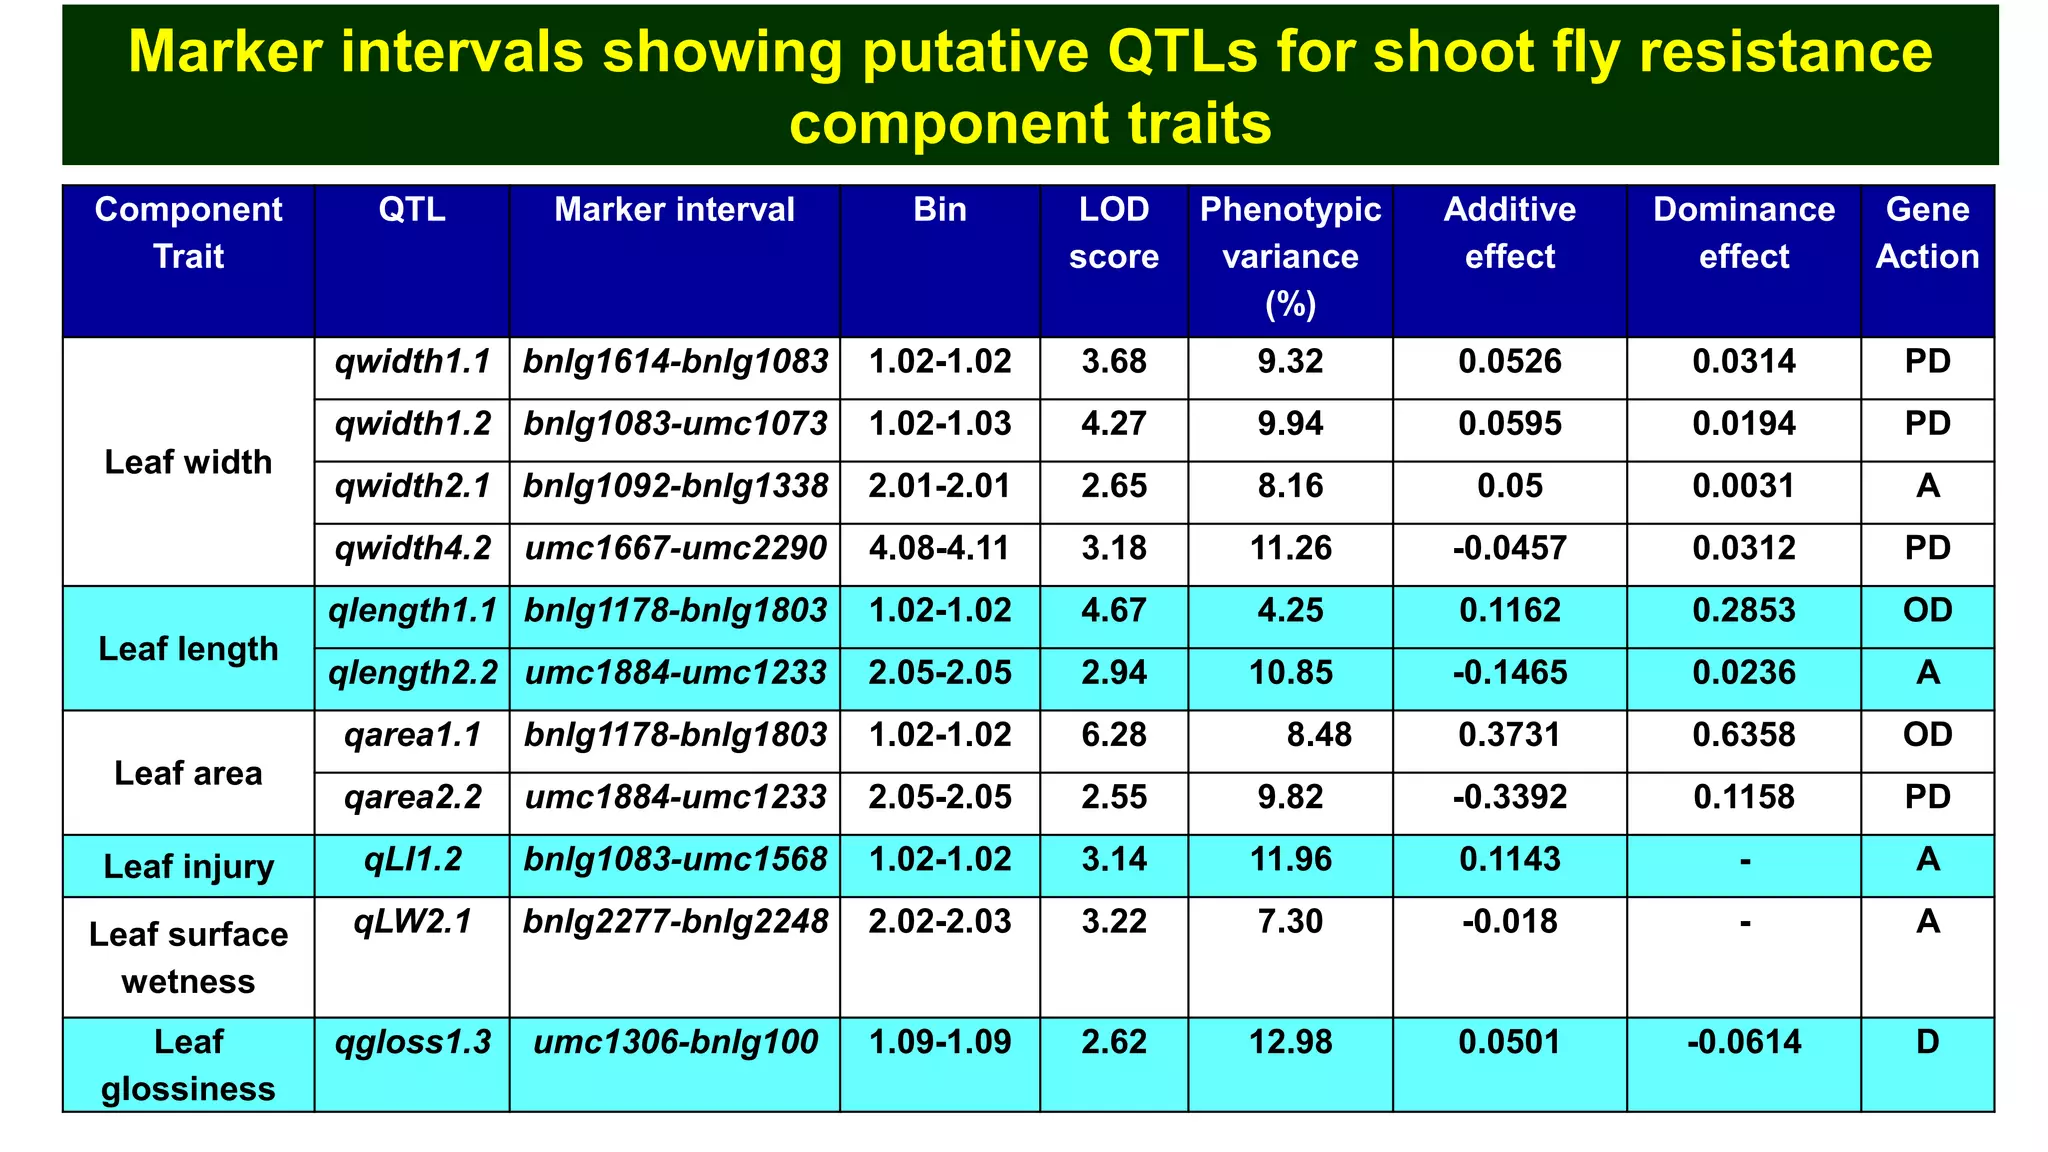
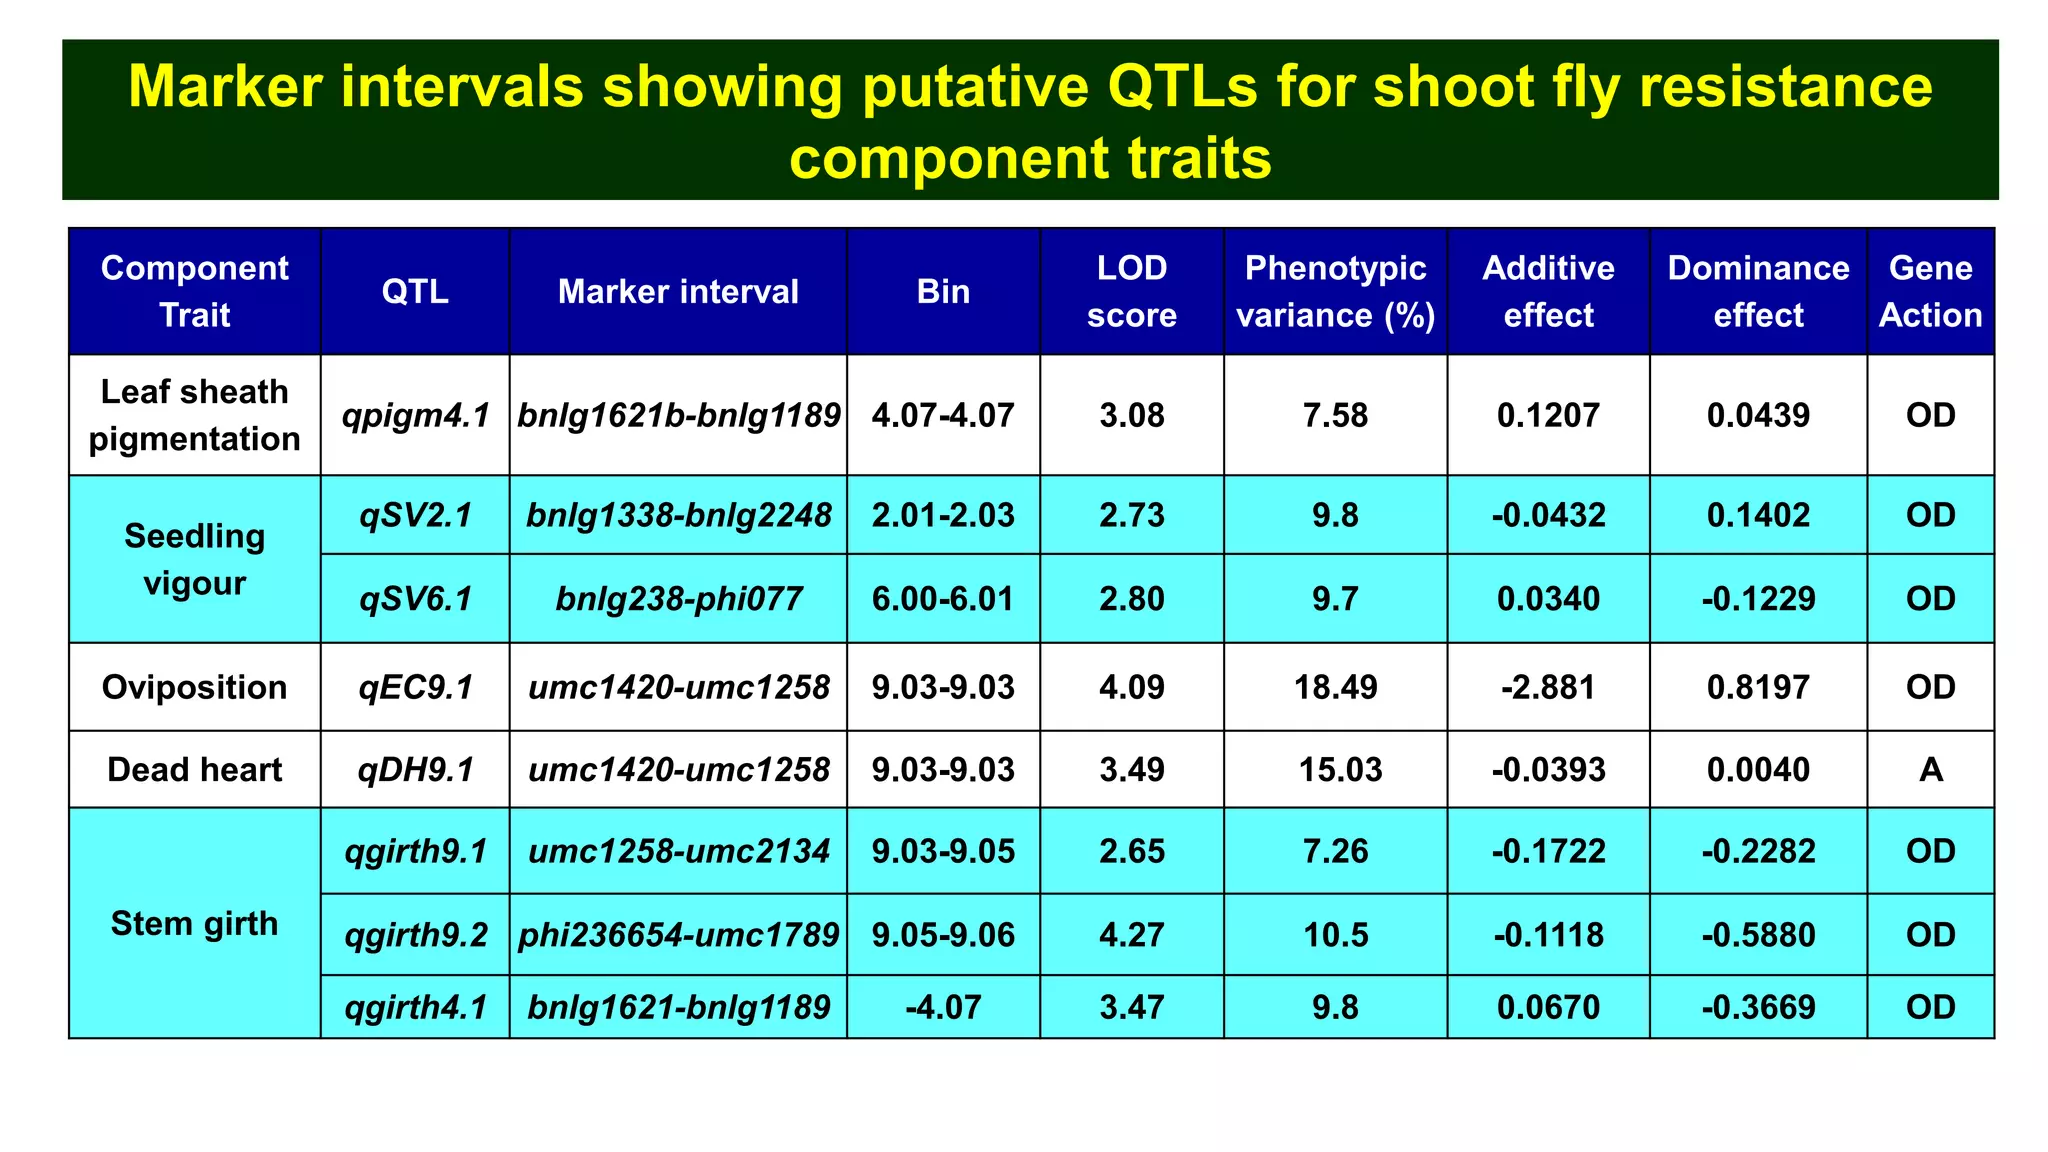
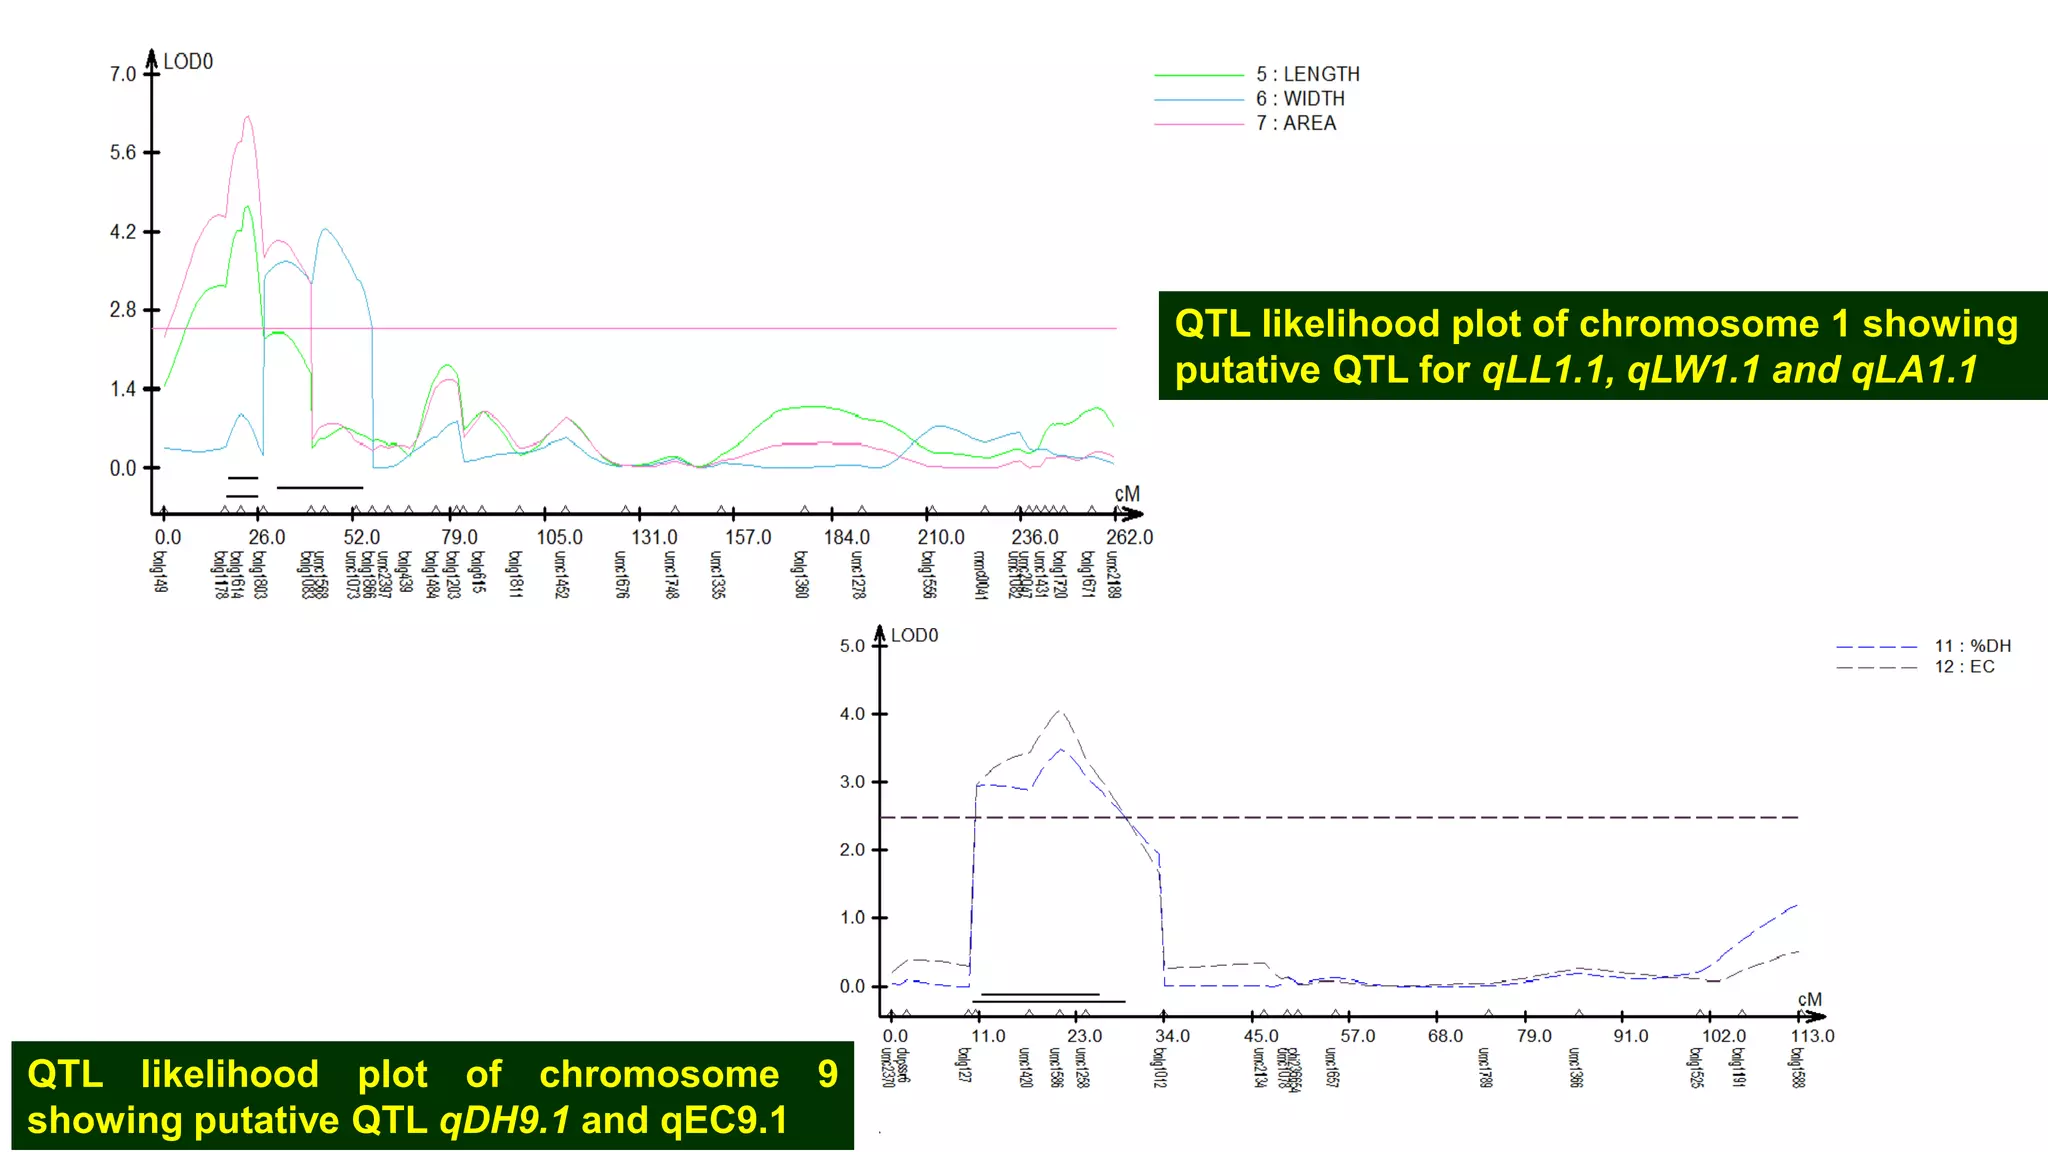
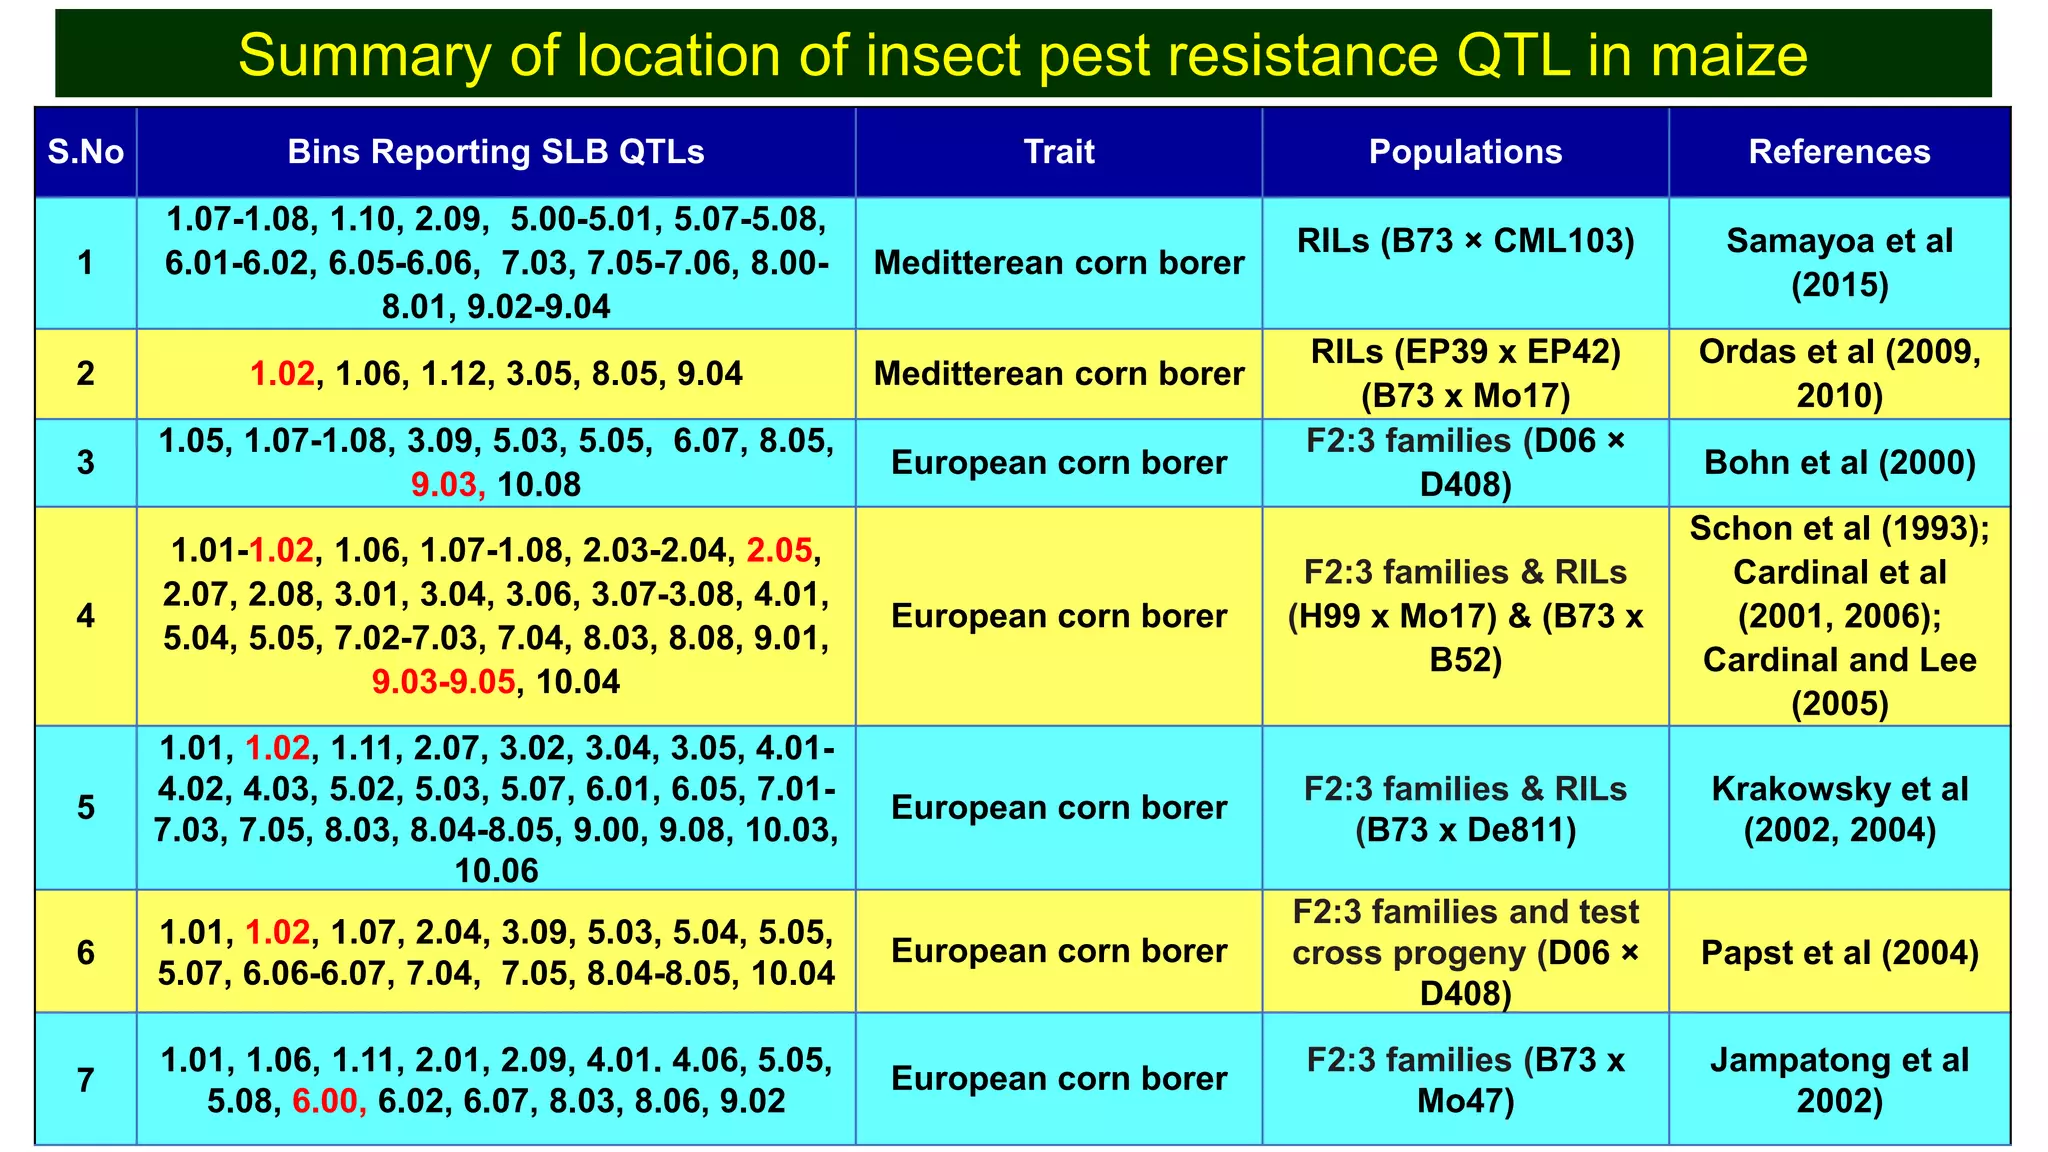
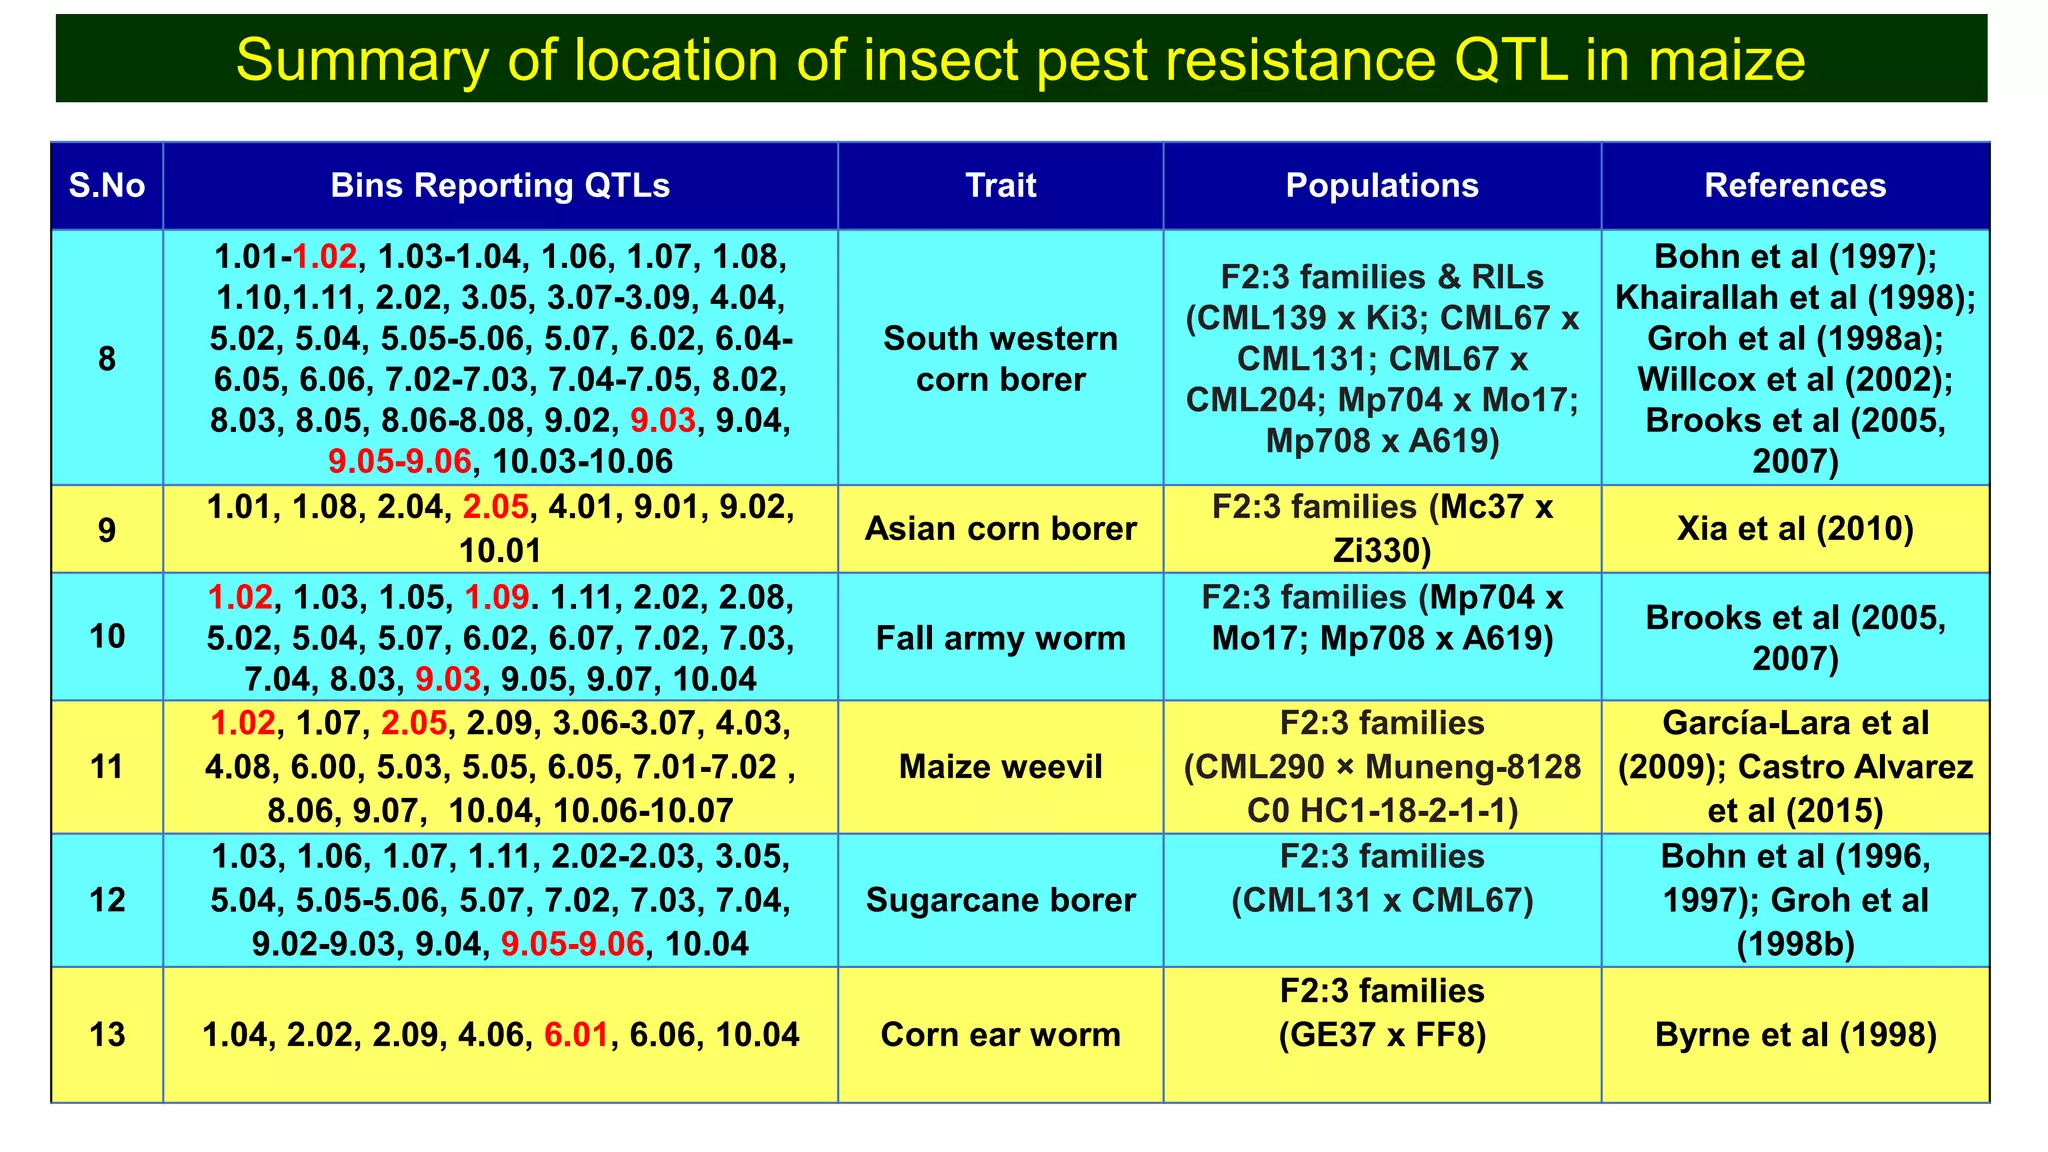
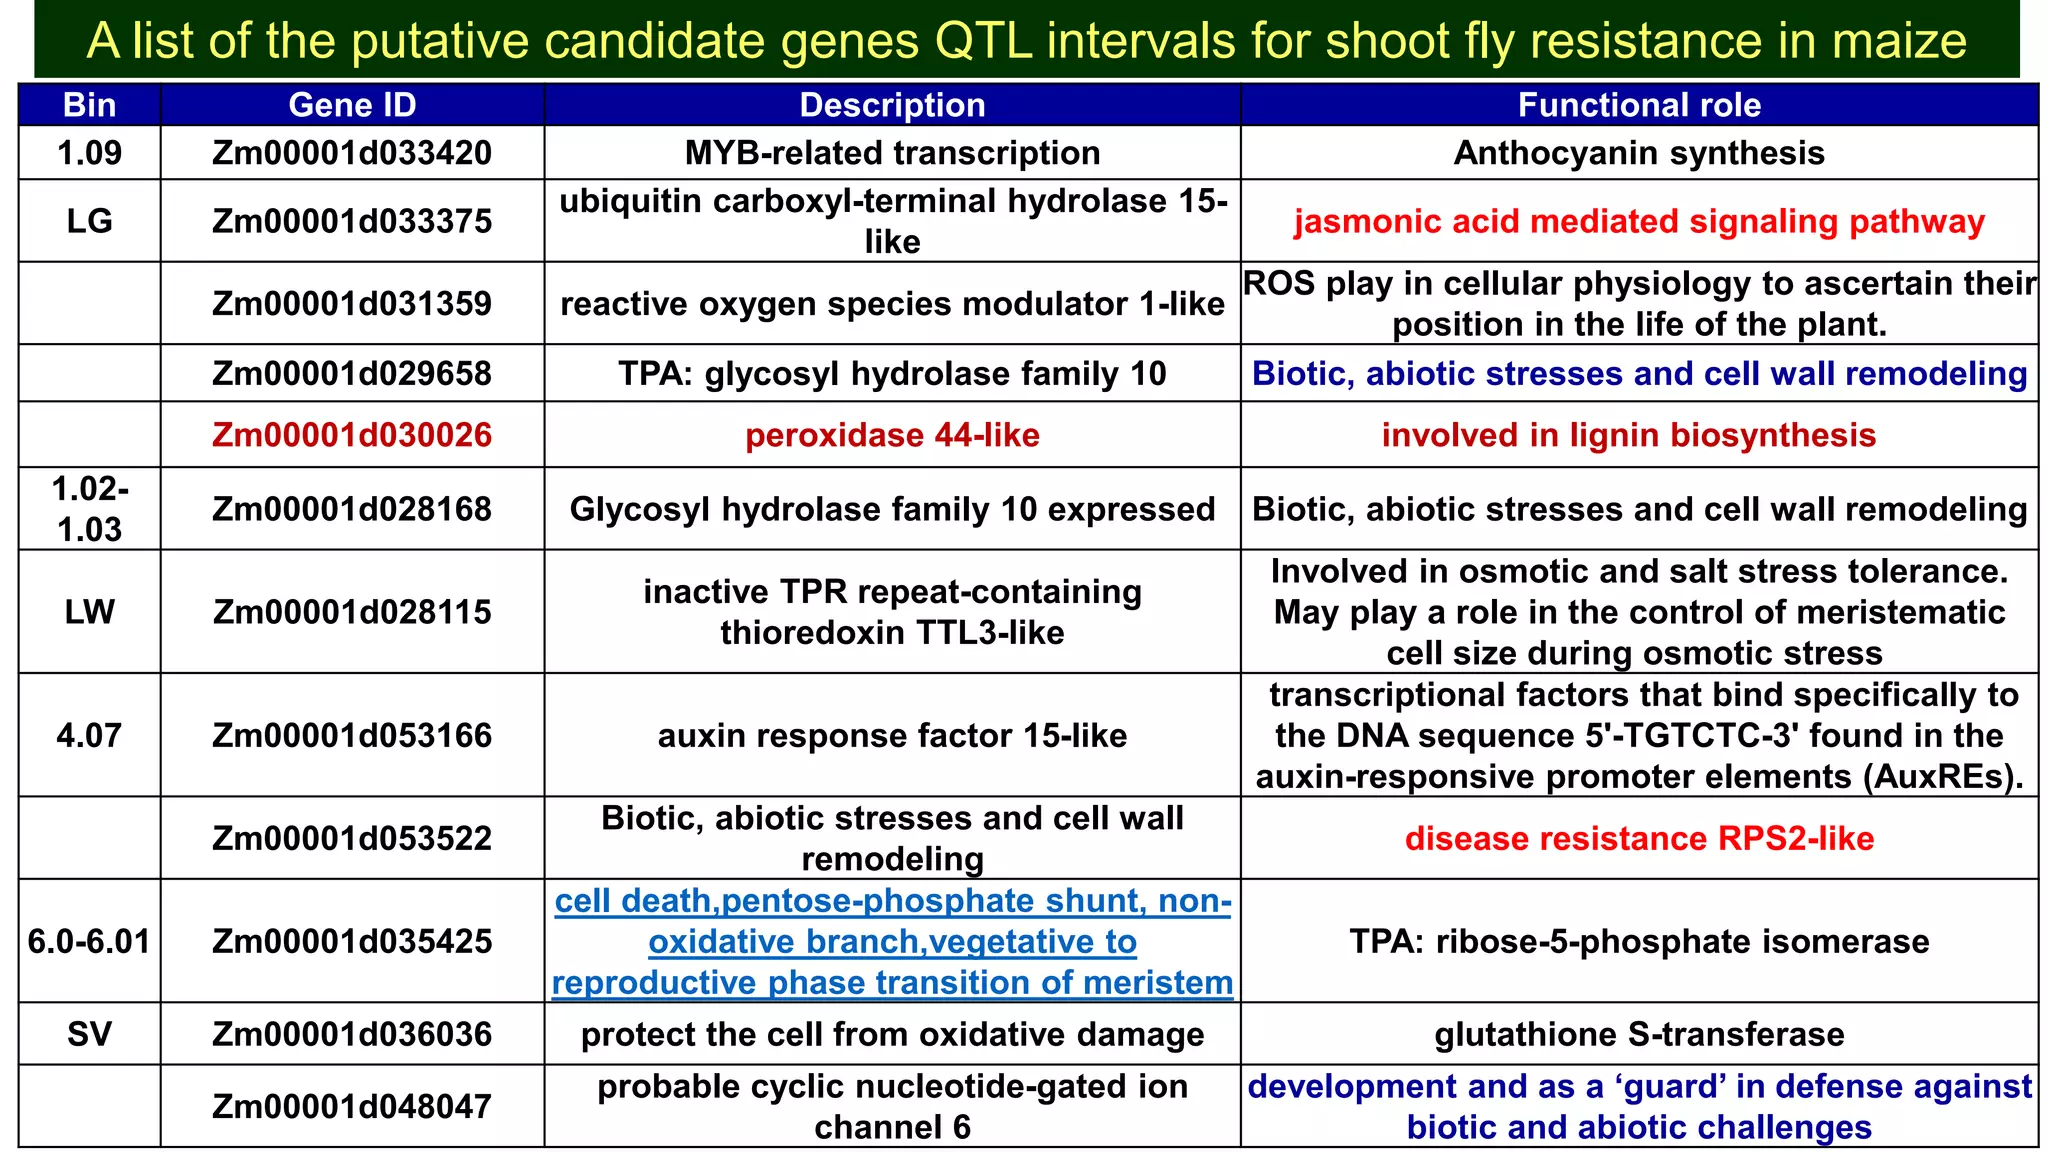
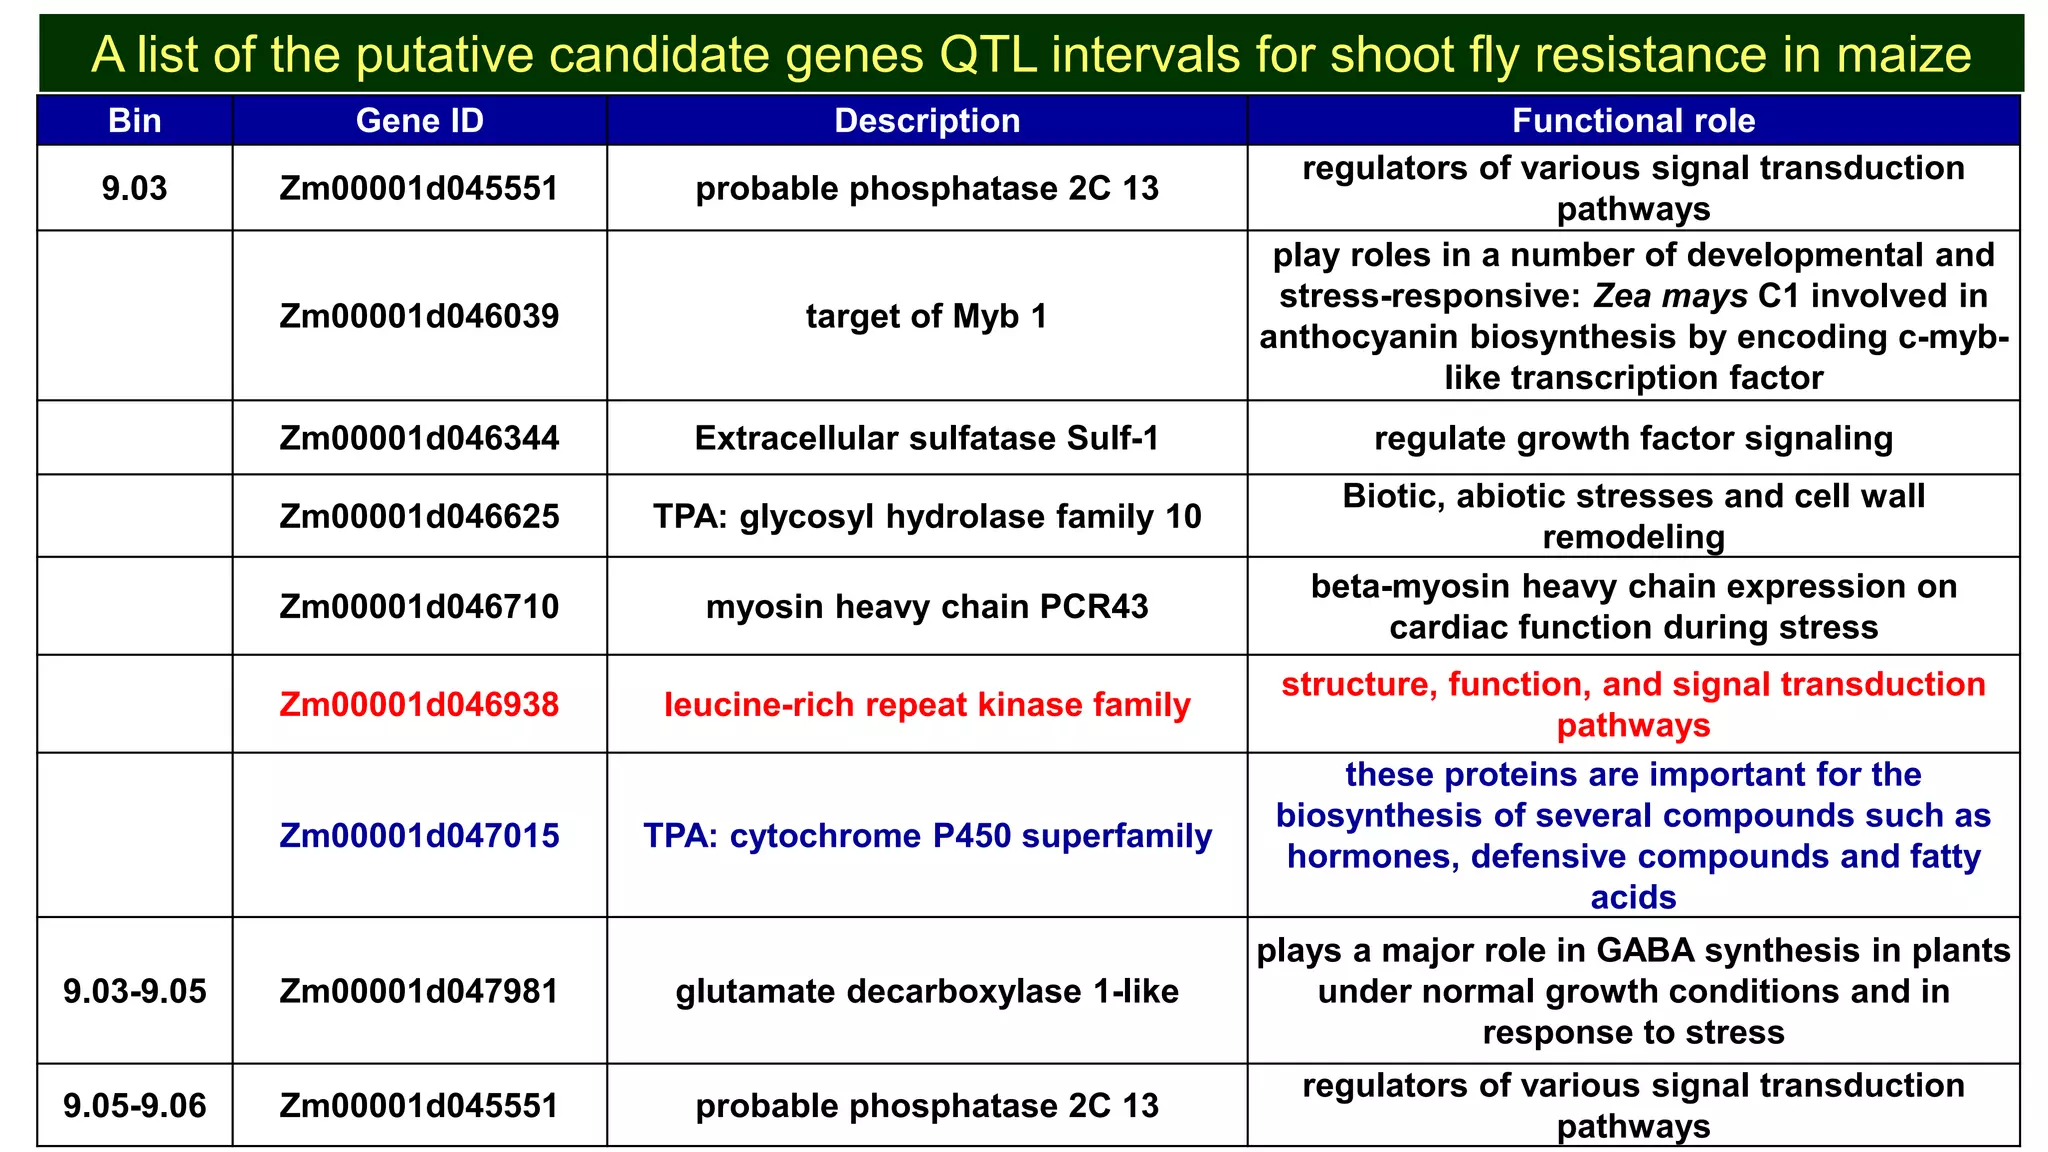
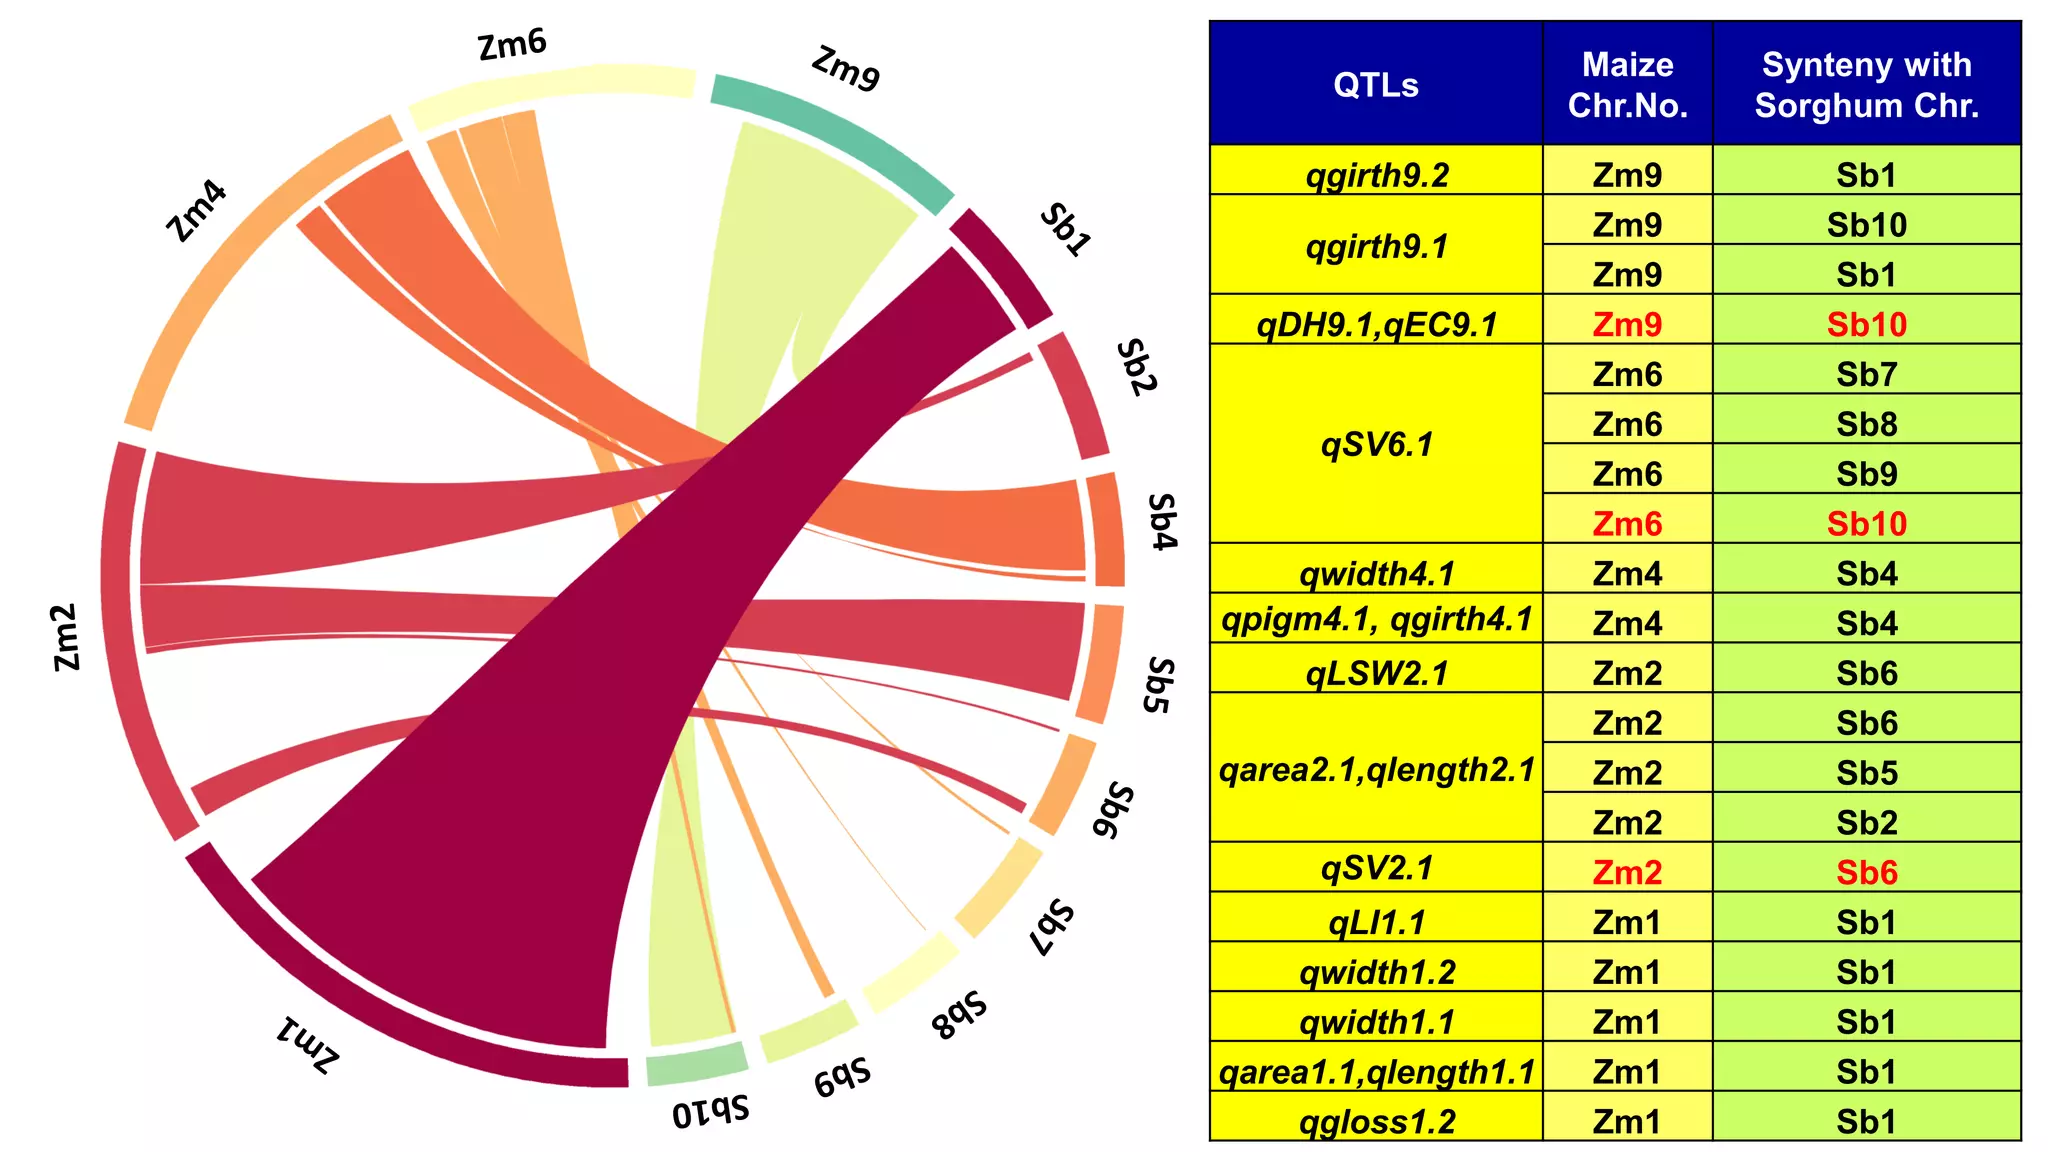

This document discusses a study that identified quantitative trait loci (QTL) associated with resistance to shoot fly in maize. The researchers studied two maize inbred lines, CM143 and CM144, and their F2:3 progenies. They measured traits related to shoot fly resistance, such as egg count, leaf injury, and dead heart percentage, in the parents and progenies over time. Phenotypic correlations between traits were calculated. The progenies were genotyped using SSR markers and a genetic linkage map was constructed. QTL analysis identified several QTL associated with traits like leaf width, length, area, injury, and stem girth on different chromosomes. The QTL explained phenotypic variances ranging from 7-


![Character Associated and Path Analysis in Pigeon Pea [Cajanus Cajan (L) Millsp.]](https://cdn.slidesharecdn.com/ss_thumbnails/ijsrdv2i7164-150921123533-lva1-app6892-thumbnail.jpg?width=640&height=640&fit=bounds)


