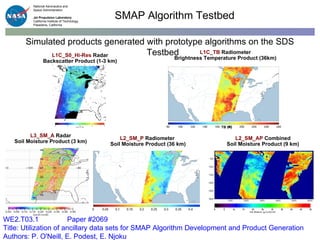
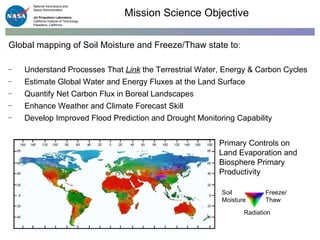
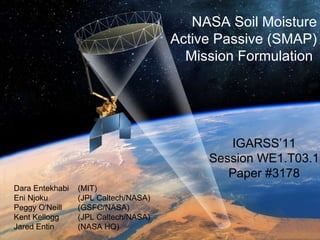
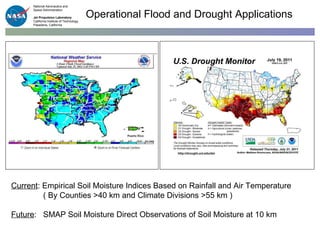
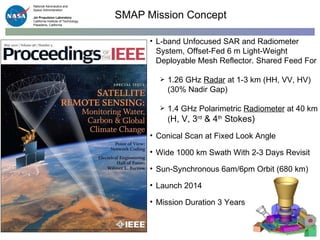
The document discusses the NASA Soil Moisture Active Passive (SMAP) mission, which is scheduled for launch in 2014. SMAP will map global soil moisture and freeze/thaw state from space to further understanding of the water, energy, and carbon cycles. The mission involves an L-band radar and radiometer to provide soil moisture measurements. Algorithms are being developed and tested to generate products like soil moisture maps from the radar-radiometer data. Validation efforts and working groups are helping prepare for the mission.
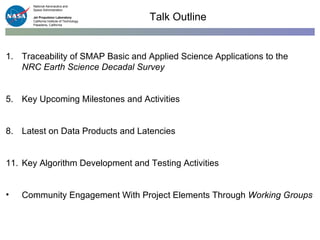
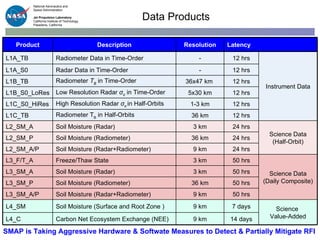
![(*) % classification accuracy (binary Freeze/Thaw) (**) [cm 3 cm -3 ] volumetric water content, 1-sigma Science Requirements (1) North of 45N latitude Requirement Hydro-Meteorology Hydro-Climatology Carbon Cycle Baseline Mission Soil Moisture Freeze/Thaw Resolution 4–15 km 50–100 km 1–10 km 10 km 3 km Refresh Rate 2–3 days 3–4 days 2–3 days (1) 3 days 2 days (1) Accuracy 4–6% ** 4–6%** 80–70%* 4%** 80%* DS Objective Application Science Requirement Weather Forecast Initialization of Numerical Weather Prediction (NWP) Hydrometeorology Climate Prediction Boundary and Initial Conditions for Seasonal Climate Prediction Models Hydroclimatology Testing Land Surface Models in General Circulation Models Drought and Agriculture Monitoring Seasonal Precipitation Prediction Hydroclimatology Regional Drought Monitoring Crop Outlook Flood Forecast Improvements River Forecast Model Initialization Hydrometeorology Flash Flood Guidance (FFG) NWP Initialization for Precipitation Forecast Human Health Seasonal Heat Stress Outlook Hydroclimatology Near-Term Air Temperature and Heat Stress Forecast Hydrometeorology Disease Vector Seasonal Outlook Hydroclimatology Disease Vector Near-Term Forecast (NWP) Hydrometeorology Boreal Carbon Freeze/Thaw Date Freeze/Thaw State](https://image.slidesharecdn.com/3178-igarss11-110727101809-phpapp02/85/3178_IGARSS11-ppt-7-320.jpg)
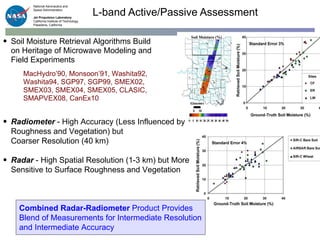
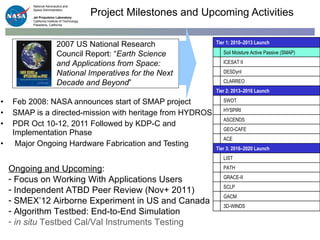
![SGP99, SMEX02, CLASIC and SMAPVEX08 WE2.T03.2 Paper #: 3398 Title: Evaluation of the SMAPCombined Radar-Radiometer Soil Moisture Algorithm Authors: N. Das, D. Entekhabi, S. Chan, S. Kim, E. Njoku, R. Dunbar, J.C. Shi Active-Passive Algorithm Performance Minimum Performance Algorithm RMSE: 0.055 [cm 3 cm -3 ] Active-Passive Algorithm RMSE: 0.033 [cm 3 cm -3 ]](https://image.slidesharecdn.com/3178-igarss11-110727101809-phpapp02/85/3178_IGARSS11-ppt-14-320.jpg)