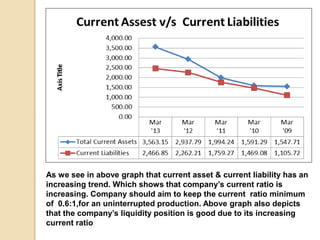
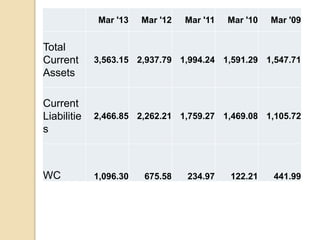
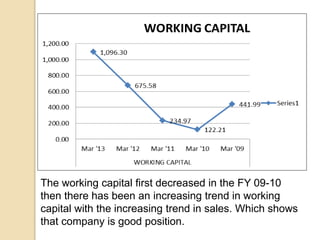
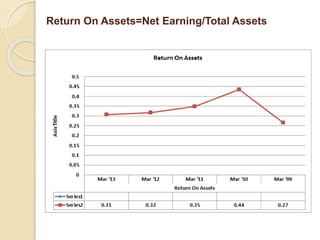
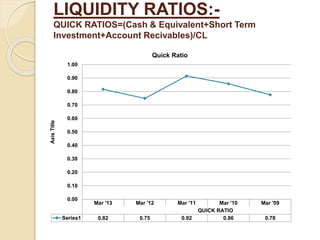
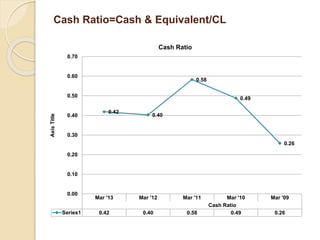
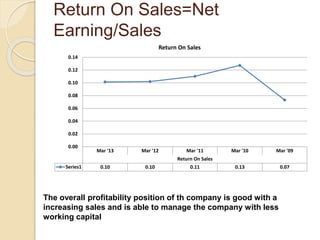
WORKING CAPITAL 
MANAGEMENT 
ASIAN PAINTS LIMITED 
BY-Gopal Kumar 
13DM041 
IMIS,Bhubaneswar
 Asian Paints Limited is an 
Indian chemicals company 
headquartered in Mumbai, India. Asian 
Paints Ltd is India's largest paint 
company and Asia's third largest paint 
company with a turnover of Rs 96.32 
billion. Operations in 22 countries .
As we see in above graph that current asset & current liability has an 
increasing trend. Which shows that company’s current ratio is 
increasing. Company should aim to keep the current ratio minimum 
of 0.6:1,for an uninterrupted production. Above graph also depicts 
that the company’s liquidity position is good due to its increasing 
current ratio
Mar '13 Mar '12 Mar '11 Mar '10 Mar '09 
Total 
Current 
Assets 
3,563.15 2,937.79 1,994.24 1,591.29 1,547.71 
Current 
Liabilitie 
s 
2,466.85 2,262.21 1,759.27 1,469.08 1,105.72 
WC 1,096.30 675.58 234.97 122.21 441.99
The working capital first decreased in the FY 09-10 
then there has been an increasing trend in working 
capital with the increasing trend in sales. Which shows 
that company is good position.
Return On Assets=Net Earning/Total Assets
LIQUIDITY RATIOS:- 
QUICK RATIOS=(Cash & Equivalent+Short Term 
Investment+Account Recivables)/CL 
Mar '13 Mar '12 Mar '11 Mar '10 Mar '09 
QUICK RATIO 
1.00 
0.90 
0.80 
0.70 
0.60 
0.50 
0.40 
0.30 
0.20 
0.10 
0.00 
Series1 0.82 0.75 0.92 0.86 0.78 
Axis Title 
Quick Ratio
Cash Ratio=Cash & Equivalent/CL 
0.42 
0.40 
0.58 
0.49 
0.26 
Mar '13 Mar '12 Mar '11 Mar '10 Mar '09 
Cash Ratio 
0.70 
0.60 
0.50 
0.40 
0.30 
0.20 
0.10 
0.00 
Series1 0.42 0.40 0.58 0.49 0.26 
Axis Title 
Cash Ratio
Current Ratio=CA/CL 
Current Ratio 
Mar '13 Mar '12 Mar '11 Mar '10 Mar '09 
Current Ratio 
1.60 
1.40 
1.20 
1.00 
0.80 
0.60 
0.40 
0.20 
0.00 
Series1 1.44 1.30 1.13 1.08 1.40 
Axis Title 
Though the company’s sales has shown an increasing trend . There 
is a fall in liquidity position . Which shows that company is able to 
manage its day to day activities with less cash balance . Which of 
course can be taken as company has a goodwill in the market
PROFITABILITY RATIO: 
Return On Assets=Net Earning/Total 
Assets 
Return On Assets 
Mar '13 Mar '12 Mar '11 Mar '10 Mar '09 
Return On Assets 
0.5 
0.45 
0.4 
0.35 
0.3 
0.25 
0.2 
0.15 
0.1 
0.05 
0 
Series1 
Series2 0.31 0.32 0.35 0.44 0.27 
Axis Title 
The return on asset has first shown an increasing trend 2009- 
2010,then it has shown an decreasing trend
Return On Equity=Net Earning/Owner's 
Equity 
Mar '13 Mar '12 Mar '11 Mar '10 Mar '09 
Return On Equity 
14.00 
12.00 
10.00 
8.00 
6.00 
4.00 
2.00 
0.00 
Series1 12.09 10.64 9.19 9.22 4.37 
Axis Title 
Return On Equity 
The return on equity has shown an increasing trend which shows 
that the company is in good position.
Gross Margin=(Sales- 
COGS)/Sales 
Gross Margin 
Mar '13 Mar '12 Mar '11 Mar '10 Mar '09 
Gross Margin 
0.18 
0.16 
0.14 
0.12 
0.10 
0.08 
0.06 
0.04 
0.02 
0.00 
Series1 0.13 0.13 0.14 0.16 0.12
Return On Sales=Net 
Earning/Sales 
Return On Sales 
Mar '13 Mar '12 Mar '11 Mar '10 Mar '09 
Return On Sales 
0.14 
0.12 
0.10 
0.08 
0.06 
0.04 
0.02 
0.00 
Series1 0.10 0.10 0.11 0.13 0.07 
The overall profitability position of th company is good with a 
increasing sales and is able to manage the company with less 
working capital
AGGRESSIVE 
Advantages: 
i)  
Less chance of bad debts 
ii) Recover money more quickly and thereby 
reducing the Cash Conversion Cycle. 
Disadvantages: 
i) Customers may object and the firm may lose 
sales/customers 
ii) Expensive Strategy as we have to call 
customers again and again or send them letters 
several times.
CONCLUSION 
As per the study of different ratios .we 
can conclude that Asian paints is a 
profit making company with a very less 
working capital . Though the company 
sales is increasing , the company is 
able to manage its day to day activities 
with less working capital which shows 
that the company is able to purchase its 
raw material in credit . This shows that 
company has built its good goodwill in 
the market.
THANK YOU

Working capital management

  • 1.
    WORKING CAPITAL MANAGEMENT ASIAN PAINTS LIMITED BY-Gopal Kumar 13DM041 IMIS,Bhubaneswar
  • 2.
     Asian PaintsLimited is an Indian chemicals company headquartered in Mumbai, India. Asian Paints Ltd is India's largest paint company and Asia's third largest paint company with a turnover of Rs 96.32 billion. Operations in 22 countries .
  • 3.
    As we seein above graph that current asset & current liability has an increasing trend. Which shows that company’s current ratio is increasing. Company should aim to keep the current ratio minimum of 0.6:1,for an uninterrupted production. Above graph also depicts that the company’s liquidity position is good due to its increasing current ratio
  • 4.
    Mar '13 Mar'12 Mar '11 Mar '10 Mar '09 Total Current Assets 3,563.15 2,937.79 1,994.24 1,591.29 1,547.71 Current Liabilitie s 2,466.85 2,262.21 1,759.27 1,469.08 1,105.72 WC 1,096.30 675.58 234.97 122.21 441.99
  • 5.
    The working capitalfirst decreased in the FY 09-10 then there has been an increasing trend in working capital with the increasing trend in sales. Which shows that company is good position.
  • 6.
    Return On Assets=NetEarning/Total Assets
  • 7.
    LIQUIDITY RATIOS:- QUICKRATIOS=(Cash & Equivalent+Short Term Investment+Account Recivables)/CL Mar '13 Mar '12 Mar '11 Mar '10 Mar '09 QUICK RATIO 1.00 0.90 0.80 0.70 0.60 0.50 0.40 0.30 0.20 0.10 0.00 Series1 0.82 0.75 0.92 0.86 0.78 Axis Title Quick Ratio
  • 8.
    Cash Ratio=Cash &Equivalent/CL 0.42 0.40 0.58 0.49 0.26 Mar '13 Mar '12 Mar '11 Mar '10 Mar '09 Cash Ratio 0.70 0.60 0.50 0.40 0.30 0.20 0.10 0.00 Series1 0.42 0.40 0.58 0.49 0.26 Axis Title Cash Ratio
  • 9.
    Current Ratio=CA/CL CurrentRatio Mar '13 Mar '12 Mar '11 Mar '10 Mar '09 Current Ratio 1.60 1.40 1.20 1.00 0.80 0.60 0.40 0.20 0.00 Series1 1.44 1.30 1.13 1.08 1.40 Axis Title Though the company’s sales has shown an increasing trend . There is a fall in liquidity position . Which shows that company is able to manage its day to day activities with less cash balance . Which of course can be taken as company has a goodwill in the market
  • 10.
    PROFITABILITY RATIO: ReturnOn Assets=Net Earning/Total Assets Return On Assets Mar '13 Mar '12 Mar '11 Mar '10 Mar '09 Return On Assets 0.5 0.45 0.4 0.35 0.3 0.25 0.2 0.15 0.1 0.05 0 Series1 Series2 0.31 0.32 0.35 0.44 0.27 Axis Title The return on asset has first shown an increasing trend 2009- 2010,then it has shown an decreasing trend
  • 11.
    Return On Equity=NetEarning/Owner's Equity Mar '13 Mar '12 Mar '11 Mar '10 Mar '09 Return On Equity 14.00 12.00 10.00 8.00 6.00 4.00 2.00 0.00 Series1 12.09 10.64 9.19 9.22 4.37 Axis Title Return On Equity The return on equity has shown an increasing trend which shows that the company is in good position.
  • 12.
    Gross Margin=(Sales- COGS)/Sales Gross Margin Mar '13 Mar '12 Mar '11 Mar '10 Mar '09 Gross Margin 0.18 0.16 0.14 0.12 0.10 0.08 0.06 0.04 0.02 0.00 Series1 0.13 0.13 0.14 0.16 0.12
  • 13.
    Return On Sales=Net Earning/Sales Return On Sales Mar '13 Mar '12 Mar '11 Mar '10 Mar '09 Return On Sales 0.14 0.12 0.10 0.08 0.06 0.04 0.02 0.00 Series1 0.10 0.10 0.11 0.13 0.07 The overall profitability position of th company is good with a increasing sales and is able to manage the company with less working capital
  • 14.
    AGGRESSIVE Advantages: i) Less chance of bad debts ii) Recover money more quickly and thereby reducing the Cash Conversion Cycle. Disadvantages: i) Customers may object and the firm may lose sales/customers ii) Expensive Strategy as we have to call customers again and again or send them letters several times.
  • 15.
    CONCLUSION As perthe study of different ratios .we can conclude that Asian paints is a profit making company with a very less working capital . Though the company sales is increasing , the company is able to manage its day to day activities with less working capital which shows that the company is able to purchase its raw material in credit . This shows that company has built its good goodwill in the market.
  • 16.