Downloaded 281 times

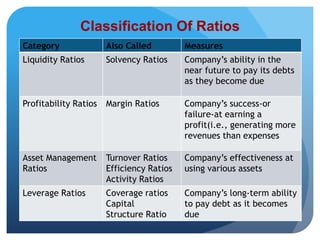

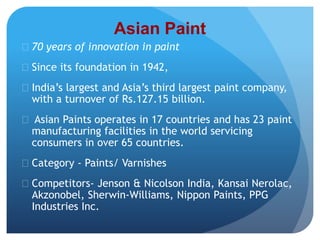
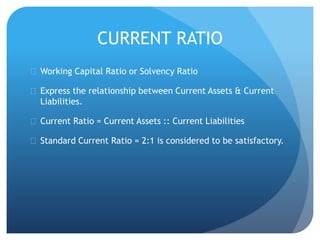
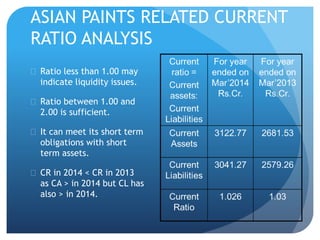
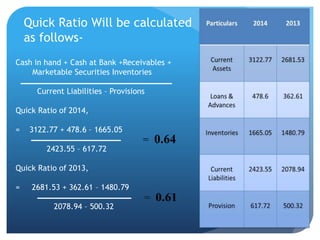
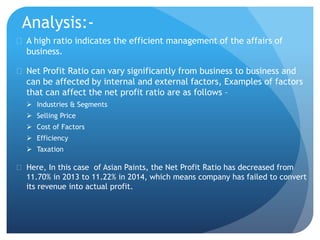
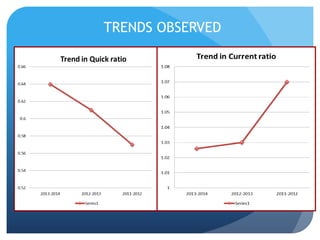
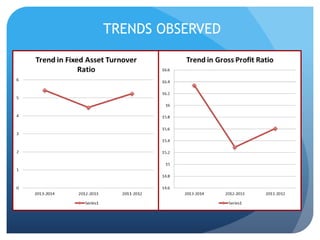
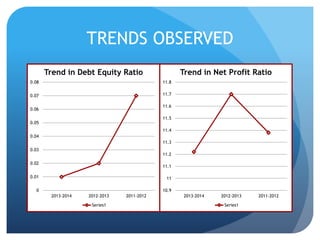


The document discusses the ratio analysis of Asian Paints, focusing on various financial ratios that assess the company's performance, liquidity, and profitability. It covers different types of ratios, including current ratio, quick ratio, and debt equity ratio, along with their significance and calculations for the years 2013 and 2014. Additionally, it highlights trends observed in profitability and operational efficiency, indicating areas of growth and concern for the company.


![AMD_RATIO_ANALYSIS[1]^.pdf](https://cdn.slidesharecdn.com/ss_thumbnails/amdratioanalysis1-230929171011-94b8a5e9-thumbnail.jpg?width=640&height=640&fit=bounds)


