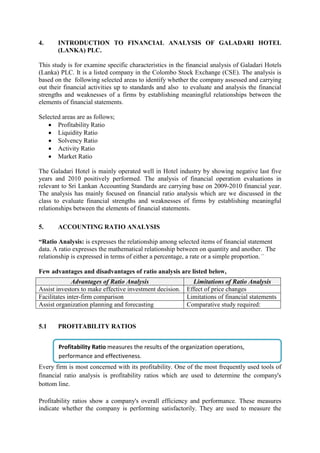
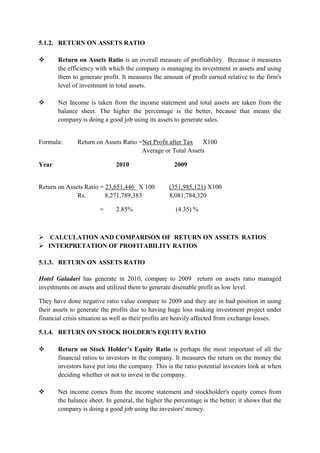
The existing business environment is very turbulent so corporate houses find it very difficult in managing their financial statement. In such scenario, financial management plays significant role for the companies for managing and organizing their financial data and
statements. In the following study different financial tools and techniques will be applied on the London Woods company to analyze its financial performance which will help it in decision making.
Cargills (Ceylon) PLC & Nestle Lanka PLC financial position and the performa...Dulakshi Ranadeera
Chapter 1
1.1. Earnings per Share
1.2. Dividend per Share…
1.3. Market Value…
1.4. Cash Flow
1.5. Profitability Ratios
1.6. Net Asset per Share
1.7. Solvency Ratios
1.8. Liquidity Position
2. Chapter 2
2.1. Nestle Lanka
2.1.1. The level of the corporate governance and legal procedure of the company
2.1.2. Compliance for legal procedure
2.1.3. Employee relations and relationship with shareholders
2.1.4. Social Responsibilities of the organization
2.1.5. Share information
2.1.6. Market share Percentage
2.2. Cargills (Ceylon) PLC
2.2.1. The level of the corporate governance and legal procedure of the company
2.2.2. Compliance for legal procedure
2.2.3. Employee relations and relationship with shareholders
2.2.4. Social Responsibilities of the organization
2.2.5. Share information
2.2.6. Market share Percentage
Chapter 3
Financial Ratio Analysis of Samsung for the year 2013-2014Prinson Rodrigues
Financial Ratio Analysis of Samsung For the year 2013-2014
Current ratio
Quick ratio
Debt equity ratio
Capital turnover ratio
Fixed Assets Turnover ratio
Working capital turnover ratio
Stock turnover ratio
inventory conversion period
Debtors turnover ratio
Gross profit ratio
net profit ratio
etc
Sample Report On Operation Management in Business By Global Assignment HelpAmelia Jones
Operation management is the most important section of business management. In this process, management of business formulates various strategies for the assessment and optimum allocation of different kinds of resources and functions to get the desired outcomes. For more information regarding Operation Management in Business read our complete sample.
Assignment of the individual assignment For the Strategic Management of the Postgraduate Diploma in Business Management, University of Colombo (2013/14)
ANALYSIS OF FINANCIAL PERFORMANCE OF THOMAS COOK (INDIA) LTD. USING RATIO ANA...Anirban Chakraborty
ANALYSIS OF FINANCIAL PERFORMANCE OF THOMAS COOK (INDIA) LTD. USING RATIO ANALYSIS
This study gives in detail the analysis of various financial ratios based upon the past as well as
the present performance of Thomas Cook (India) Ltd. expressed in financial data. Based upon
the results from these financial ratios conclusions are driven out that whether the company has
been earning profits or not and also that how much it has used these results in its growth. So, the
company can also manage each of its current assets namely cash management, accounts
receivable management and also its liabilities like creditors, loans, bills payables etc. so that it
can maintain an identical financial ratio for each of its business aspects like solvency ratios,
turnover ratios, profitability ratios etc.
Mien Phi Tai 10 Bai Assignment Mau Tu Moi Chu De
---------
Bài viết dưới đây chia sẻ các bài assignment mẫu tiêu biểu, đạt điểm cao. Các bạn cùng tìm hiểu luôn nhé.
Chi tiết bài viết: https://essay24h.com/cam-nang-asignment/bai-assignment-mau/
#essay24h, #viết_thuê_assignment, #viết_assignment_thuê, #dịch_vụ_viết_assignment, #thuê_viết_essay_tiếng_anh, #dịch_vụ_làm_assignment, #nhận_làm_luận_văn_tiếng_anh, #nhận_viết_essay_thuê, #dịch_vụ_viết_essay, #viết_essay_thuê, #chuyên_viết_thuê_assignment, #dịch_vụ_viết_thuê_assignment
Similar to Financial ration analysis assignment (20)
RMD24 | Debunking the non-endemic revenue myth Marvin Vacquier Droop | First ...BBPMedia1
Marvin neemt je in deze presentatie mee in de voordelen van non-endemic advertising op retail media netwerken. Hij brengt ook de uitdagingen in beeld die de markt op dit moment heeft op het gebied van retail media voor niet-leveranciers.
Retail media wordt gezien als het nieuwe advertising-medium en ook mediabureaus richten massaal retail media-afdelingen op. Merken die niet in de betreffende winkel liggen staan ook nog niet in de rij om op de retail media netwerken te adverteren. Marvin belicht de uitdagingen die er zijn om echt aansluiting te vinden op die markt van non-endemic advertising.
The world of search engine optimization (SEO) is buzzing with discussions after Google confirmed that around 2,500 leaked internal documents related to its Search feature are indeed authentic. The revelation has sparked significant concerns within the SEO community. The leaked documents were initially reported by SEO experts Rand Fishkin and Mike King, igniting widespread analysis and discourse. For More Info:- https://news.arihantwebtech.com/search-disrupted-googles-leaked-documents-rock-the-seo-world/
3.0 Project 2_ Developing My Brand Identity Kit.pptxtanyjahb
A personal brand exploration presentation summarizes an individual's unique qualities and goals, covering strengths, values, passions, and target audience. It helps individuals understand what makes them stand out, their desired image, and how they aim to achieve it.
RMD24 | Retail media: hoe zet je dit in als je geen AH of Unilever bent? Heid...BBPMedia1
Grote partijen zijn al een tijdje onderweg met retail media. Ondertussen worden in dit domein ook de kansen zichtbaar voor andere spelers in de markt. Maar met die kansen ontstaan ook vragen: Zelf retail media worden of erop adverteren? In welke fase van de funnel past het en hoe integreer je het in een mediaplan? Wat is nu precies het verschil met marketplaces en Programmatic ads? In dit half uur beslechten we de dilemma's en krijg je antwoorden op wanneer het voor jou tijd is om de volgende stap te zetten.
Enterprise Excellence is Inclusive Excellence.pdfKaiNexus
Enterprise excellence and inclusive excellence are closely linked, and real-world challenges have shown that both are essential to the success of any organization. To achieve enterprise excellence, organizations must focus on improving their operations and processes while creating an inclusive environment that engages everyone. In this interactive session, the facilitator will highlight commonly established business practices and how they limit our ability to engage everyone every day. More importantly, though, participants will likely gain increased awareness of what we can do differently to maximize enterprise excellence through deliberate inclusion.
What is Enterprise Excellence?
Enterprise Excellence is a holistic approach that's aimed at achieving world-class performance across all aspects of the organization.
What might I learn?
A way to engage all in creating Inclusive Excellence. Lessons from the US military and their parallels to the story of Harry Potter. How belt systems and CI teams can destroy inclusive practices. How leadership language invites people to the party. There are three things leaders can do to engage everyone every day: maximizing psychological safety to create environments where folks learn, contribute, and challenge the status quo.
Who might benefit? Anyone and everyone leading folks from the shop floor to top floor.
Dr. William Harvey is a seasoned Operations Leader with extensive experience in chemical processing, manufacturing, and operations management. At Michelman, he currently oversees multiple sites, leading teams in strategic planning and coaching/practicing continuous improvement. William is set to start his eighth year of teaching at the University of Cincinnati where he teaches marketing, finance, and management. William holds various certifications in change management, quality, leadership, operational excellence, team building, and DiSC, among others.
Business Valuation Principles for EntrepreneursBen Wann
This insightful presentation is designed to equip entrepreneurs with the essential knowledge and tools needed to accurately value their businesses. Understanding business valuation is crucial for making informed decisions, whether you're seeking investment, planning to sell, or simply want to gauge your company's worth.
Implicitly or explicitly all competing businesses employ a strategy to select a mix
of marketing resources. Formulating such competitive strategies fundamentally
involves recognizing relationships between elements of the marketing mix (e.g.,
price and product quality), as well as assessing competitive and market conditions
(i.e., industry structure in the language of economics).
Buy Verified PayPal Account | Buy Google 5 Star Reviewsusawebmarket
Buy Verified PayPal Account
Looking to buy verified PayPal accounts? Discover 7 expert tips for safely purchasing a verified PayPal account in 2024. Ensure security and reliability for your transactions.
PayPal Services Features-
🟢 Email Access
🟢 Bank Added
🟢 Card Verified
🟢 Full SSN Provided
🟢 Phone Number Access
🟢 Driving License Copy
🟢 Fasted Delivery
Client Satisfaction is Our First priority. Our services is very appropriate to buy. We assume that the first-rate way to purchase our offerings is to order on the website. If you have any worry in our cooperation usually You can order us on Skype or Telegram.
24/7 Hours Reply/Please Contact
usawebmarketEmail: support@usawebmarket.com
Skype: usawebmarket
Telegram: @usawebmarket
WhatsApp: +1(218) 203-5951
USA WEB MARKET is the Best Verified PayPal, Payoneer, Cash App, Skrill, Neteller, Stripe Account and SEO, SMM Service provider.100%Satisfection granted.100% replacement Granted.
Tata Group Dials Taiwan for Its Chipmaking Ambition in Gujarat’s DholeraAvirahi City Dholera
The Tata Group, a titan of Indian industry, is making waves with its advanced talks with Taiwanese chipmakers Powerchip Semiconductor Manufacturing Corporation (PSMC) and UMC Group. The goal? Establishing a cutting-edge semiconductor fabrication unit (fab) in Dholera, Gujarat. This isn’t just any project; it’s a potential game changer for India’s chipmaking aspirations and a boon for investors seeking promising residential projects in dholera sir.
Visit : https://www.avirahi.com/blog/tata-group-dials-taiwan-for-its-chipmaking-ambition-in-gujarats-dholera/
"𝑩𝑬𝑮𝑼𝑵 𝑾𝑰𝑻𝑯 𝑻𝑱 𝑰𝑺 𝑯𝑨𝑳𝑭 𝑫𝑶𝑵𝑬"
𝐓𝐉 𝐂𝐨𝐦𝐬 (𝐓𝐉 𝐂𝐨𝐦𝐦𝐮𝐧𝐢𝐜𝐚𝐭𝐢𝐨𝐧𝐬) is a professional event agency that includes experts in the event-organizing market in Vietnam, Korea, and ASEAN countries. We provide unlimited types of events from Music concerts, Fan meetings, and Culture festivals to Corporate events, Internal company events, Golf tournaments, MICE events, and Exhibitions.
𝐓𝐉 𝐂𝐨𝐦𝐬 provides unlimited package services including such as Event organizing, Event planning, Event production, Manpower, PR marketing, Design 2D/3D, VIP protocols, Interpreter agency, etc.
Sports events - Golf competitions/billiards competitions/company sports events: dynamic and challenging
⭐ 𝐅𝐞𝐚𝐭𝐮𝐫𝐞𝐝 𝐩𝐫𝐨𝐣𝐞𝐜𝐭𝐬:
➢ 2024 BAEKHYUN [Lonsdaleite] IN HO CHI MINH
➢ SUPER JUNIOR-L.S.S. THE SHOW : Th3ee Guys in HO CHI MINH
➢FreenBecky 1st Fan Meeting in Vietnam
➢CHILDREN ART EXHIBITION 2024: BEYOND BARRIERS
➢ WOW K-Music Festival 2023
➢ Winner [CROSS] Tour in HCM
➢ Super Show 9 in HCM with Super Junior
➢ HCMC - Gyeongsangbuk-do Culture and Tourism Festival
➢ Korean Vietnam Partnership - Fair with LG
➢ Korean President visits Samsung Electronics R&D Center
➢ Vietnam Food Expo with Lotte Wellfood
"𝐄𝐯𝐞𝐫𝐲 𝐞𝐯𝐞𝐧𝐭 𝐢𝐬 𝐚 𝐬𝐭𝐨𝐫𝐲, 𝐚 𝐬𝐩𝐞𝐜𝐢𝐚𝐥 𝐣𝐨𝐮𝐫𝐧𝐞𝐲. 𝐖𝐞 𝐚𝐥𝐰𝐚𝐲𝐬 𝐛𝐞𝐥𝐢𝐞𝐯𝐞 𝐭𝐡𝐚𝐭 𝐬𝐡𝐨𝐫𝐭𝐥𝐲 𝐲𝐨𝐮 𝐰𝐢𝐥𝐥 𝐛𝐞 𝐚 𝐩𝐚𝐫𝐭 𝐨𝐟 𝐨𝐮𝐫 𝐬𝐭𝐨𝐫𝐢𝐞𝐬."
What are the main advantages of using HR recruiter services.pdfHumanResourceDimensi1
HR recruiter services offer top talents to companies according to their specific needs. They handle all recruitment tasks from job posting to onboarding and help companies concentrate on their business growth. With their expertise and years of experience, they streamline the hiring process and save time and resources for the company.
Putting the SPARK into Virtual Training.pptxCynthia Clay
This 60-minute webinar, sponsored by Adobe, was delivered for the Training Mag Network. It explored the five elements of SPARK: Storytelling, Purpose, Action, Relationships, and Kudos. Knowing how to tell a well-structured story is key to building long-term memory. Stating a clear purpose that doesn't take away from the discovery learning process is critical. Ensuring that people move from theory to practical application is imperative. Creating strong social learning is the key to commitment and engagement. Validating and affirming participants' comments is the way to create a positive learning environment.
1. ACCOUNTING RATIO ANALYSIS TO ASSESS THE ACCOUNTING SECTOR IN
GALADARI HOTELS (LANKA) PLC.
– FINANCIAL YEAR 2009/2010 –
Accounting and Finance - Pgdbm 503
Assignment 1
Mohammed Muthalif Fathima Nasriya
Registration No. 072
Postgraduate Diploma in Business Management
Faculty of Graduate Studies
University of Colombo
Sri Lanka
February 2014
2. 1. INTRODUCTION
Business has never been as competitive as it stands today, there are witnessed the fall of
many industry giants within the last decade than ever before. Industry experts and scholars
put this down to many reasons, not forecasting or adapting to possible changers. Not been
proactive enough but reactive are few to name. A major area which attracted the lime light
was the ‘Accounting sector’ mainly many critics pointed out that the reason for ‘Financial
Giant’ to collapse was due to lack of correct (Legal) and ethical accounting practices,
reflecting their true financial picture/status to the public.
Financial reports at a glance provide the ‘profit and loss’ stance of a company, but to get the
maximum leverage or insight knowledge one should be able to ‘read between the lines’ in
accounting terms in an annual report. This is the point where they can use the ‘ratio analysis’
as a vital tool. Not only to analyze the profit/ loss but many other important factors.
Understanding the cost effectiveness, capital and liability structure in long term and short
term perceptive, effectiveness of assets management, income turnover of assets, etc.
They had many ideas and views to approach this task, to show the effectiveness of the ratio
analysis and at the end commonly agreed to focus our study on the ‘Hotel / tourism Industry’
where we selected two major (five star) hotels holding companies and the year 2010 as the
year to conduct the study, based on their annual reports.
There were many reasons behind this selection, as 2010 was a historical year for all Sri
Lankans in which we as a nation had to face the peak of the civil war and with a sign of relief
saw the end to the 30 year hard fought civil war, three major elections, flood, initiation of
major investments, increase in tourists, etc. In a country like Sri Lanka though the share
market does not reflect the true picture of the business functions, we have been able to loop
the business and financial fluctuations logically and strategically to reflect the original
purpose of the study.
I hope that this comprehensive and descriptive ratio analysis will be able to give an in-depth
insight to the industry and much other functionality in a more coherent and an accountable
manner.
3. 2. INTRODUCTION TO THE INDUSTRY
Sri Lanka is well-known around the world as being an attractive destination for travel and
tourism, offering a wide range of experiences. The sector is a significant contributor to
national income and has emerged as the 4th
highest foreign exchange earner in the country.
Gross earnings from tourism stood at US $ 384 million in 2010 an increase of 12.3 percent
over 2009 making itself as the fast emerging growth industry in the economy. Recently New
York identified Sri Lanka as the number one destination out of 31 to visit in the world in year
2010.
The Sri Lankan tourism sector is gearing up for increased arrivals and higher average daily
expenditure per tourist. It is also focusing on increasing room capacity and generating
additional direct employment.
3. COMPANY PROFILES
GALADARI HOTELS (LANKA) PLC.
Coroporate Structure
The hotel Galadari is situated in the heart of Colombo's business district, and accomplishes
with 450super luxury rooms, that overlooks the Indian Ocean and is adjacent to leading
Banks and the World Trade Center, with easy access to the shopping areas in Colombo.
The Galadari Hotels (Lanka) Plc. offers a rich blend of service and quality in five star luxury
living. Hotel ensure and meticulous about maintaining the privacy of its guests has drawn in
many an elite personality from around the world such as heads of government, prime
ministers of leading nations, royalty, well known sports & music personalities over the past
two and half decades.
With a range of room and suite types, and a comprehensive list of facilities, the hotel is able
to cater to the requirements of both business and family travelers, and is especially geared to
handle the needs of Muslim clients, with Halal food in all restaurants.
4. 4. INTRODUCTION TO FINANCIAL ANALYSIS OF GALADARI HOTEL
(LANKA) PLC.
This study is for examine specific characteristics in the financial analysis of Galadari Hotels
(Lanka) PLC. It is a listed company in the Colombo Stock Exchange (CSE). The analysis is
based on the following selected areas to identify whether the company assessed and carrying
out their financial activities up to standards and also to evaluate and analysis the financial
strengths and weaknesses of a firms by establishing meaningful relationships between the
elements of financial statements.
Selected areas are as follows;
Profitability Ratio
Liquidity Ratio
Solvency Ratio
Activity Ratio
Market Ratio
The Galadari Hotel is mainly operated well in Hotel industry by showing negative last five
years and 2010 positively performed. The analysis of financial operation evaluations in
relevant to Sri Lankan Accounting Standards are carrying base on 2009-2010 financial year.
The analysis has mainly focused on financial ratio analysis which are we discussed in the
class to evaluate financial strengths and weaknesses of firms by establishing meaningful
relationships between the elements of financial statements.
5. ACCOUNTING RATIO ANALYSIS
“Ratio Analysis: is expresses the relationship among selected items of financial statement
data. A ratio expresses the mathematical relationship between on quantity and another. The
relationship is expressed in terms of either a percentage, a rate or a simple proportion.”
Few advantages and disadvantages of ratio analysis are listed below,
5.1 PROFITABILITY RATIOS
Every firm is most concerned with its profitability. One of the most frequently used tools of
financial ratio analysis is profitability ratios which are used to determine the company's
bottom line.
Profitability ratios show a company's overall efficiency and performance. These measures
indicate whether the company is performing satisfactorily. They are used to measure the
Advantages of Ratio Analysis Limitations of Ratio Analysis
Assist investors to make effective investment decision. Effect of price changes
Facilitates inter-firm comparison Limitations of financial statements
Assist organization planning and forecasting Comparative study required:
Profitability Ratio measures the results of the organization operations,
performance and effectiveness.
5. performance of the management, to identify whether a company may be a worthwhile
investment opportunity and to determine a company’s Performance relative to its
competitors.
Classifications of profitability ratios
5.1.1. Gross Profit Ratio
Gross Profit Ratio indicates the amount of earnings, required to pay fixed costs and
profits, are generated from revenues.
Indicates how much of each sales rupee is available to meet expenses and profits after
merely paying for the goods that were sold of an organization.
The gross profit margin looks at cost of goods sold as a percentage of sales. This ratio
looks at how well a company controls the cost of its inventory and the manufacturing
of its products or services and subsequently passes on the costs to its customers. The
larger the gross profit margin, the better for the company.
Formula: Gross Profit Ratio = Gross Profit X 100
Net Sales
Calculation and comparison of Gross Profit Ratios for Galadari Holtel PLC.
Year 2010 2009
Gross Profit = 827,733,335 X 100 577,378,333 X100
Rs. 1,026,180,900 730,093,065
= 80.66% 79.08%
According to the definition of gross profit ratio, the company who has generated the highest
value of gross profit is best/ preferred, because gross margin should be adequate to cover-up
other expenses of the company.
According to the above analysis, Companies can be rank as below,
In 2010 – Good 2009 - Average
Profitability Ratios
Gross Profit
Ratios
Return on
Asset Ratios
Return on
Equity Ratios
6. 5.1.2. RETURN ON ASSETS RATIO
Return on Assets Ratio is an overall measure of profitability. Because it measures
the efficiency with which the company is managing its investment in assets and using
them to generate profit. It measures the amount of profit earned relative to the firm's
level of investment in total assets.
Net Income is taken from the income statement and total assets are taken from the
balance sheet. The higher the percentage is the better, because that means the
company is doing a good job using its assets to generate sales.
Formula: Return on Assets Ratio =Net Profit after Tax X100
Average or Total Assets
Year 2010 2009
Return on Assets Ratio = 23,651,446 X 100 (351,985,121) X100
Rs. 8,271,789,383 8,081,784,320
= 2.85% (4.35) %
CALCULATION AND COMPARISON OF RETURN ON ASSETS RATIOS
INTERPRETATION OF PROFITABILITY RATIOS
5.1.3. RETURN ON ASSETS RATIO
Hotel Galadari has generate in 2010, compare to 2009 return on assets ratio managed
investments on assets and utilized them to generate disenable profit as low level.
They have done negative ratio value compare to 2009 and they are in bad position in using
their assets to generate the profits due to having huge loss making investment project under
financial crisis situation as well as their profits are heavily affected from exchange losses.
5.1.4. RETURN ON STOCK HOLDER’S EQUITY RATIO
Return on Stock Holder’s Equity Ratio is perhaps the most important of all the
financial ratios to investors in the company. It measures the return on the money the
investors have put into the company. This is the ratio potential investors look at when
deciding whether or not to invest in the company.
Net income comes from the income statement and stockholder's equity comes from
the balance sheet. In general, the higher the percentage is the better; it shows that the
company is doing a good job using the investors' money.
7. Formula: Return on Stock Holder’s Equity = Net Income X100
Average Common Stockholder’s Equity
Year 2010 2009
Return on Stock Holder’s Equity = 23,651,446 X 100 (351,985,121) X100
Rs. 1,527,843,977 1,346,063,925
= 1.5% (26.15) %
CALCULATION AND COMPARISON OF RETURN ON EQUITY RATIOS
INTERPRETATION OF PROFITABILITY RATIOS
4. RETURN ON STOCK HOLDER’S EQUITY
Management of the Galadari Hotels Plc is able to utilize investor’s money effectively and
efficiently. Therefore the investors of Galadari Hotels PLC. Has taken the low level return on
the capital that they have invested in to the company.
And very poor return on equity ratio. There are unable to generate sufficient profits to pay off
fair retunes to their investors’ mainly due heavy out flow of financial expenses based on
interest payments for bank overdrafts, financial leases and term loans and administration
expenses.
2. LIQUIDITY RATIOS
A class of financial metrics that is used to determine a company's ability to pay off its short-
terms debts obligations.
Liquidity ratios measure the short-term ability of the company to pay its maturing obligations
and to meet unexpected needs for cash. Short-term creditors such as bankers and suppliers
are particularly interested in assessing liquidity. The ratios we can use to determine the
company’s short-term debt-paying ability are the current ratio, the acid-test, receivable
turnover and inventory turnover.
Classifications of Liquidity ratios
Liquidity Ratios
Current Ratios Acid –Test (Quick) Ratio Debtor’s collection Period
8. 2.1. CURRENT RATIO
The current ratio is a widely used measure for evaluating a company’s liquidity and
short –term debt-paying ability. The ratio is computed by dividing current assets by current
liabilities.
The concept behind this ratio is to ascertain whether a company's short-term assets
(cash, cash equivalents, marketable securities, receivables and inventory) are readily
available to pay off its short-term liabilities (notes payable, current portion of term debt,
payables, accrued expenses and taxes). The higher the current ratio, the better.
Formula: Current Ratio = Current Assets
Current Liabilities
Year 2010 2009
Current Assets 453,771,761 239,416,915
Current Liabilities 632,017,071 347,183,942
Current Ratio 0.71 0.69
The current ratio is sometimes referred to as the working capital ratio; working capital is
current assets minus current liabilities. The current ratio is a more dependable indicator of
liquidity than working capital.
The current ratio is only one measure of liquidity. It does not take into account the
composition of the current assets. For example a satisfactory current ratio does not disclose
the fact that a portion of the current assets may be tied up in slow-moving inventory. A
dollar of cash would be more readily available to pay the bills than a dollar of slow- moving
inventory.
INTERPRETATION OF LIQUIDITY RATIOS FOR THE GALADARI HOTELS
PLC.
Hotel Gladari current ratios do not significantly vary in both comparable years. Though
Company has an increase in 2010 and slightly decrease in the financial year 2009. Thus
decrease in the current ratio represents that there has been deterioration in the liquidity
position of the firm.
2.2. ACID-TEST (QUICK) RATIO
The acid-test (Quick) ratio is a measure of a company’s immediate short-term liquidity. We
compute this ratio by dividing the sum of cash, short-term investments and net receivables by
current liabilities. Thus, it is an important complement to the current ratio.
9. Calculation and comparison of Acid –Test (Quick) Ratio
Year 2009/2010 2008/2009
Cash and Cash Equivalents 67,832,667 93,687,036
Marketable securities 221,295,981 34,510,654
Accounts receivable 98138418 75940670
Current liabilities 632,017,071 316,724,410
High degree of Certainty Company will cash flow problem.
Who is a man responsible having cash flow problem?
1. Managers not collecting cash on time
3. ACTIVITY RATIOS
Activity ratios measure a firm's ability to convert different accounts (asset, liability or capital
share) within their balance sheets into cash or sales (revenue). Companies will typically try to
turn their production into cash or sales as fast as possible because this will generally lead to
higher revenues.
Activity ratios are critical in evaluating a company’s fundamentals because in addition to
expressing how well a company generates revenue, activity ratios also indicate how well the
company is being managed.
CLASSIFICATIONS OF ACTIVITY RATIOS
Quick Ratio
Year Galadari Hotel
2010/2011 0.57
2009/2010 0.77
Activity Ratio measures the efficiency with which the recourses of a firm have been
employed and its indicate the speed with which assets are being turned over into sales..
Activity Ratios
Inventory/Stock
Turnover Ratio
Debtors / Receivables
Turnover Ratio
Assets Turnover
Ratio
10. 3.1 RECEIVABLE TURNOVER
It can measure liquidity by how quickly a company can convert certain assets to cash. The
ratio used to assess the liquidity of the receivable is receivables turnover. It measures the
number of times, on average; the company collects receivables during the period.
Receivable Turnover = Sales
Average Accounts Receivable
(2010) = 1,026,180,900
(32,865,532 + 23,220,120)
2
= 1,026,180,900
56,085,652
= 1,026,180,900
56,085,652
= 36.59
They collect cash from the customers 36.59 (rounding off 37) times in a financial year.
3.1.2. Collection Period = 365
Receivable Turnover
=365
36.56
9.975 = 10days
Credit period is always 30days. This 10days collection period is not good for Galadari Hotels
PLC. As a five star hotel. Otherwise collection can be going down.
3.3 INVENTORY TURNOVER
Inventory / Stock Turnover Ratio indicates the number of time the stock has been turned
over during the period and evaluates the efficiency with which a firm is able to manage its
inventory. This ratio indicates whether investment in stock is within proper limit or not.
It measures the number of times, on average; the inventory is sold during the period. Its
purpose is to measure the liquidity of the inventory.
Inventory Turnover = Cost of Goods Sold
Average inventory
= 198,447,565
129,229,093 + 99,432,385
2
11. = 198,447,565
228,661,481
= 0.86
3.4 HOLDING PERIOD
HOLDING PERIOD = 365
Inventory Turnover
= 365
0.86
=424 days
Always industry holding period average is 50days. This situation is bad that’s why Galadari
Hotels PLC.
3.5 ASSET TURNOVER RATIO
Asset Turnover Ratio measures the revenue that is generated for every rupee of
asset owned by the company.
Asset turnover ratios help to measure the effectiveness with which the
company/management uses its assets to generate sales or revenue. These ratios help
to measure the productivity of a company's assets
Asset Turnover = Total Sales
Average total Assets
= 1,026,180,900
453,771,761 + 239,416,915
2
= = 1,026,180,900
693,188,676/2
= 1,026,180,900
346,594,338
= 2.96
12. 4. MARKET RATIOS
Market ratios measure the investor response to owning a company's stock and also the cost
of issuing stock.
A market-value ratio is a metric used to gauge a company's viability in terms of such
variables as profitability and the market valuation of its stock. These ratios are used
analytically by a company's management as well as by its current and prospective investors.
A market-value ratio also acts as an indicator that expresses the value of a company's stock in
terms of a specific item in its financial statements. Different ratios indicate a company's
viability, or financial health, where asset values, revenue, income, and ability to pay bills are
concerned.
Classifications of Market ratios
4.1 EARNINGS PER SHARE
Earnings per share (EPS) the portion of a company's profit allocated to each
outstanding share of common stock. Earnings per share serve as an indicator of a
company's profitability.
Basic Earnings per share is calculated by dividing the net loss for the year attributable
to ordinary shareholders by the weighted average number of ordinary shares
outstanding during the year.
The weighted average number of ordinary shares outstanding during the year and
previous year are adjusted for events that have change the number of ordinary shares
outstanding, without a corresponding change in the resources such as a bonus issue.
Formula
EPS = Net Profit after Tax
Average Number of issued ordinary shares
Calculation and Interpretation of Earnings per share Ratios
Market Ratios
Earnings per share
Ratios Dividends Payout
Ratios
Price Earnings Ratios
13. Financial Data/ Year 2010 2009
Profit/Loss after Tax 23,651,446 -351,985,121
Average Number of issued ordinary shares 182,434,060 182,433,060
EPS 0.13 (1.93)
Earnings per share ratio signify the amount of earnings available for the investors who have
been invested or willing to invest in equity shares of the company. This ratio gives the
amount of earnings can be attribute to a single share of the company.
4.2 PRICE EARNINGS RATIO
The Price-to-Earnings ratio (P/E ratio) of a stock is a measure of the price paid for
a share relative to the annual net income or profit earned by the firm per share.
(P/E) ratio indicates the value of a company's stock relative to its financial
performance.
It is sometimes called a multiple because it indicates the amount of money that must
be invested in order to derive one dollar of earnings. For this reason, lower ratios are
preferred to higher ones.
Formula
Price Earnings Ratio = Market Price per Share
Earnings per Share
Calculation and Interpretation of Price Earnings Ratios for three companies
Financial Data/ Year 2010 2009
Market Value per share (Rs.) 10 15
EPS(Rs.) 0.13 (1.93)
P/E Ratio 76.92 -7.7
The calculated P/E Ratio reflects that the Galadari Hotels PLC. Earings in positive after 4
years as Rs. 76.92/- . Due to the face that Galadary having after tax loss it has resulted with
an negative EPS in 2009.
A higher P/E ratio means that investors are paying more for each unit of net income, so the
stock is more expensive compared to one with lower P/E ratio. The P/E ratio has units of
years which can be interpreted as "number of years of earnings to pay back purchase price. If
we consider the number of years to pay up the purchase value of the share by its earnings,
hypothetically for an investors of Galadari hotels Plc it takes 76.92 if the company continues
to earn current level of profits.
14. 5. PERFORMANCE OVERVIEW OF GALADARI HOTELS (LANKA) PLC.:
During the financial year ended December 2010, the Group achieved revenues of Rs. 1026
million. The turnover for the year under review was Rs. 1,026,180,900/- while the Gross
Profit was Rs. 827,733,335/-, resulting in a 41% increase in the turnover and 43% increase in
the Gross Profit Comparison with year 2009.
Stated Capital Rs. 1.8 billion
Market value per share is Rs. 15.00
Earnings per share is Rs. (0.13)
Share Capital as at 31st
December 2010 –Rs. 1,527,844/-
The reconstruction of the Hotel continued throughout the year 2010.
6. CONCLUSION
The various ratios that have been identified in determining a financial situation can be
categorized in to Galadari Hotels PLC. Elements i.e. Profitability Ratio, Liquidity ratio,
Solvency ratio, Activity and Market ratio. As described in the introduction each of these
ratios play a specific function with reference to the functionality and the status quo of an
organization.
In the case of the specific exercise, the hotel industry has been selected and the annual report
of the Galadari Hotel PLC has been analyzed. The profiles of the companies have been
shown in the introduction and the annual reports have been annexed.
Profitability ratio: Every firm is most concerned with its profitability. One of the most
frequently used tools of financial ratio analysis is profitability ratios which are used to
determine the company's bottom-line.
The profitability ratios are then categorized in to several other ratios: Gross profit, Net profit,
return on asset, return on equity and return on capital employed.
The importance of these ratios is that to an investor the ratios give information on the general
direction of the identified company. The investor can then decide whether to hold, buy or sell
his or her shares. Also based on the ratios the investor can identify if a company has over
borrowed or if the company can meet its short term liquidity issues. The shareholders know
whether the on track as expected are entitled to dividend.
Hence when considering the profitability ratio, the most profitable entity is in 2010 than 2009
in Galadari Hotels PLC. Hence the company represents comparatively sound ratios.
15. REFERENCE
GALADARI HOTELS (LANKA) PLC. Annual Report year of 2010
www.cse.lk/cmt/upload_report_file/532_1274867640886.pdf
www.cse.lk/cmt/upload_report_file/690_1275657128533.pdf