Downloaded 151 times


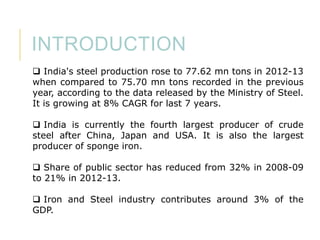

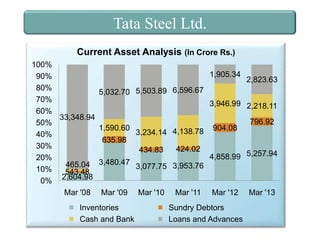
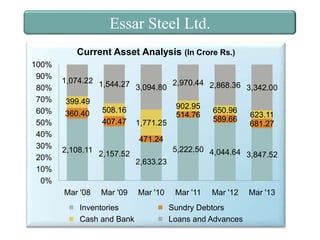
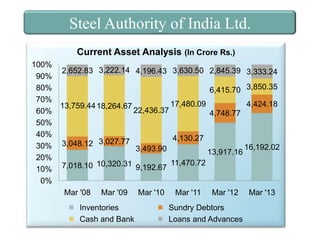
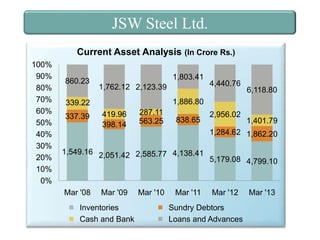

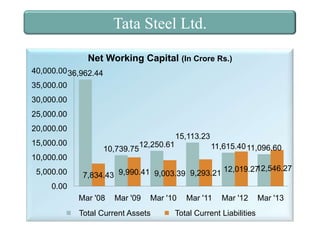
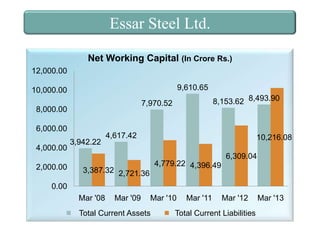
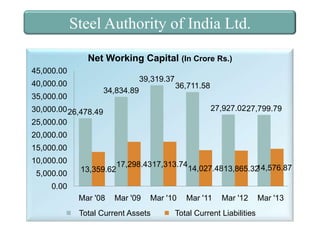
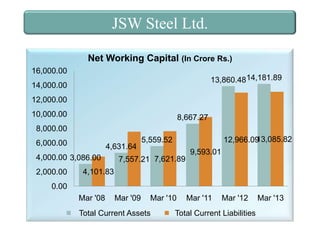

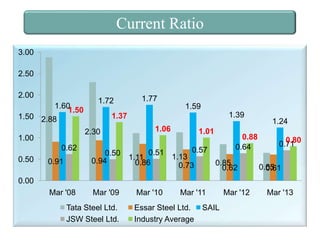
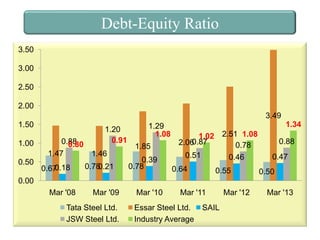
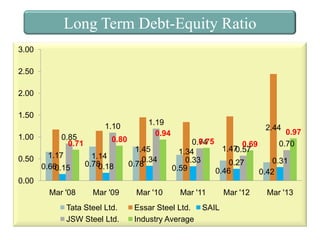
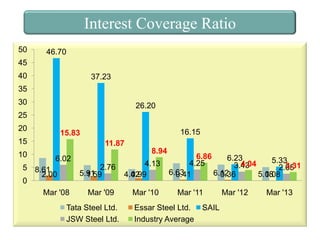

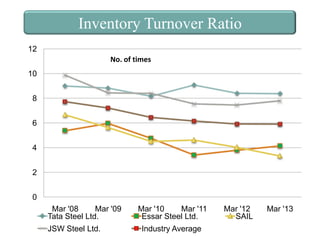
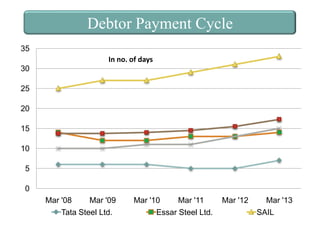
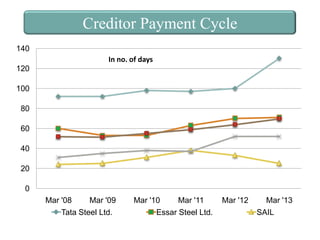
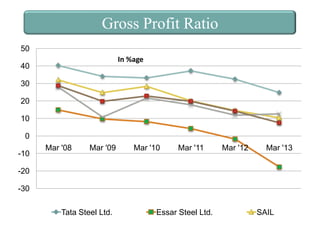

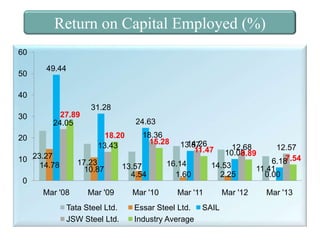
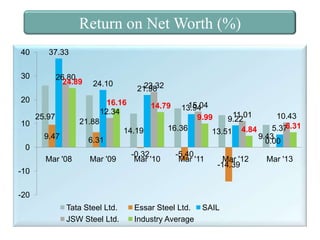
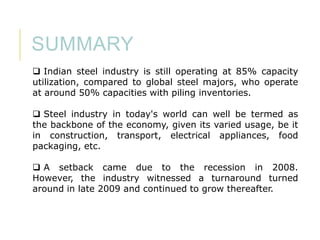
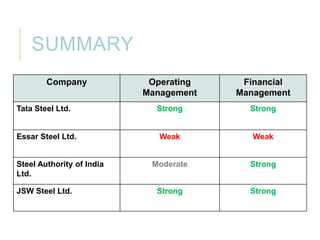


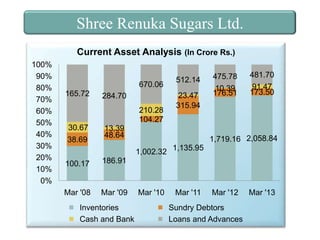
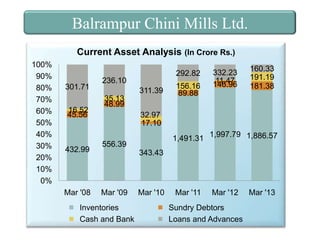
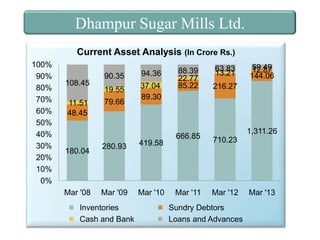
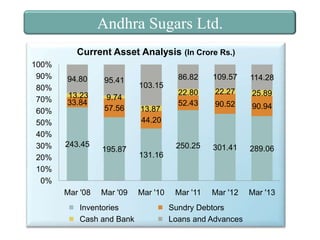
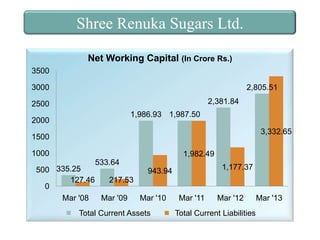
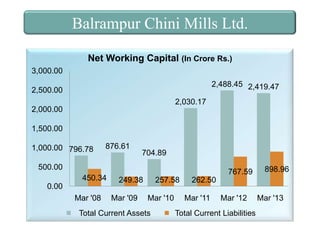
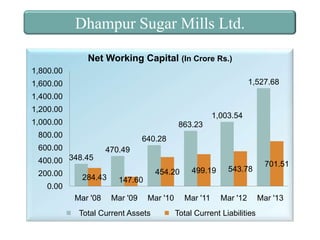
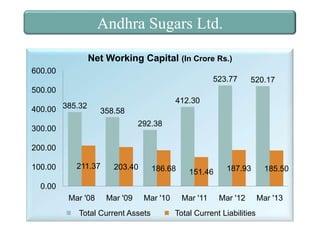

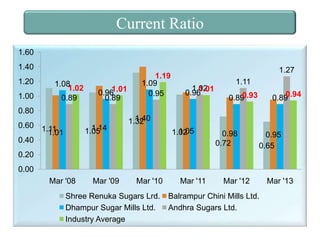
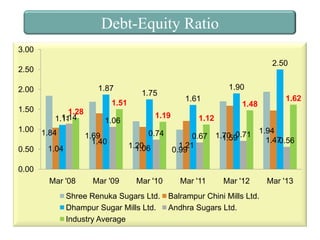
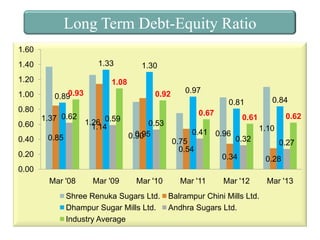
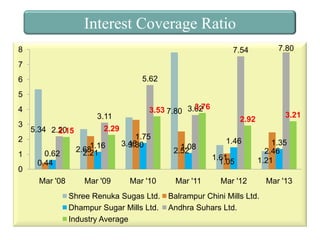

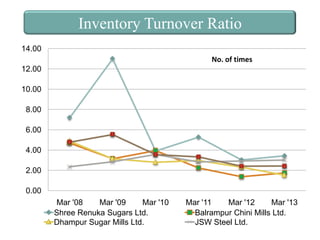
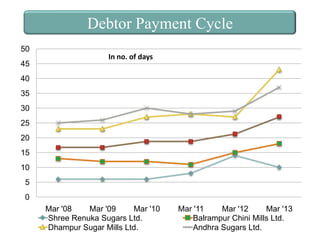
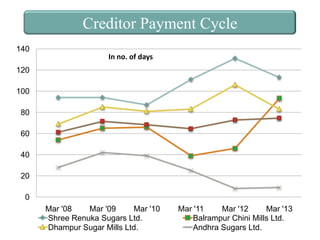
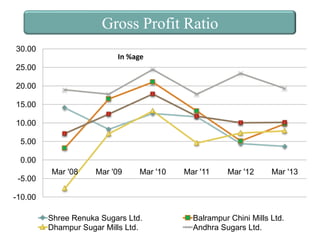

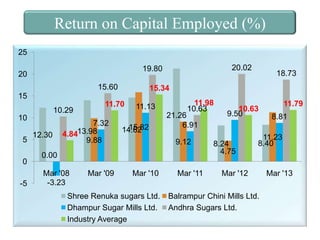
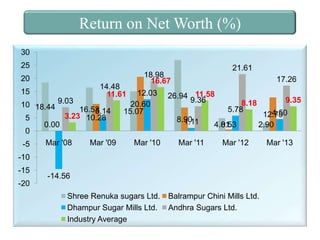
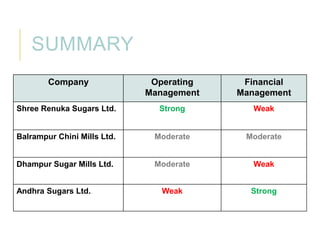

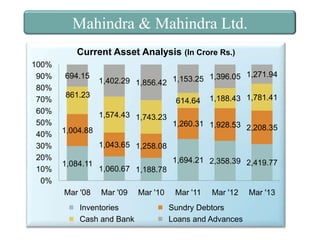


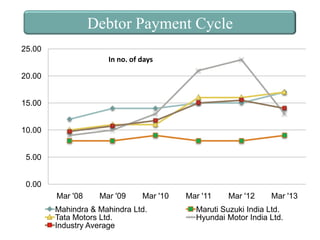
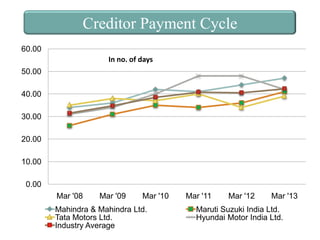
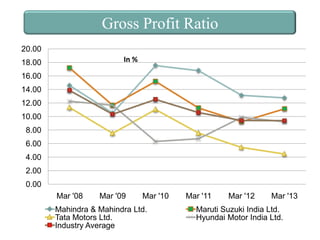
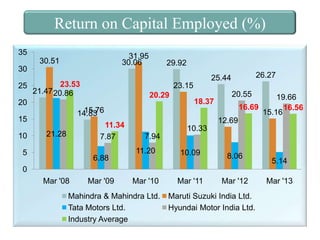
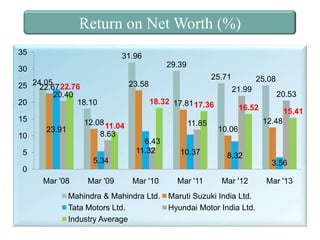
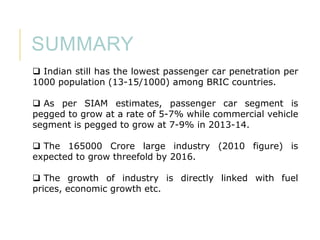
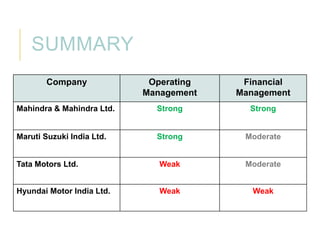


The document provides an analysis of the working capital management of companies in the Indian steel and sugar industries. It includes sections on current assets analysis, net working capital analysis, financial performance ratios, operating management ratios, and overall performance for Tata Steel, Essar Steel, SAIL, JSW Steel, Shree Renuka Sugars, Balrampur Chini Mills, Dhampur Sugar Mills, and Andhra Sugars. Graphs and tables of financial data from 2008 to 2013 are presented for analysis. The document suggests that while the steel industry saw growth after a recession in 2008, it is still operating below global capacity utilization.


