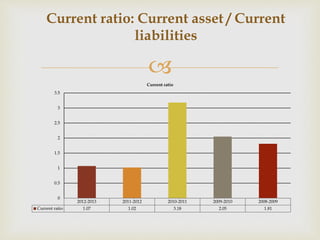
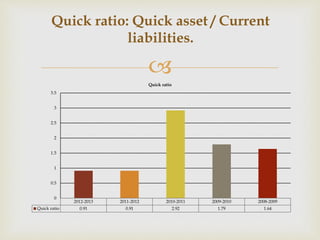
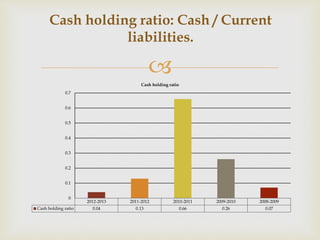
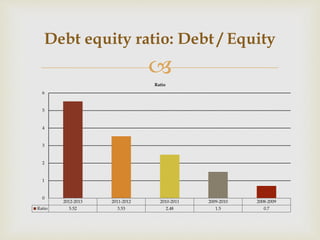
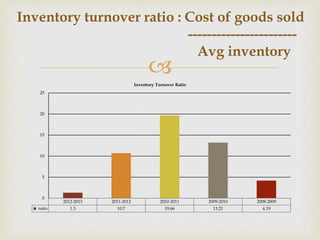
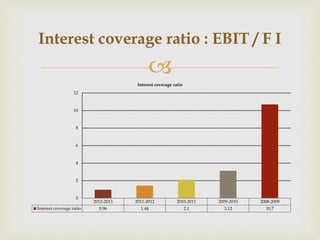
A STUDY ON 
WORKING CAPITAL MANAGEMENT
Company profile 
 
 Incorporated in June 12 2000 
 HQ in Chennai 
 other offices in Mumbai, New Delhi, Kolkata and Beijing 
 categorized into two segments engineering, procurement and 
construction ('EPC') projects and development, sale and 
maintenance of WTGs 
 WTG & Cooling tower factories in Pondicherry, Chennai and 
Umbergaon (Gujarat). 
 Joint Venture Partners with Leitwind
 
MUNICIPAL 
SERVICES 
PROCESS AND 
METALLURGY 
POWER 
PLANTS 
MINERAL 
PROCESSING
A study on WORKING CAPITAL 
MANAGEMENT 
 
 Objective 
 Limitations 
 Data sources 
 Concept of WC 
- Gross Working capital 
- Net Working capital 
 The need of Working capital management
Financial analysis 
 
 Tools are , 
1. Ratio analysis 
2. Trend analysis 
3. Fund flow analysis 
 Classification of Ratio analysis, 
1. Balance sheet ratio 
2. Revenue Statement ratio 
3. Mixed Ratio
Current ratio: Current asset / Current 
liabilities 
 
Current ratio 
2012-2013 2011-2012 2010-2011 2009-2010 2008-2009 
3.5 
3 
2.5 
2 
1.5 
1 
0.5 
0 
Current ratio 1.07 1.02 3.18 2.05 1.81
Quick ratio: Quick asset / Current 
liabilities. 
 
Quick ratio 
2012-2013 2011-2012 2010-2011 2009-2010 2008-2009 
3.5 
3 
2.5 
2 
1.5 
1 
0.5 
0 
Quick ratio 0.91 0.91 2.92 1.79 1.64
Cash holding ratio: Cash / Current 
liabilities. 
 
Cash holding ratio 
2012-2013 2011-2012 2010-2011 2009-2010 2008-2009 
0.7 
0.6 
0.5 
0.4 
0.3 
0.2 
0.1 
0 
Cash holding ratio 0.04 0.13 0.66 0.26 0.07
Debt equity ratio: Debt / Equity 
 
Ratio 
2012-2013 2011-2012 2010-2011 2009-2010 2008-2009 
6 
5 
4 
3 
2 
1 
0 
Ratio 5.52 3.53 2.48 1.5 0.7
Inventory turnover ratio : Cost of goods sold 
 
Inventory Turnover Ratio 
----------------------- 
Avg inventory 
2012-2013 2011-2012 2010-2011 2009-2010 2008-2009 
25 
20 
15 
10 
5 
0 
ratio 1.3 10.7 19.66 13.21 4.19
Working capital turnover ratio: 
Sales 
------------------------- 
Net working capital 
 
Net working capital ratio 
2012-2013 2011-2012 2010-2011 2009-2010 2008-2009 
4 
3.5 
3 
2.5 
2 
1.5 
1 
0.5 
0 
Net working capital ratio 3.464655085 2.825140521 0.988901715 1.531023778 2.408260004
Fixed asset turnover ratio: 
Fixed assets 
--------------------- 
Shareholder’s  
fund 
Fixed asset turnover ratio 
2012-2013 2011-2012 2010-2011 2009-2010 2008-2009 
4 
3.5 
3 
2.5 
2 
1.5 
1 
0.5 
0 
Fixed asset turnover ratio 1.66 2.24 2.78 3.36 2.8
Net profit ratio : 
Net profit after tax x 100 
Sales 
 
Net Profit Ratio 
2012-2013 2011-2012 2010-2011 2009-2010 2008-2009 
10% 
5% 
0% 
-5% 
-10% 
-15% 
-20% 
Ratio -15% 2% 5% 4% 4%
Return on equity: 
Net income / Share holder’s equity 
 
ROE 
2012-2013 2011-2012 2010-2011 2009-2010 2008-2009 
40% 
20% 
0% 
-20% 
-40% 
-60% 
-80% 
-100% 
-120% 
ROE -107% 5.02% 14.26% 10.59% 10.55%
Interest coverage ratio : EBIT / F I 
 
Interest coverage ratio 
2012-2013 2011-2012 2010-2011 2009-2010 2008-2009 
12 
10 
8 
6 
4 
2 
0 
Interest coverage ratio 0.96 1.44 2.1 3.12 10.7
 
 company has some liquidity problem. 
 The company’s interest coverage ratio is below the ideal ratio, 
this was due to increase in debts. 
 A quick ratio is an indication that the firm is liquid and has the 
ability to meet its current liabilities in time 
 Cash holding ratio ratio shows that company carries only small 
amount of cash. 
FINDINGs
FINDINGs 
 
 the inventory turnover ratio has come down because the 
company has spent less in the purchases when compared 
with the previous year. 
 The funds are not sufficient to finance the fixed assets & 
the firm has to depends upon outside to finance fixed 
assets.


Working capit

  • 1.
    A STUDY ON WORKING CAPITAL MANAGEMENT
  • 2.
    Company profile   Incorporated in June 12 2000  HQ in Chennai  other offices in Mumbai, New Delhi, Kolkata and Beijing  categorized into two segments engineering, procurement and construction ('EPC') projects and development, sale and maintenance of WTGs  WTG & Cooling tower factories in Pondicherry, Chennai and Umbergaon (Gujarat).  Joint Venture Partners with Leitwind
  • 3.
     MUNICIPAL SERVICES PROCESS AND METALLURGY POWER PLANTS MINERAL PROCESSING
  • 4.
    A study onWORKING CAPITAL MANAGEMENT   Objective  Limitations  Data sources  Concept of WC - Gross Working capital - Net Working capital  The need of Working capital management
  • 5.
    Financial analysis   Tools are , 1. Ratio analysis 2. Trend analysis 3. Fund flow analysis  Classification of Ratio analysis, 1. Balance sheet ratio 2. Revenue Statement ratio 3. Mixed Ratio
  • 6.
    Current ratio: Currentasset / Current liabilities  Current ratio 2012-2013 2011-2012 2010-2011 2009-2010 2008-2009 3.5 3 2.5 2 1.5 1 0.5 0 Current ratio 1.07 1.02 3.18 2.05 1.81
  • 7.
    Quick ratio: Quickasset / Current liabilities.  Quick ratio 2012-2013 2011-2012 2010-2011 2009-2010 2008-2009 3.5 3 2.5 2 1.5 1 0.5 0 Quick ratio 0.91 0.91 2.92 1.79 1.64
  • 8.
    Cash holding ratio:Cash / Current liabilities.  Cash holding ratio 2012-2013 2011-2012 2010-2011 2009-2010 2008-2009 0.7 0.6 0.5 0.4 0.3 0.2 0.1 0 Cash holding ratio 0.04 0.13 0.66 0.26 0.07
  • 9.
    Debt equity ratio:Debt / Equity  Ratio 2012-2013 2011-2012 2010-2011 2009-2010 2008-2009 6 5 4 3 2 1 0 Ratio 5.52 3.53 2.48 1.5 0.7
  • 10.
    Inventory turnover ratio: Cost of goods sold  Inventory Turnover Ratio ----------------------- Avg inventory 2012-2013 2011-2012 2010-2011 2009-2010 2008-2009 25 20 15 10 5 0 ratio 1.3 10.7 19.66 13.21 4.19
  • 11.
    Working capital turnoverratio: Sales ------------------------- Net working capital  Net working capital ratio 2012-2013 2011-2012 2010-2011 2009-2010 2008-2009 4 3.5 3 2.5 2 1.5 1 0.5 0 Net working capital ratio 3.464655085 2.825140521 0.988901715 1.531023778 2.408260004
  • 12.
    Fixed asset turnoverratio: Fixed assets --------------------- Shareholder’s  fund Fixed asset turnover ratio 2012-2013 2011-2012 2010-2011 2009-2010 2008-2009 4 3.5 3 2.5 2 1.5 1 0.5 0 Fixed asset turnover ratio 1.66 2.24 2.78 3.36 2.8
  • 13.
    Net profit ratio: Net profit after tax x 100 Sales  Net Profit Ratio 2012-2013 2011-2012 2010-2011 2009-2010 2008-2009 10% 5% 0% -5% -10% -15% -20% Ratio -15% 2% 5% 4% 4%
  • 14.
    Return on equity: Net income / Share holder’s equity  ROE 2012-2013 2011-2012 2010-2011 2009-2010 2008-2009 40% 20% 0% -20% -40% -60% -80% -100% -120% ROE -107% 5.02% 14.26% 10.59% 10.55%
  • 15.
    Interest coverage ratio: EBIT / F I  Interest coverage ratio 2012-2013 2011-2012 2010-2011 2009-2010 2008-2009 12 10 8 6 4 2 0 Interest coverage ratio 0.96 1.44 2.1 3.12 10.7
  • 16.
      companyhas some liquidity problem.  The company’s interest coverage ratio is below the ideal ratio, this was due to increase in debts.  A quick ratio is an indication that the firm is liquid and has the ability to meet its current liabilities in time  Cash holding ratio ratio shows that company carries only small amount of cash. FINDINGs
  • 17.
    FINDINGs  the inventory turnover ratio has come down because the company has spent less in the purchases when compared with the previous year.  The funds are not sufficient to finance the fixed assets & the firm has to depends upon outside to finance fixed assets.
  • 18.