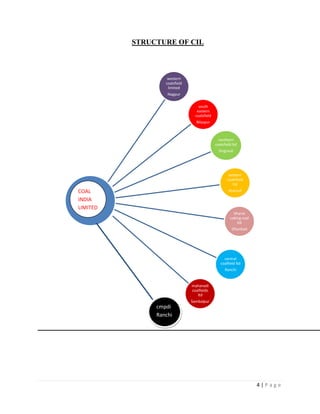
Central Coalfield Limited (CCL) is one of the eight subsidiaries of Coal India Limited, which is wholly owned by the Government of India. CCL operates 67 coal mines and 7 coal washing plants across Jharkhand. It is a major producer of coking coal used in steel production. CCL has shown profits in recent years and been awarded 'Mini Ratna' status for its efficient operations. It has played a key role in the socio-economic development of Jharkhand through mining, employment, and infrastructure development.


![Quarterly Quantity (QQ)
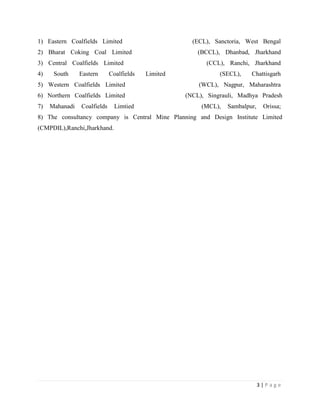
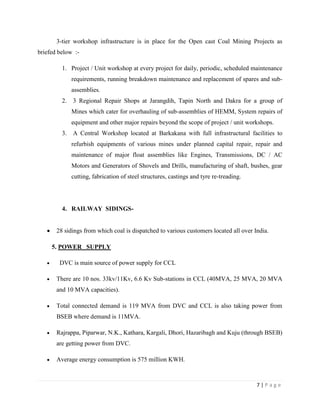
The Annual Contracted Quantities for the Year shall be divided into
Quarterly Quantities (QQ), expressed in tonnes, as follows:
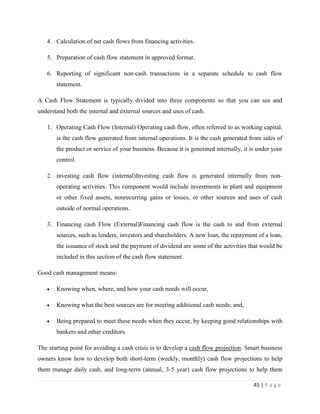
Ist Quarter (Apr-Jun.) 25% of ACQ
IInd Quarter (Jul-Sep) 22% of ACQ
IIIrd Quarter (Oct-Dec) 25% of ACQ
IVth Quarter (Jan-Mar) 28% of ACQ
The Purchaser shall maintain with the Seller an Irrevocable Revolving Letter of
Credit (IRLC) issued by a bank acceptable to the Seller and in the format
acceptable to the Seller and fully conforming to the conditions for an amount
equivalent to As Delivered Price of Coal for the Coal quantities that is one-ninth (1/9th)
of the QQ concerned. The As Delivered Price of Coal in this context shall take into
account the highest of Contract Prices of Grades. The IRLC shall be maintained
throughout the term of this Agreement. The amount of IRLC shall be suitably changed
whenever there is a change in any component of the As Delivered Price of Coal. In
addition to the IRLC, the Purchaser shall pay advance amount equivalent to seven (7)
days Coal value by way of Demand Draft/ Banker‟s cheque/ Electronic Fund
Transfer (EFT).
All the payments shall be made through Demand Draft / Banker‟s cheque/
Electronic Fund Transfer payable at ([•] to be stated by the Seller). In the event of
non-payment within the aforesaid stipulated period, the Purchaser shall be liable to
pay interest in accordance
Advance payment made by the Purchaser shall be non-interest bearing, and it
shall change in accordance with change in the As Delivered Price of Coal.
63 | P a g e](https://image.slidesharecdn.com/chanchalmain-120719053525-phpapp02/85/central-coalfeild-limited-63-320.jpg)