What is Wireshark?
• Wireshark is a network packet/protocol
analyzer.
– A network packet analyzer will try to capture
network packets and tries to display that packet
data as detailed as possible.
• Wireshark is perhaps one of the best open
source packet analyzers available today for
UNIX and Windows.
Some intended purposes
• network administrators use it to troubleshoot
network problems
• network security engineers use it to examine security
problems
• developers use it to debug protocol
implementations
• people use it to learn network protocol internals
• Wireshark isn't an intrusion detection system.
• Wireshark will not manipulate things on the network,
it will only "measure" things from it.
Wireshark
Wireshark, a network analysis tool formerly known
as Ethereal, captures packets in real time and display
them in human-readable format. Wireshark includes
filters, color-coding and other features that let you
dig deep into network traffic and inspect individual
packets.
Getting Started Wireshark
• Start Wireshark. Under the “Capture” header,
select the “Interface List” option; or click on the
“Interfaces” button on the toolbar:
• This will bring up a list of network interfaces that
Wireshark is able to capture packets from:
Select the network adapter (wired or wireless) that you are
currently using to connect to the Internet, and hit the “Start”
button. This will take you to the main window:
• Wireshark is now capturing live network activity
on your network interface. Notice that the list of
packets is color-coded to highlight different types
of network traffic.
• Open your web browser and navigate to a few
random web pages – observe that the network
packets corresponding to your web browsing
activity are captured and show up in Wireshark as
well.
Filtering the Packet List
• In the filter toolbar, type “http” and then click on “Apply”. The
window will now list only captured packets related to HTTP traffic:
Colour Coding
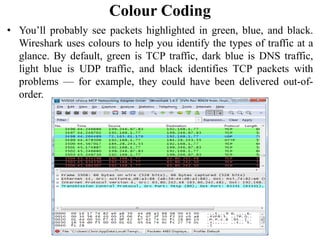
• You’ll probably see packets highlighted in green, blue, and black.
Wireshark uses colours to help you identify the types of traffic at a
glance. By default, green is TCP traffic, dark blue is DNS traffic,
light blue is UDP traffic, and black identifies TCP packets with
problems — for example, they could have been delivered out-of-
order.

Wireshark

  • 1.
    What is Wireshark? •Wireshark is a network packet/protocol analyzer. – A network packet analyzer will try to capture network packets and tries to display that packet data as detailed as possible. • Wireshark is perhaps one of the best open source packet analyzers available today for UNIX and Windows.
  • 2.
    Some intended purposes •network administrators use it to troubleshoot network problems • network security engineers use it to examine security problems • developers use it to debug protocol implementations • people use it to learn network protocol internals • Wireshark isn't an intrusion detection system. • Wireshark will not manipulate things on the network, it will only "measure" things from it.
  • 3.
    Wireshark Wireshark, a networkanalysis tool formerly known as Ethereal, captures packets in real time and display them in human-readable format. Wireshark includes filters, color-coding and other features that let you dig deep into network traffic and inspect individual packets.
  • 4.
    Getting Started Wireshark •Start Wireshark. Under the “Capture” header, select the “Interface List” option; or click on the “Interfaces” button on the toolbar: • This will bring up a list of network interfaces that Wireshark is able to capture packets from:
  • 6.
    Select the networkadapter (wired or wireless) that you are currently using to connect to the Internet, and hit the “Start” button. This will take you to the main window:
  • 7.
    • Wireshark isnow capturing live network activity on your network interface. Notice that the list of packets is color-coded to highlight different types of network traffic. • Open your web browser and navigate to a few random web pages – observe that the network packets corresponding to your web browsing activity are captured and show up in Wireshark as well.
  • 8.
    Filtering the PacketList • In the filter toolbar, type “http” and then click on “Apply”. The window will now list only captured packets related to HTTP traffic:
  • 9.
    Colour Coding • You’llprobably see packets highlighted in green, blue, and black. Wireshark uses colours to help you identify the types of traffic at a glance. By default, green is TCP traffic, dark blue is DNS traffic, light blue is UDP traffic, and black identifies TCP packets with problems — for example, they could have been delivered out-of- order.