Developing a web-based monitoring and evaluation system: Crop Goat Project in Tanzania
Thank you for the additional questions and responses. It provides helpful context and considerations around operationalizing the web-based monitoring and evaluation system.
Developing a web-based monitoring and evaluation system: Crop Goat Project in Tanzania
1.
“Developing a webbased monitoring
and evaluation system”
Crop Goat Project in Tanzania
PGI and RMG
Pamela Pali, Harrison Rware, Carlos Quiros, Titus Karanja, Joseph Gatheru Mugo, Nicholas
Ndiwa, Jane Poole
1
4th October 2012
2.
Integrating Dairy Goatsand Root
Crop Production for increasing Food,
Nutrition and Income Security of
Smallholder Farmers in Tanzania
Canadian International Food
Security Research Fund
3.
Background
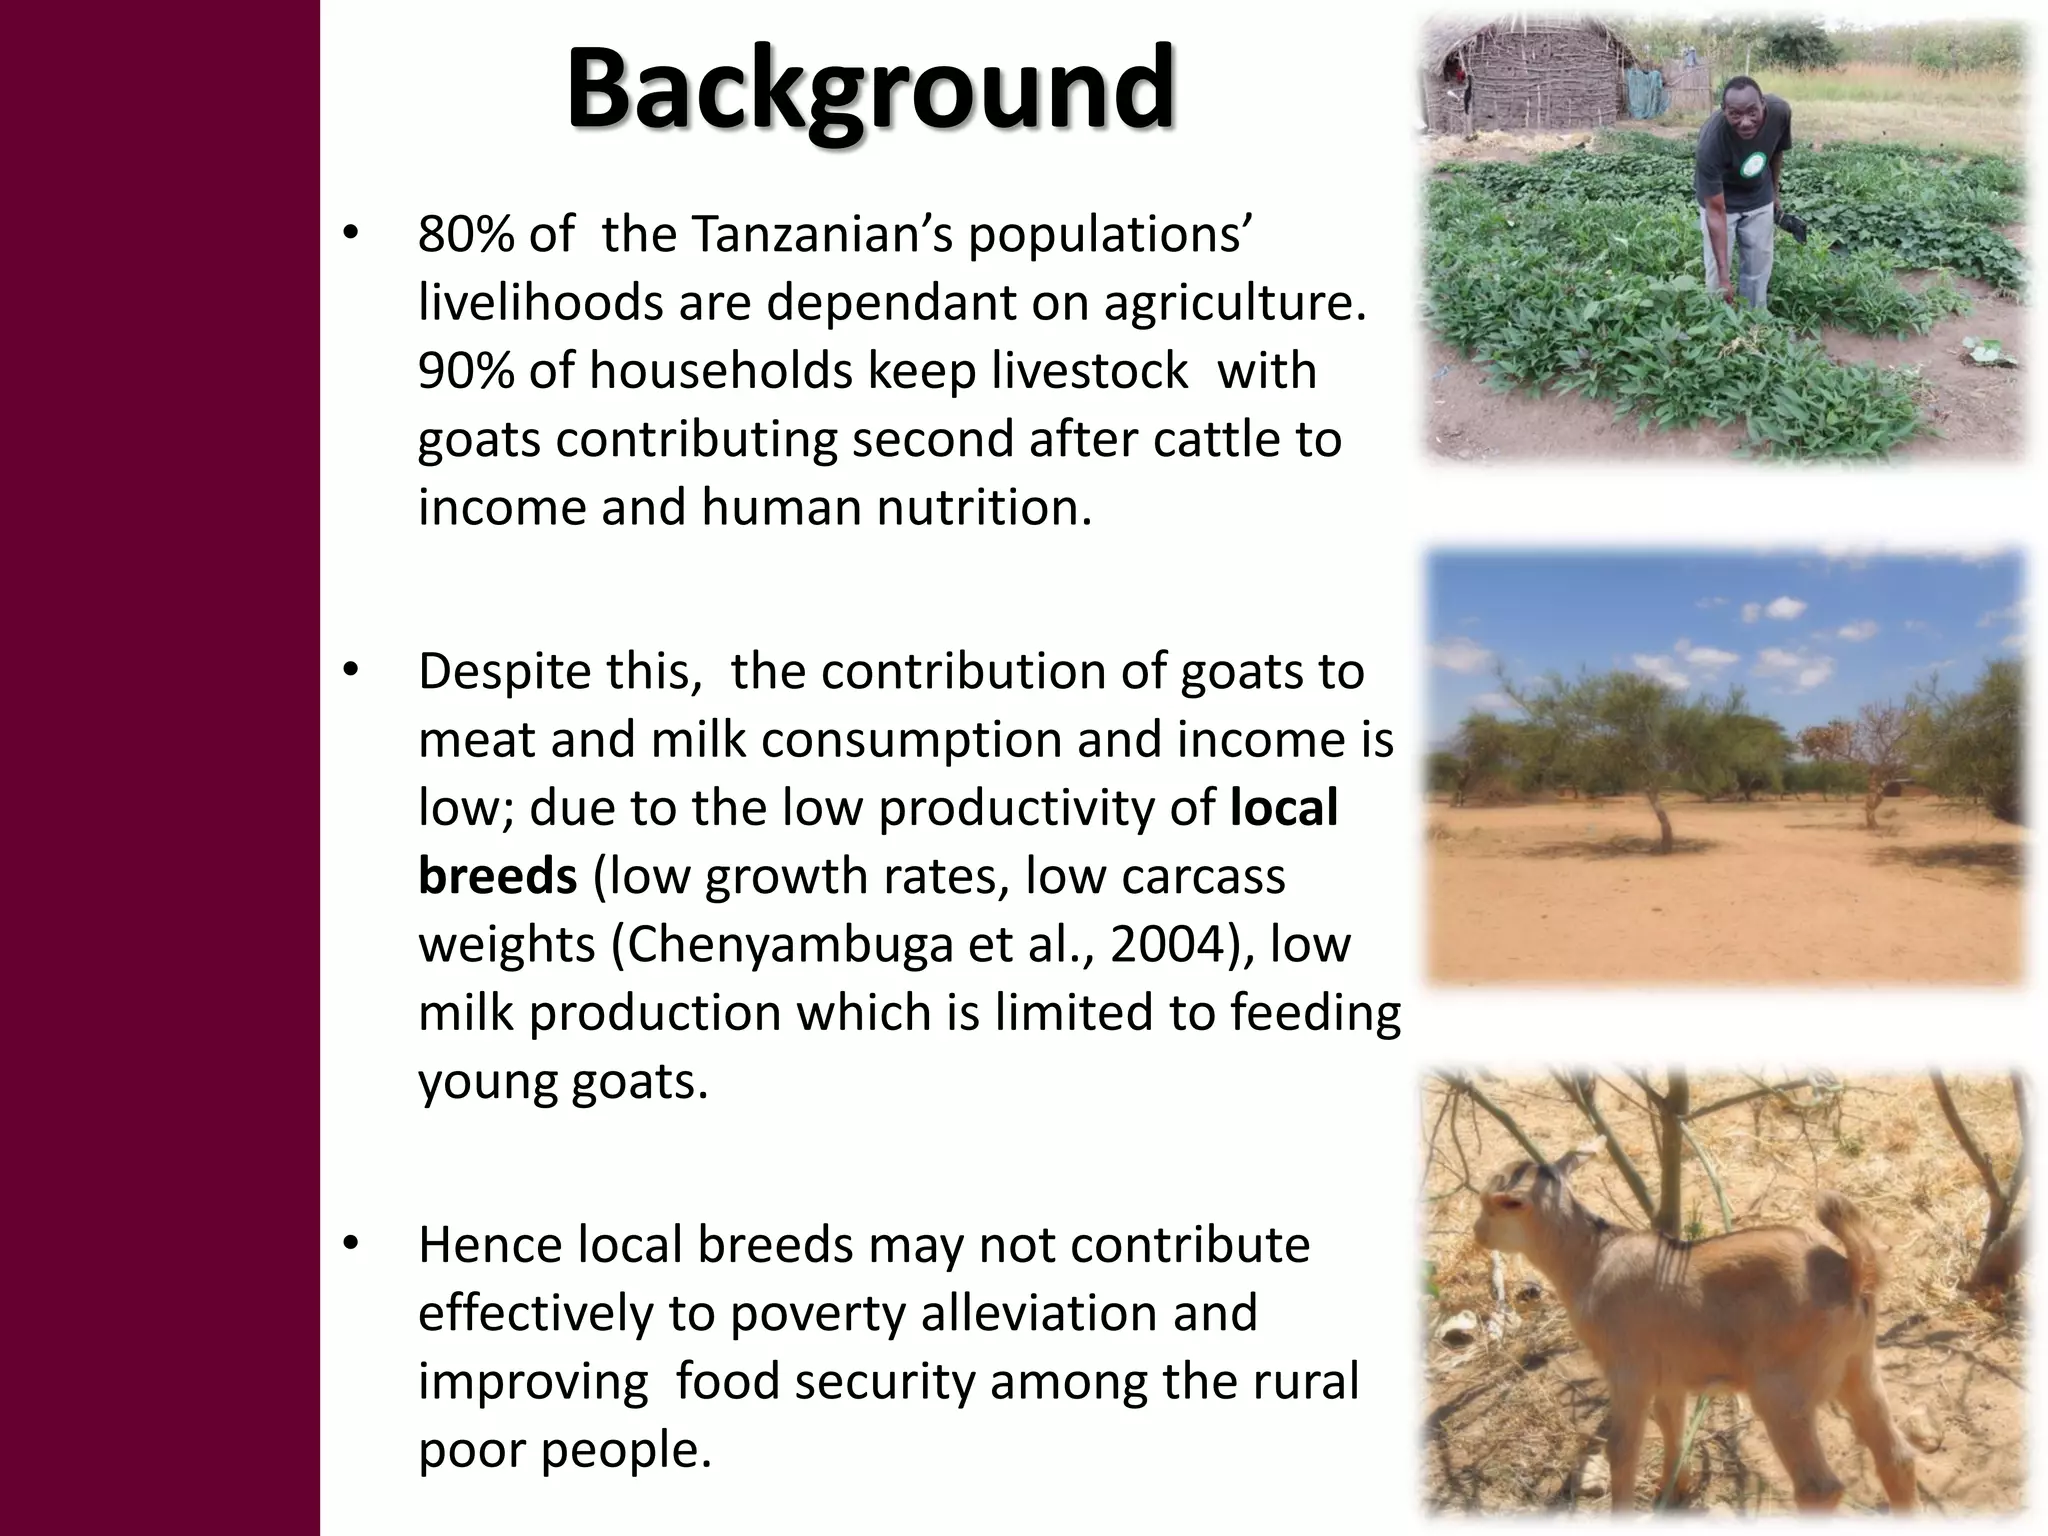
• 80% ofthe Tanzanian’s populations’
livelihoods are dependant on agriculture.
90% of households keep livestock with
goats contributing second after cattle to
income and human nutrition.
• Despite this, the contribution of goats to
meat and milk consumption and income is
low; due to the low productivity of local
breeds (low growth rates, low carcass
weights (Chenyambuga et al., 2004), low
milk production which is limited to feeding
young goats.
• Hence local breeds may not contribute
effectively to poverty alleviation and
improving food security among the rural
poor people.
4.
Background
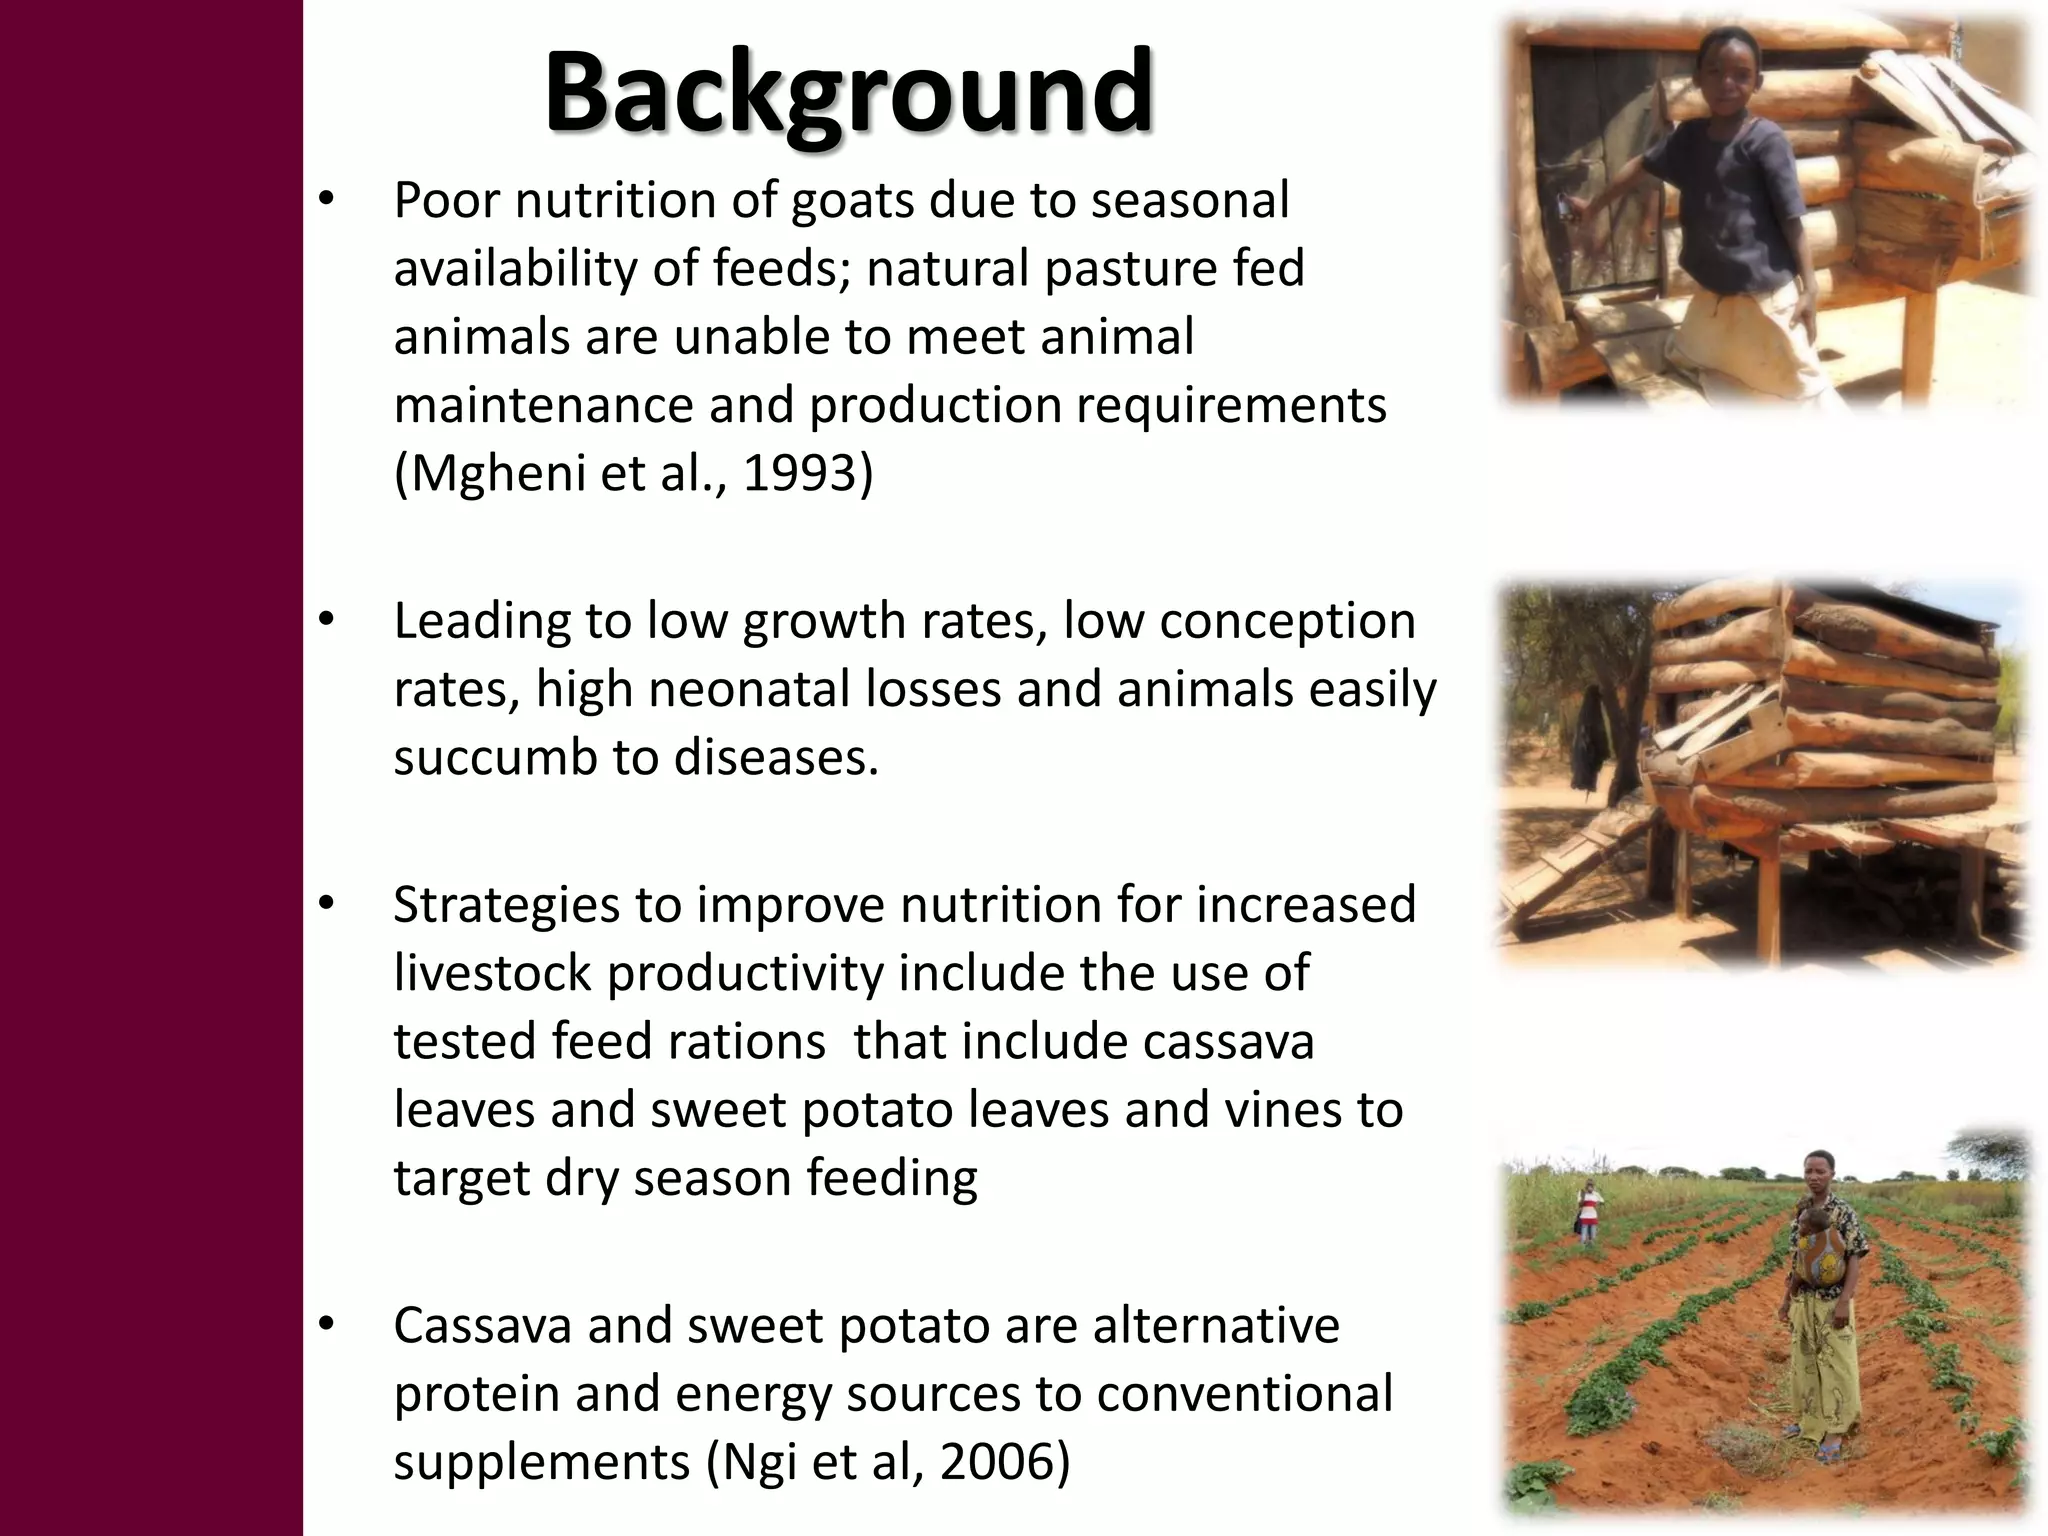
• Poor nutritionof goats due to seasonal
availability of feeds; natural pasture fed
animals are unable to meet animal
maintenance and production requirements
(Mgheni et al., 1993)
• Leading to low growth rates, low conception
rates, high neonatal losses and animals easily
succumb to diseases.
• Strategies to improve nutrition for increased
livestock productivity include the use of
tested feed rations that include cassava
leaves and sweet potato leaves and vines to
target dry season feeding
• Cassava and sweet potato are alternative
protein and energy sources to conventional
supplements (Ngi et al, 2006)
5.
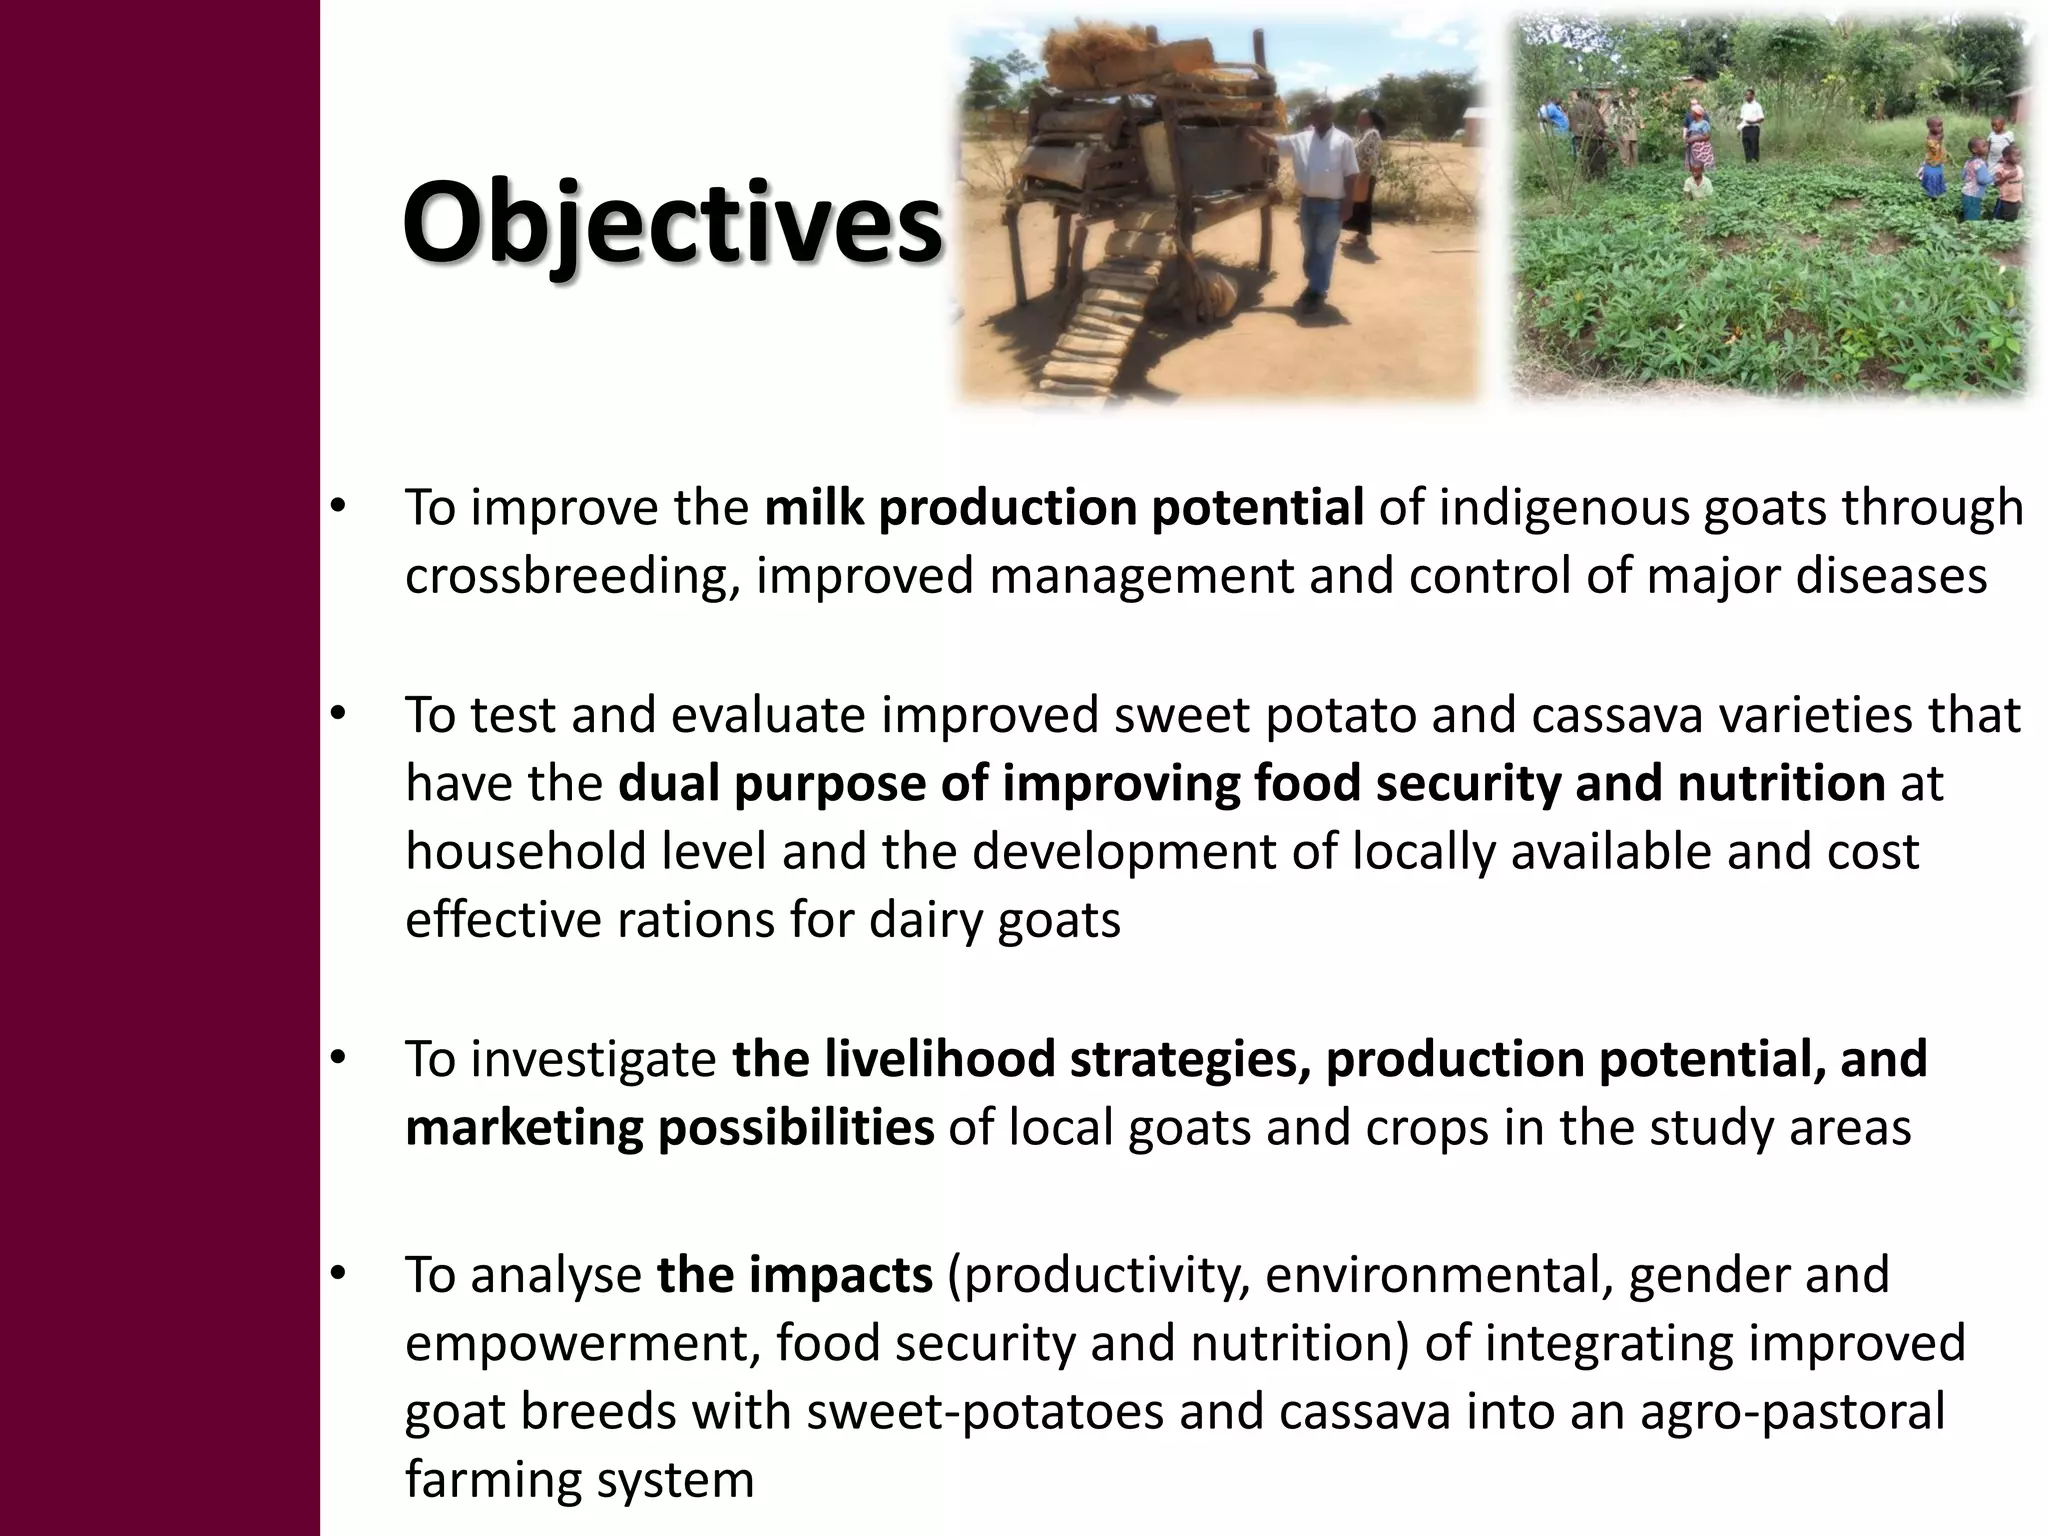
Objectives
• To improvethe milk production potential of indigenous goats through
crossbreeding, improved management and control of major diseases
• To test and evaluate improved sweet potato and cassava varieties that
have the dual purpose of improving food security and nutrition at
household level and the development of locally available and cost
effective rations for dairy goats
• To investigate the livelihood strategies, production potential, and
marketing possibilities of local goats and crops in the study areas
• To analyse the impacts (productivity, environmental, gender and
empowerment, food security and nutrition) of integrating improved
goat breeds with sweet-potatoes and cassava into an agro-pastoral
farming system
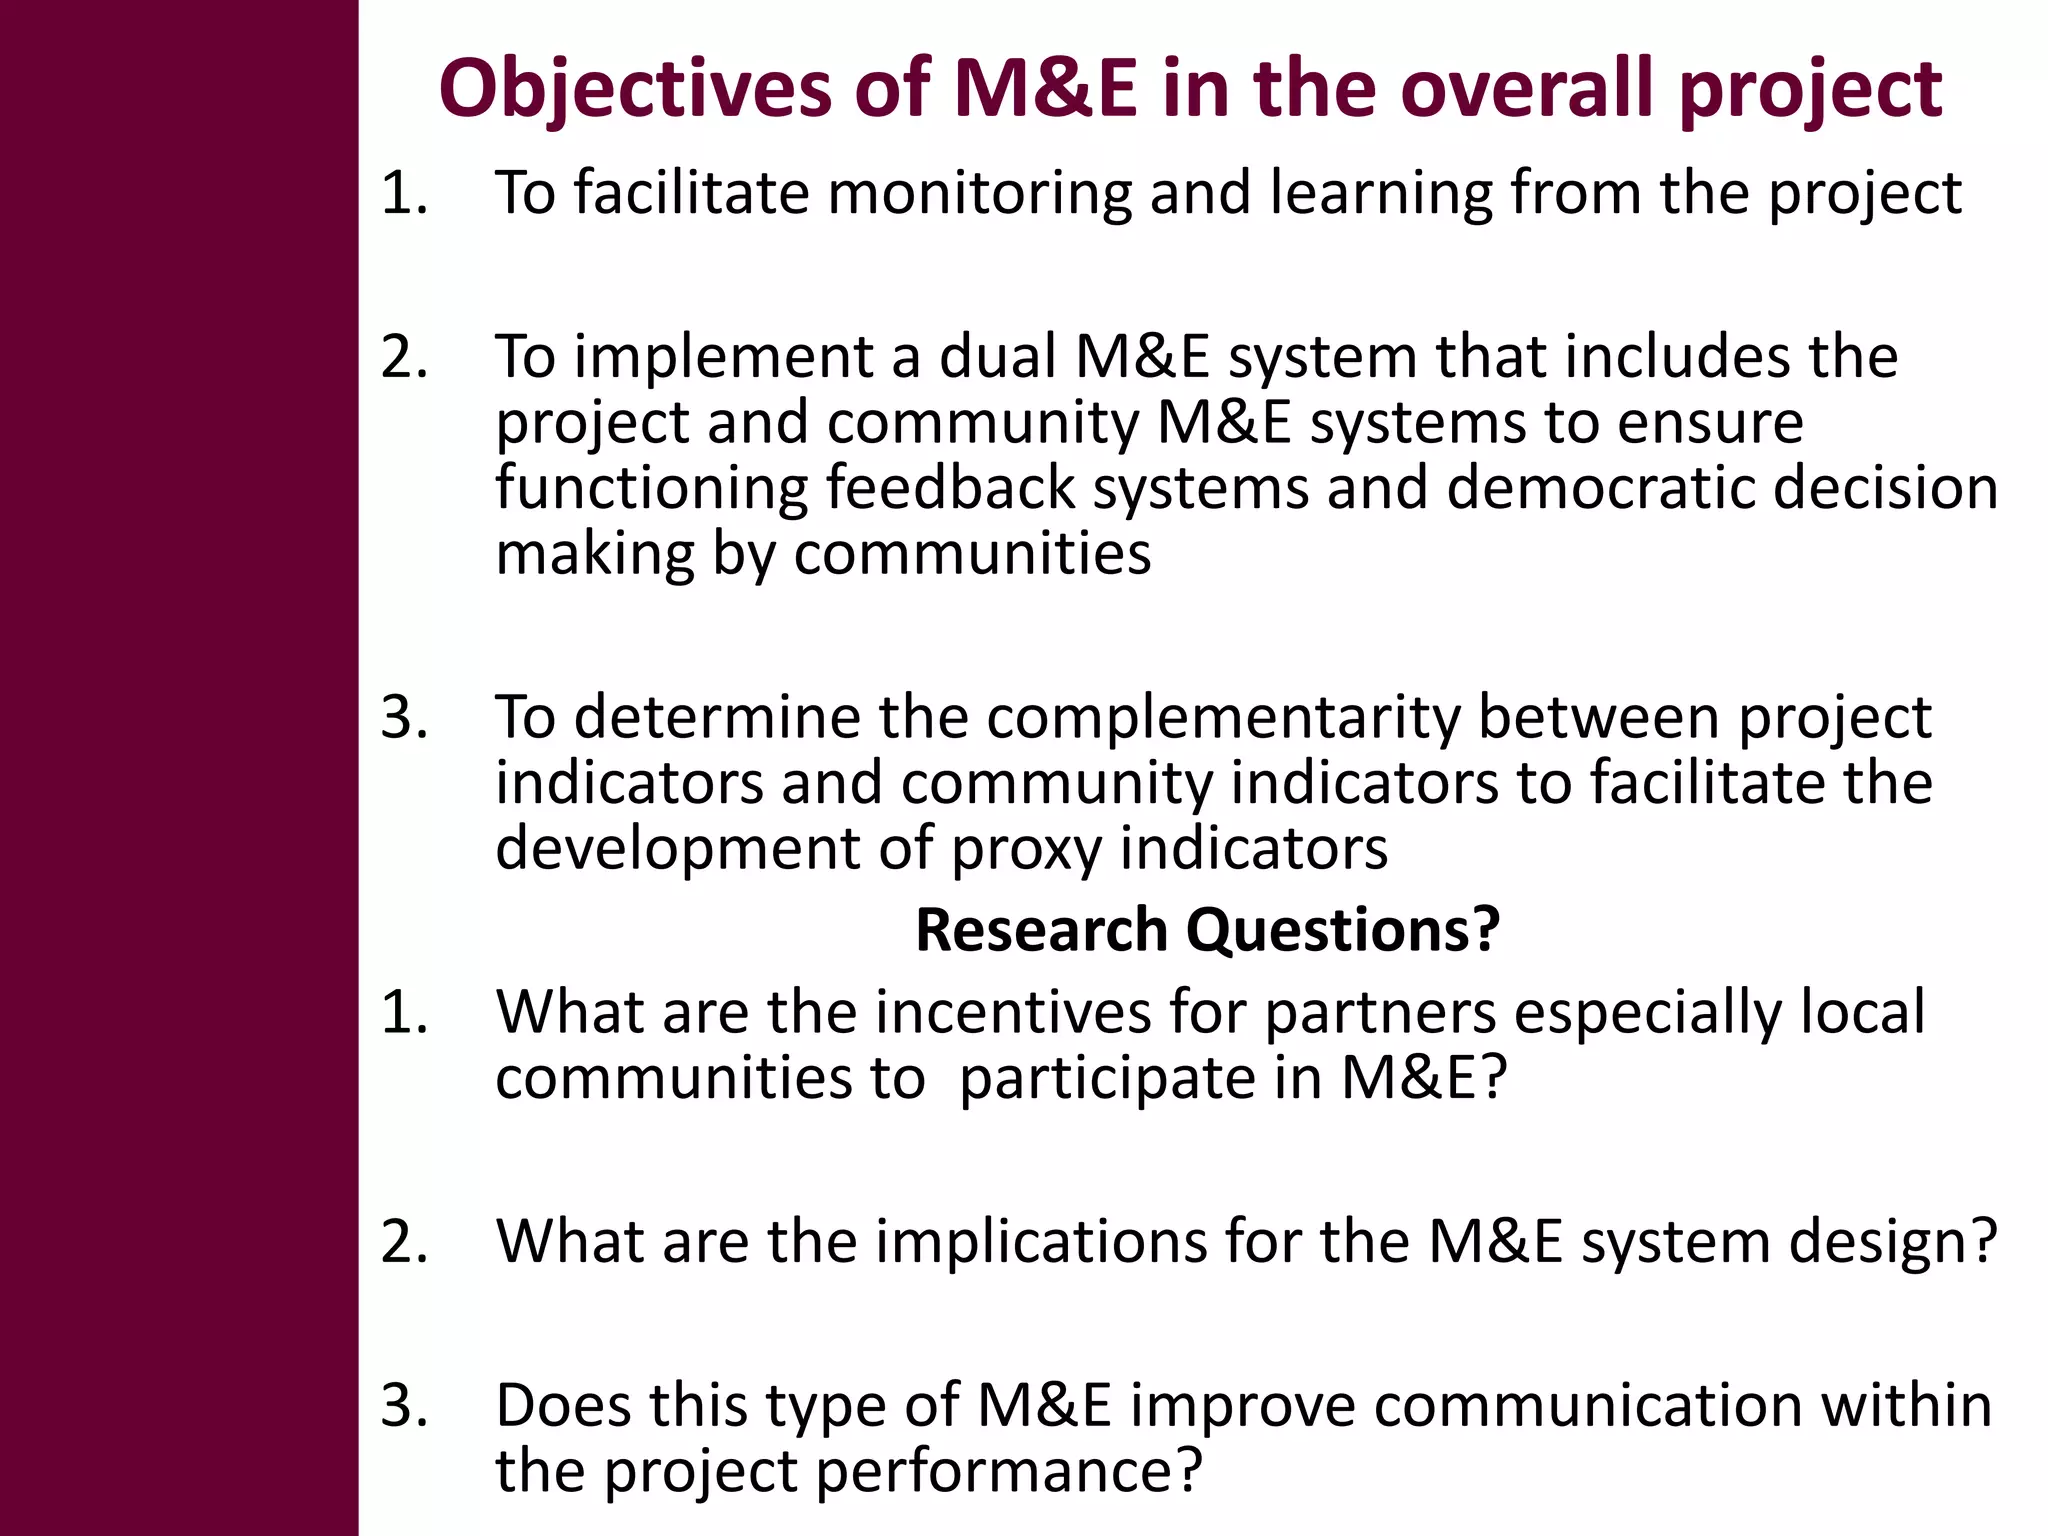
Objectives of M&Ein the overall project
1. To facilitate monitoring and learning from the project
2. To implement a dual M&E system that includes the
project and community M&E systems to ensure
functioning feedback systems and democratic decision
making by communities
3. To determine the complementarity between project
indicators and community indicators to facilitate the
development of proxy indicators
Research Questions?
1. What are the incentives for partners especially local
communities to participate in M&E?
2. What are the implications for the M&E system design?
3. Does this type of M&E improve communication within
the project performance?
8.
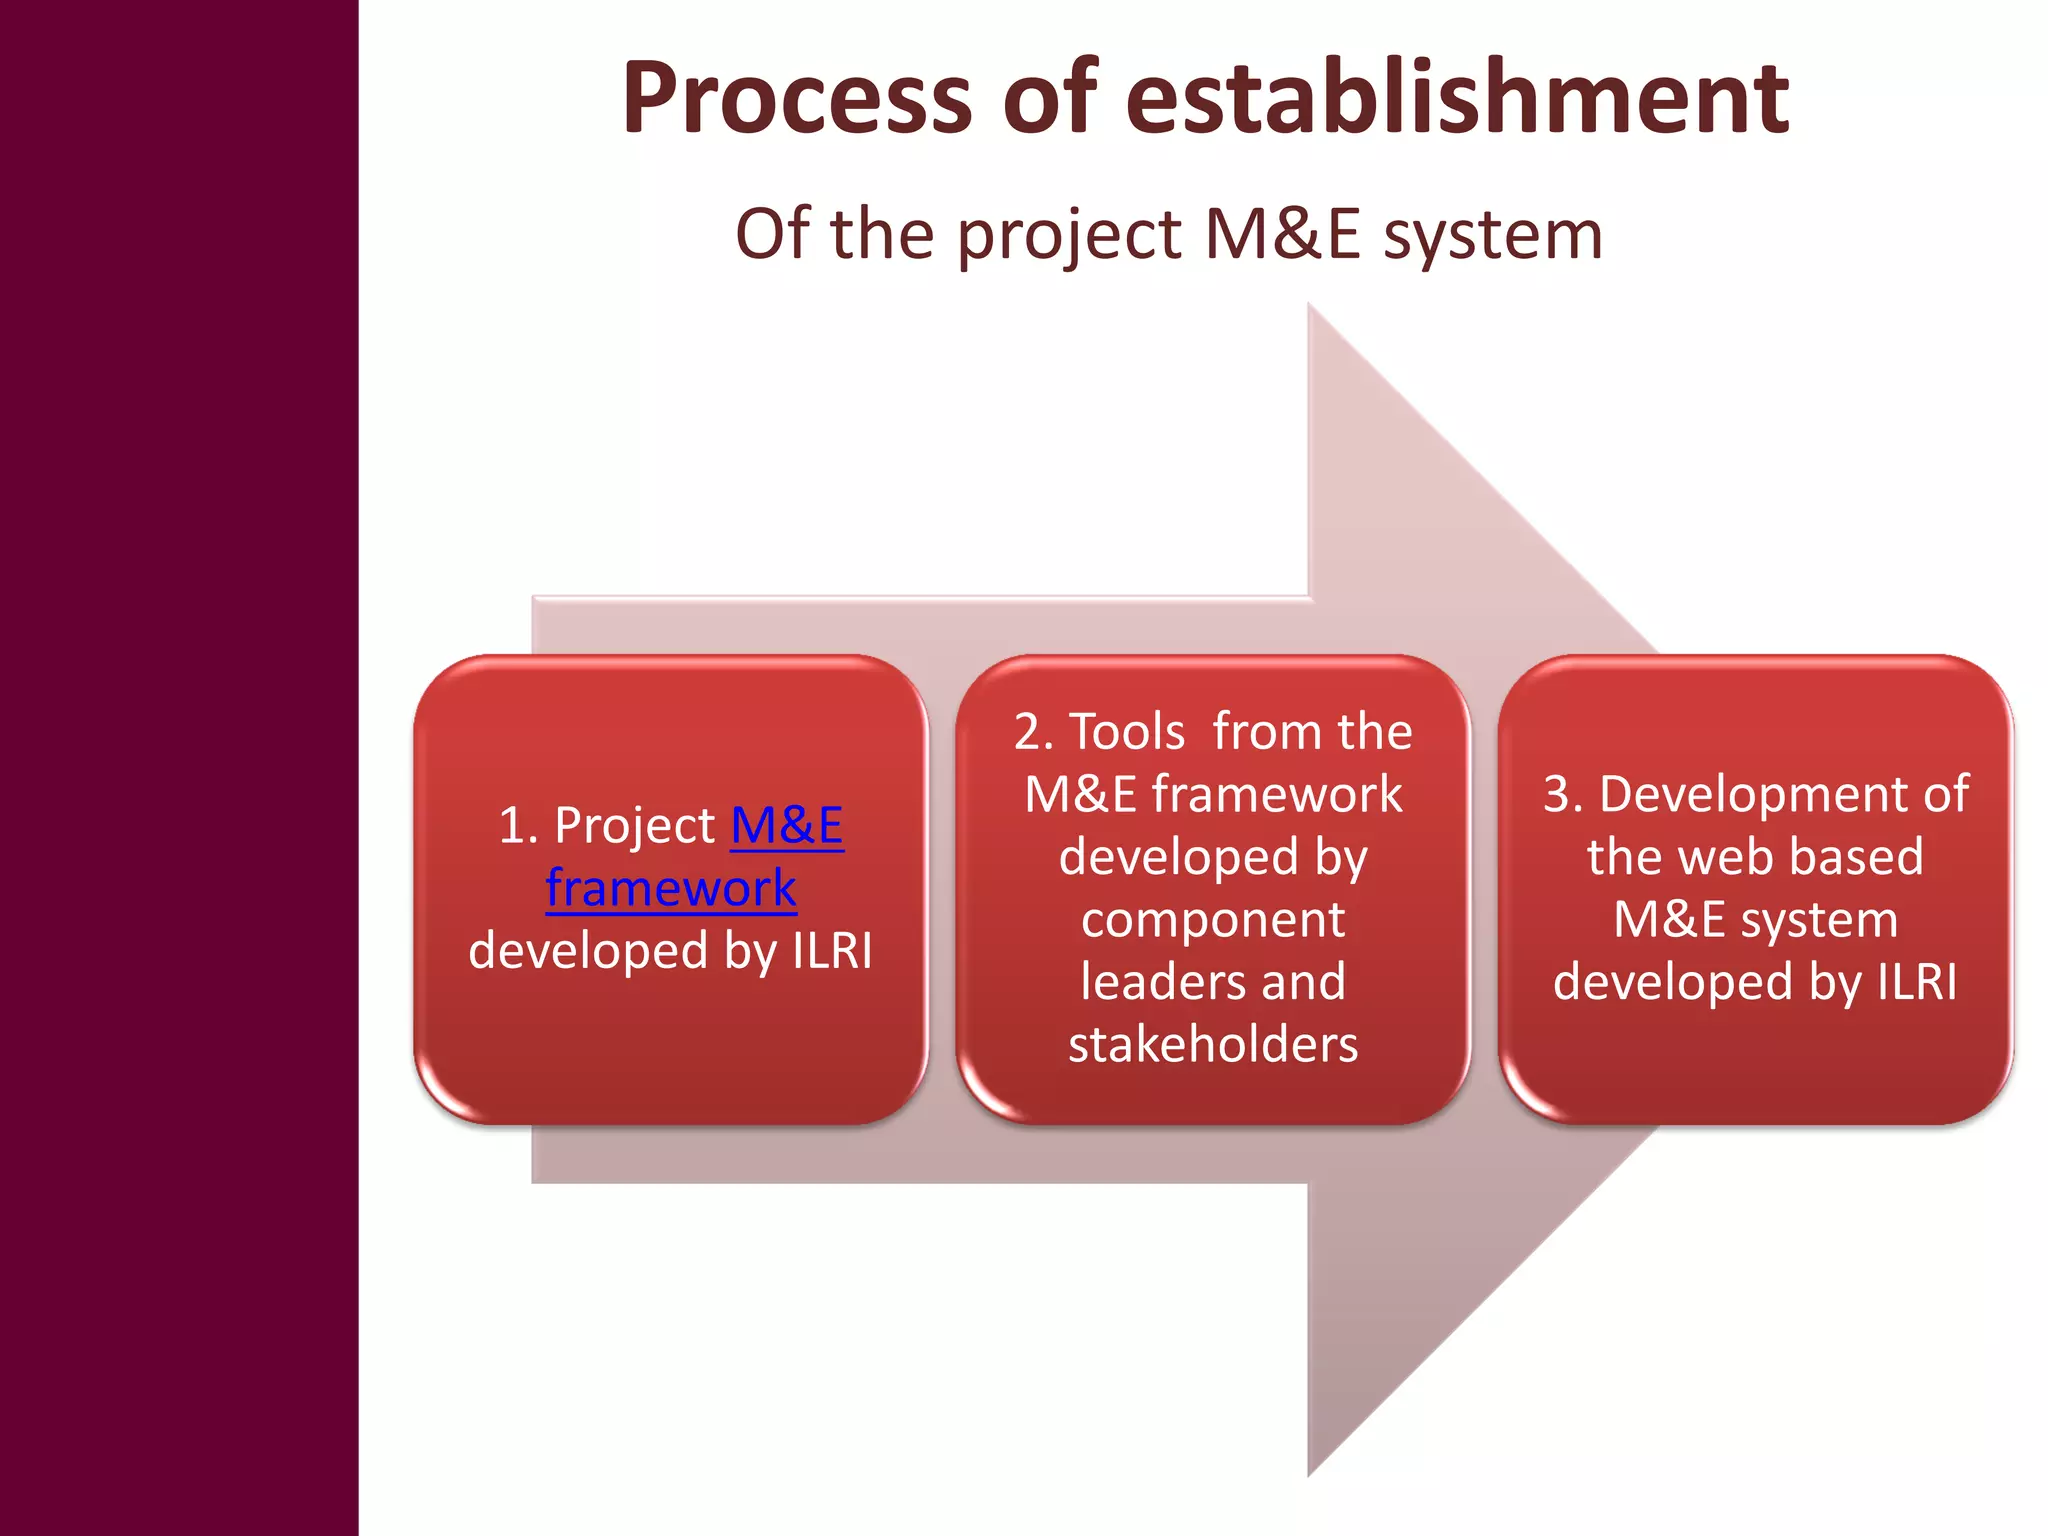
Process of establishment
Of the project M&E system
2. Tools from the
M&E framework 3. Development of
1. Project M&E
developed by the web based
framework
component M&E system
developed by ILRI
leaders and developed by ILRI
stakeholders
9.
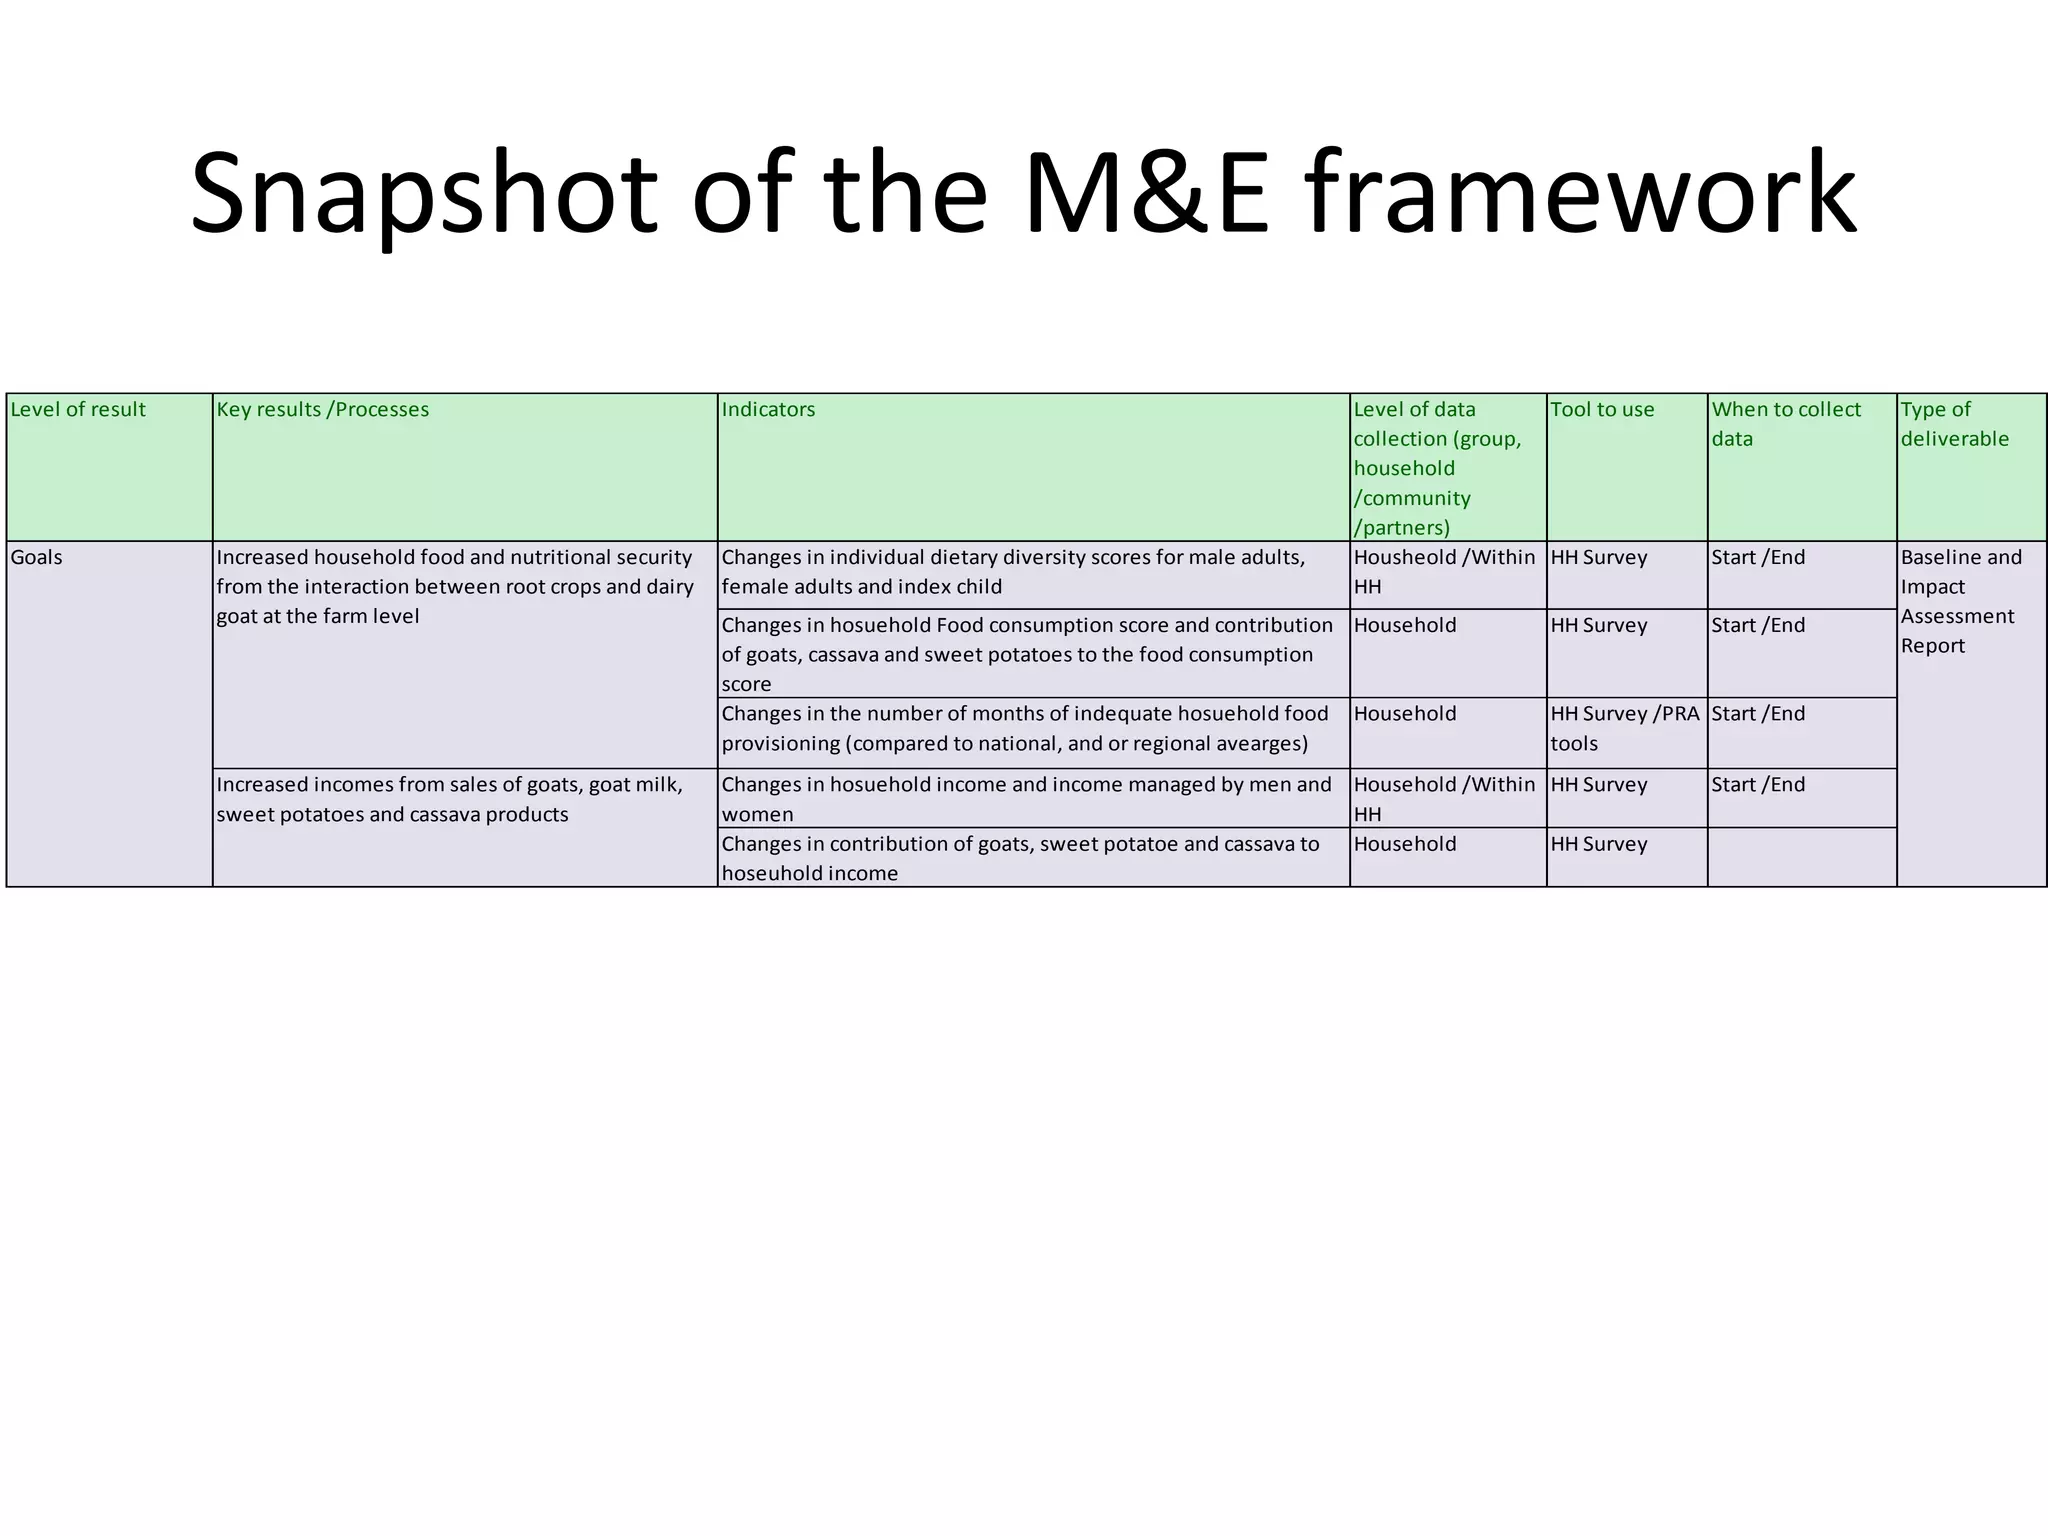
Snapshot of theM&E framework
Level of result Key results /Processes Indicators Level of data Tool to use When to collect Type of
collection (group, data deliverable
household
/community
/partners)
Goals Increased household food and nutritional security Changes in individual dietary diversity scores for male adults, Housheold /Within HH Survey Start /End Baseline and
from the interaction between root crops and dairy female adults and index child HH Impact
goat at the farm level Changes in hosuehold Food consumption score and contribution Household HH Survey Start /End Assessment
of goats, cassava and sweet potatoes to the food consumption Report
score
Changes in the number of months of indequate hosuehold food Household HH Survey /PRA Start /End
provisioning (compared to national, and or regional avearges) tools
Increased incomes from sales of goats, goat milk, Changes in hosuehold income and income managed by men and Household /Within HH Survey Start /End
sweet potatoes and cassava products women HH
Changes in contribution of goats, sweet potatoe and cassava to Household HH Survey
hoseuhold income
10.
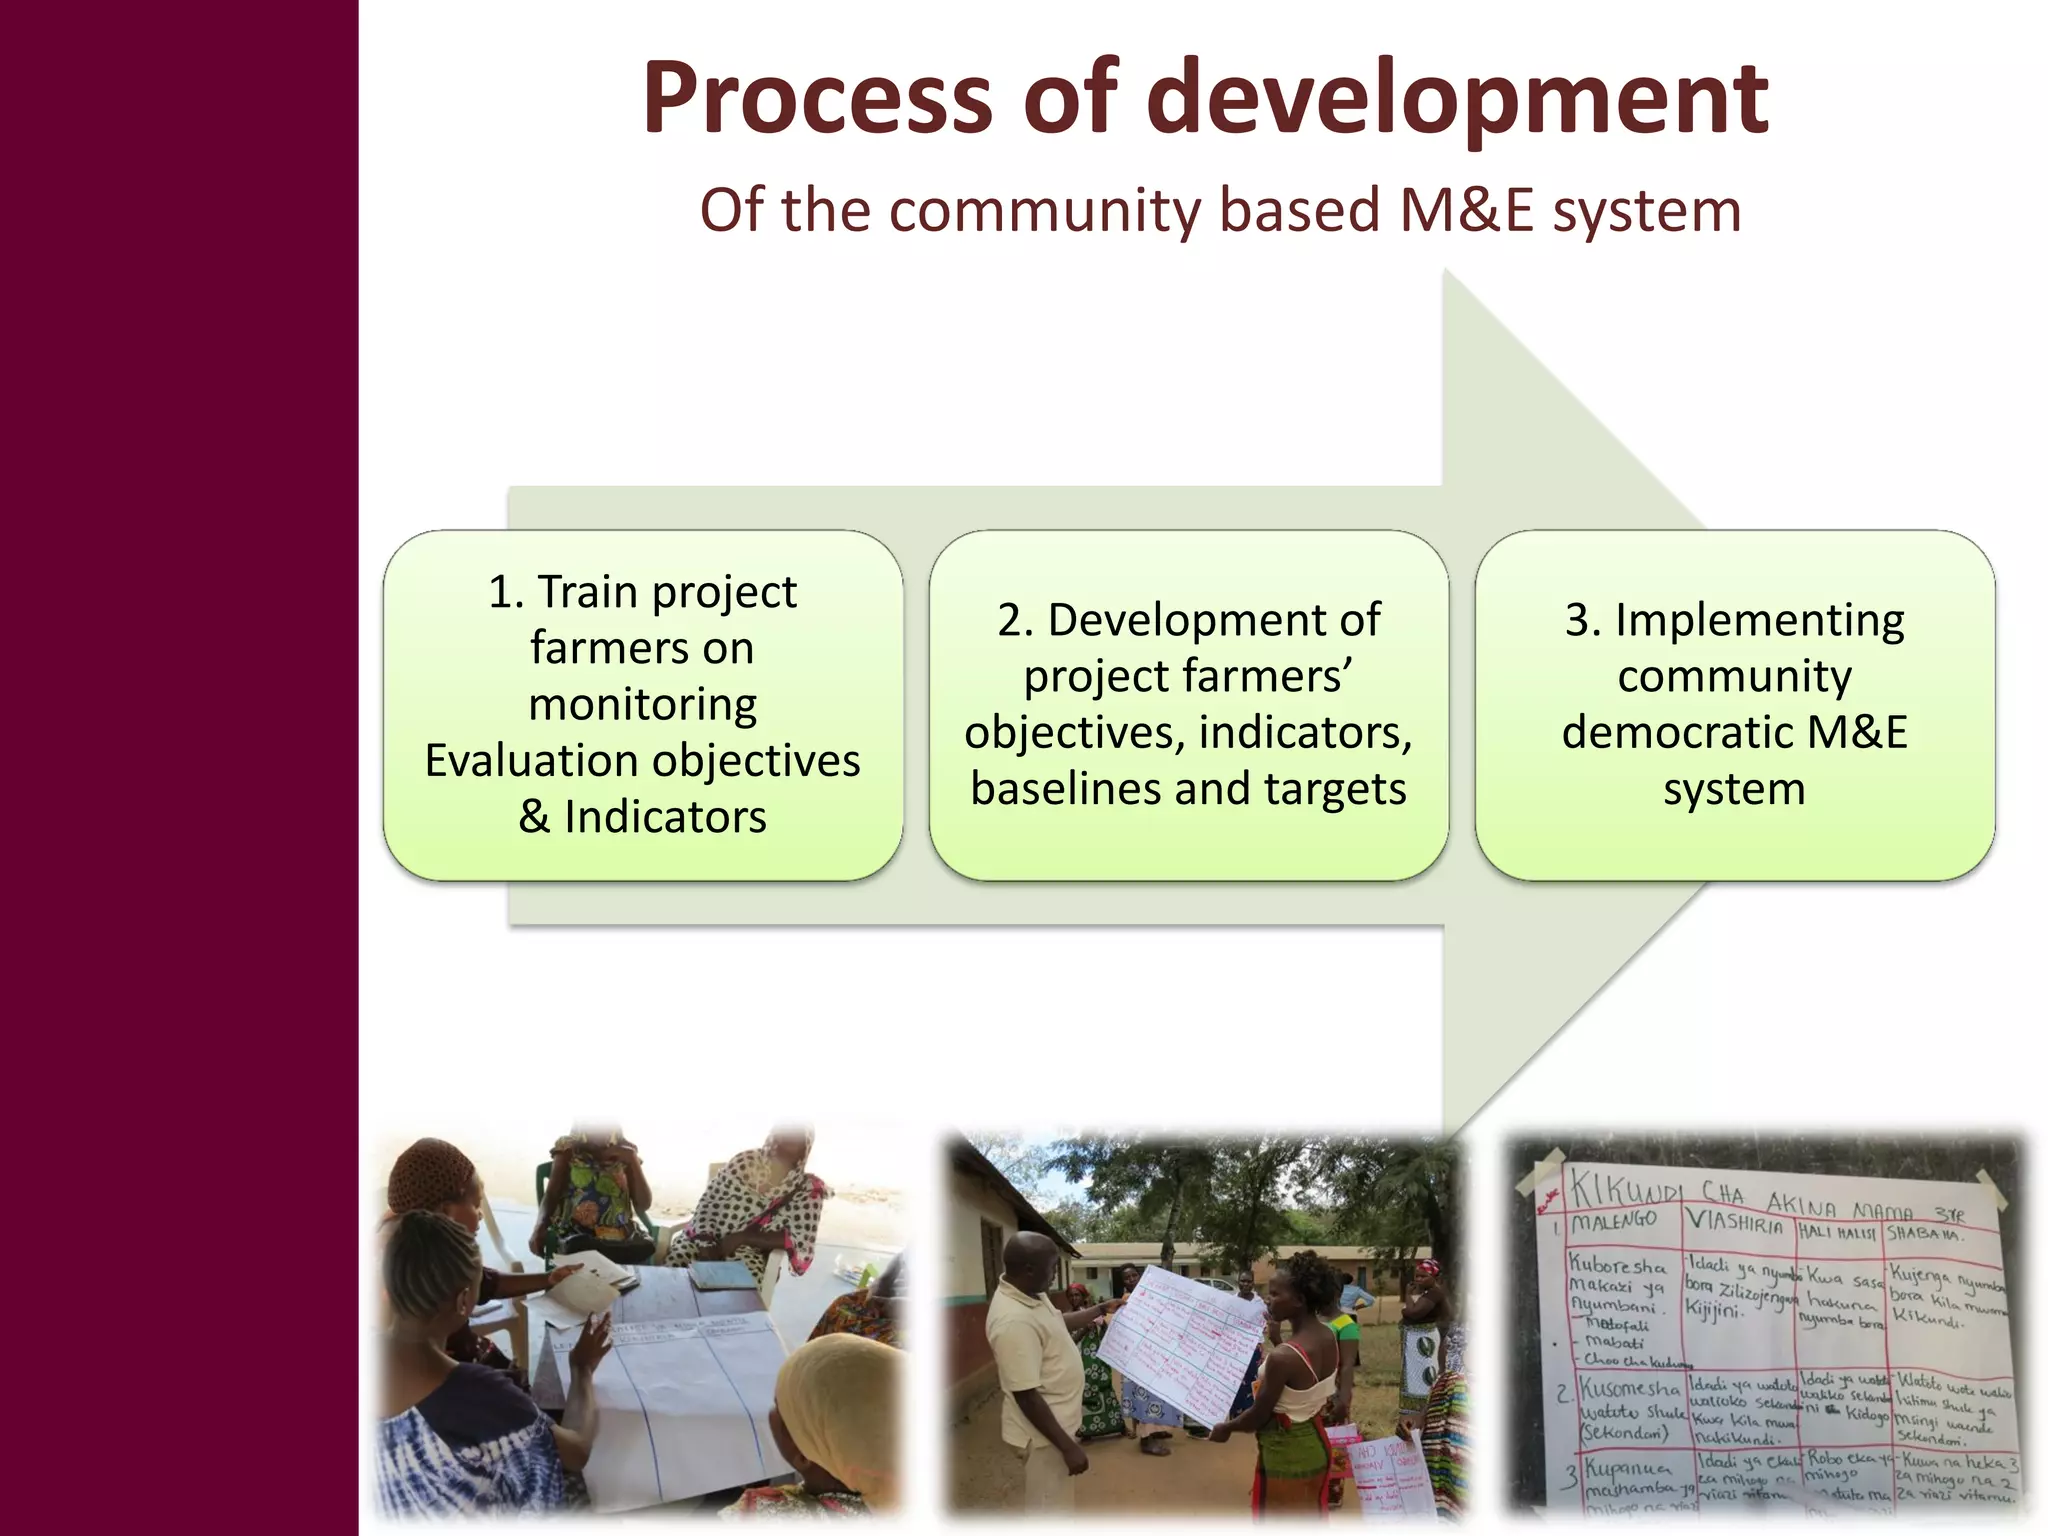
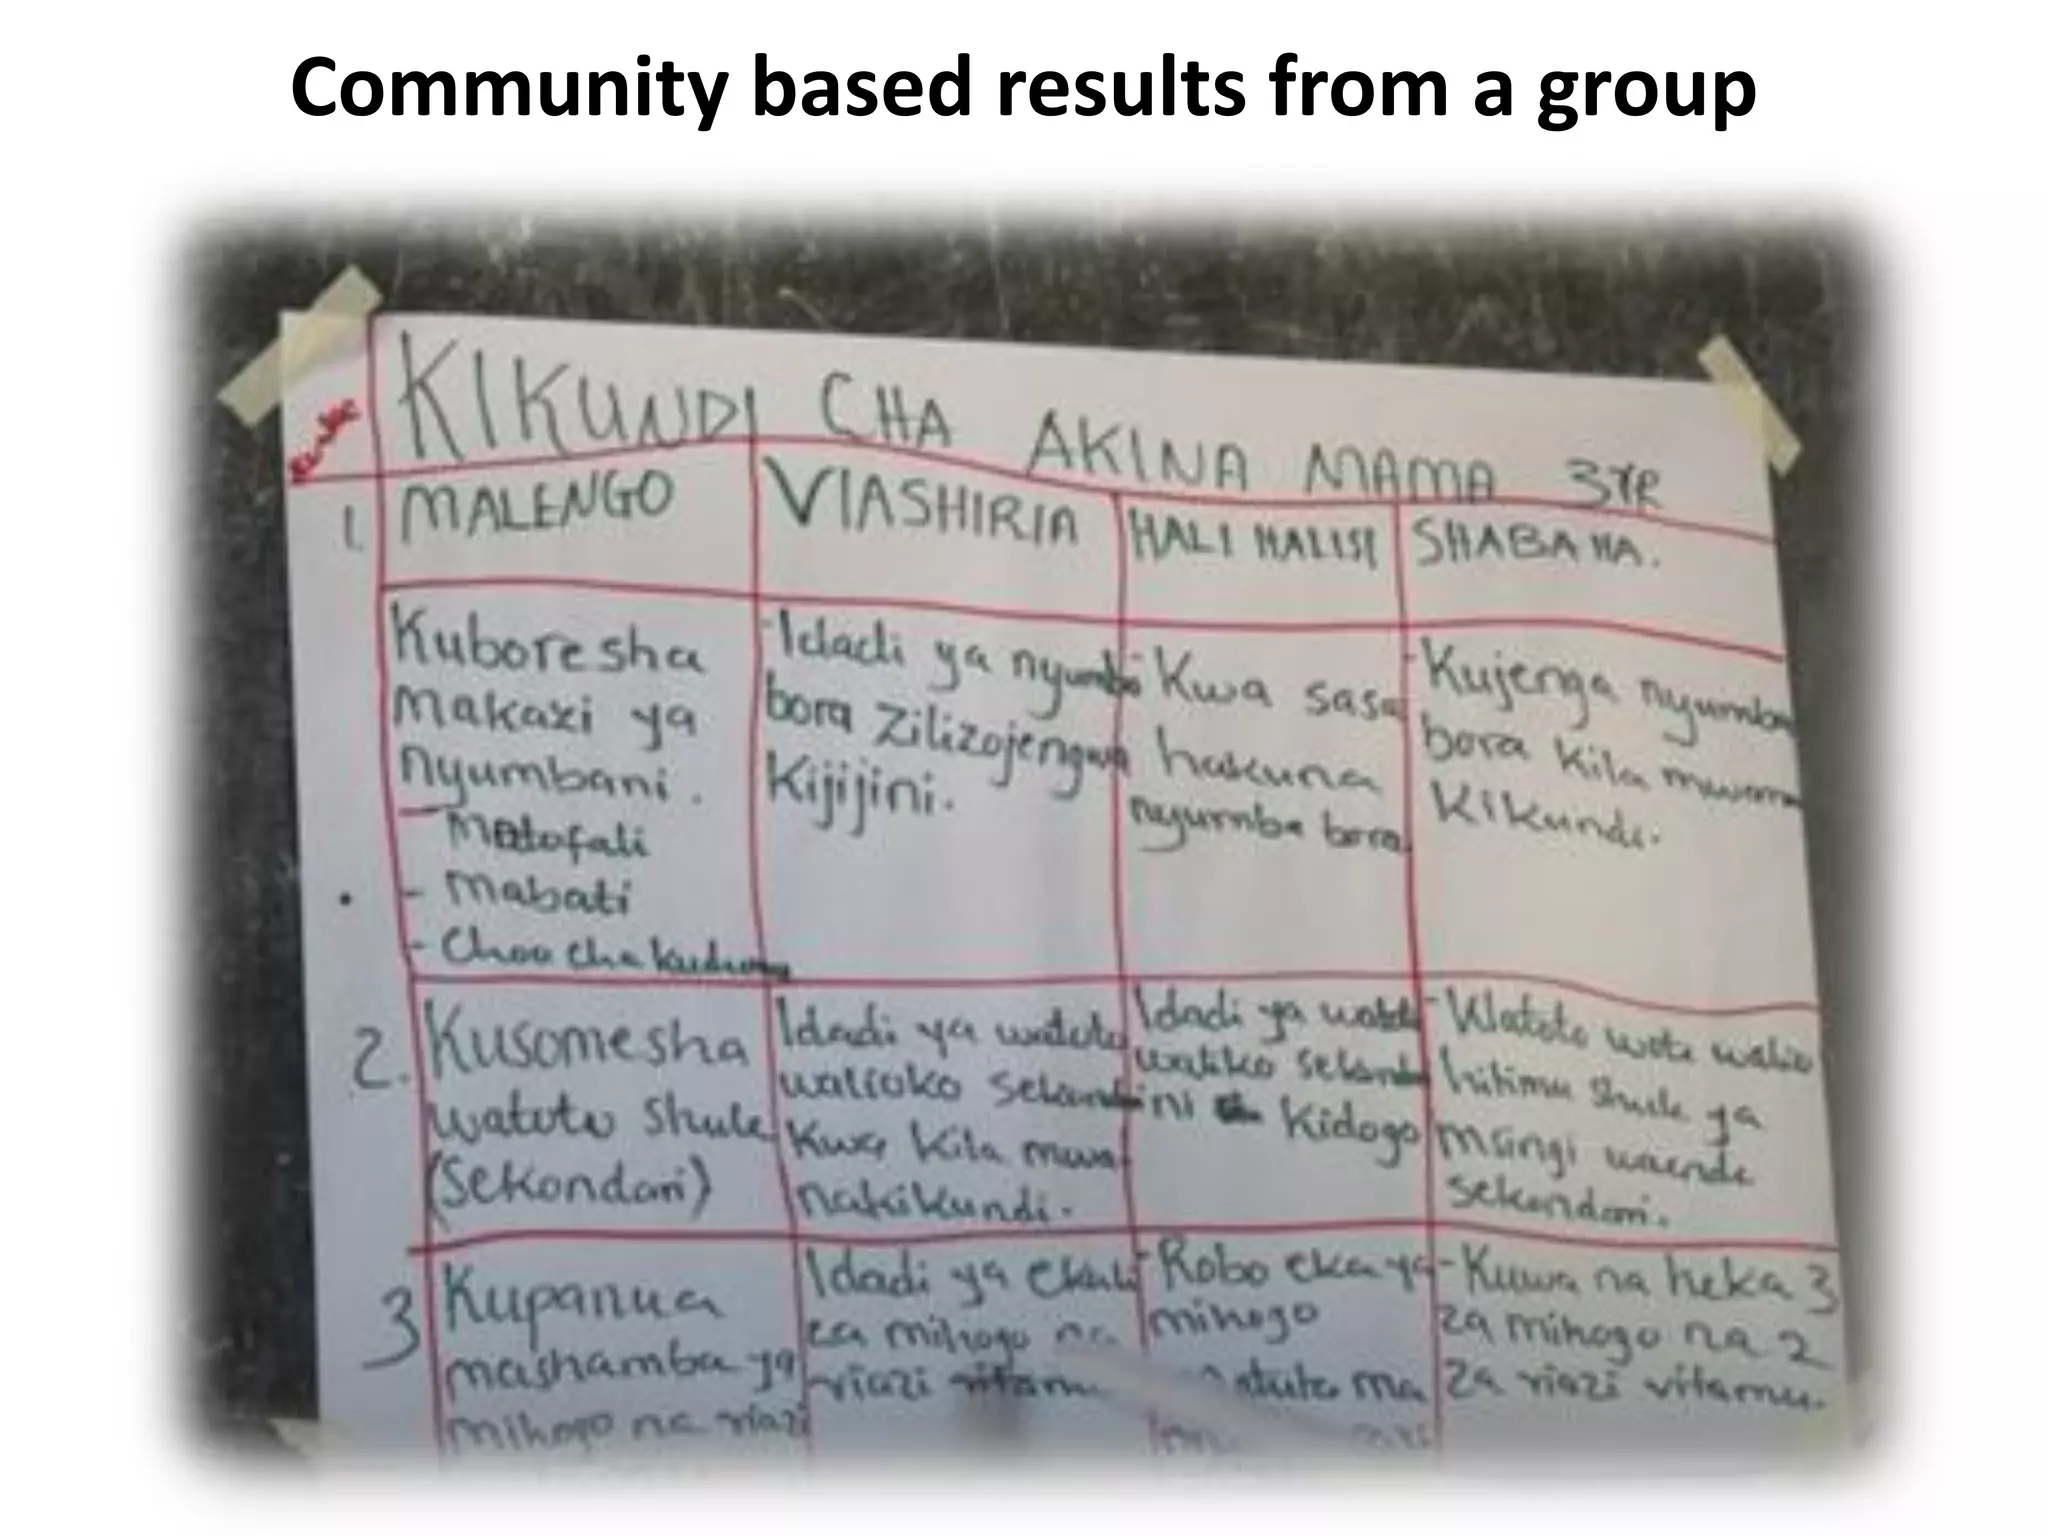
Process of development
Of the community based M&E system
1. Train project
2. Development of 3. Implementing
farmers on
project farmers’ community
monitoring
objectives, indicators, democratic M&E
Evaluation objectives
baselines and targets system
& Indicators
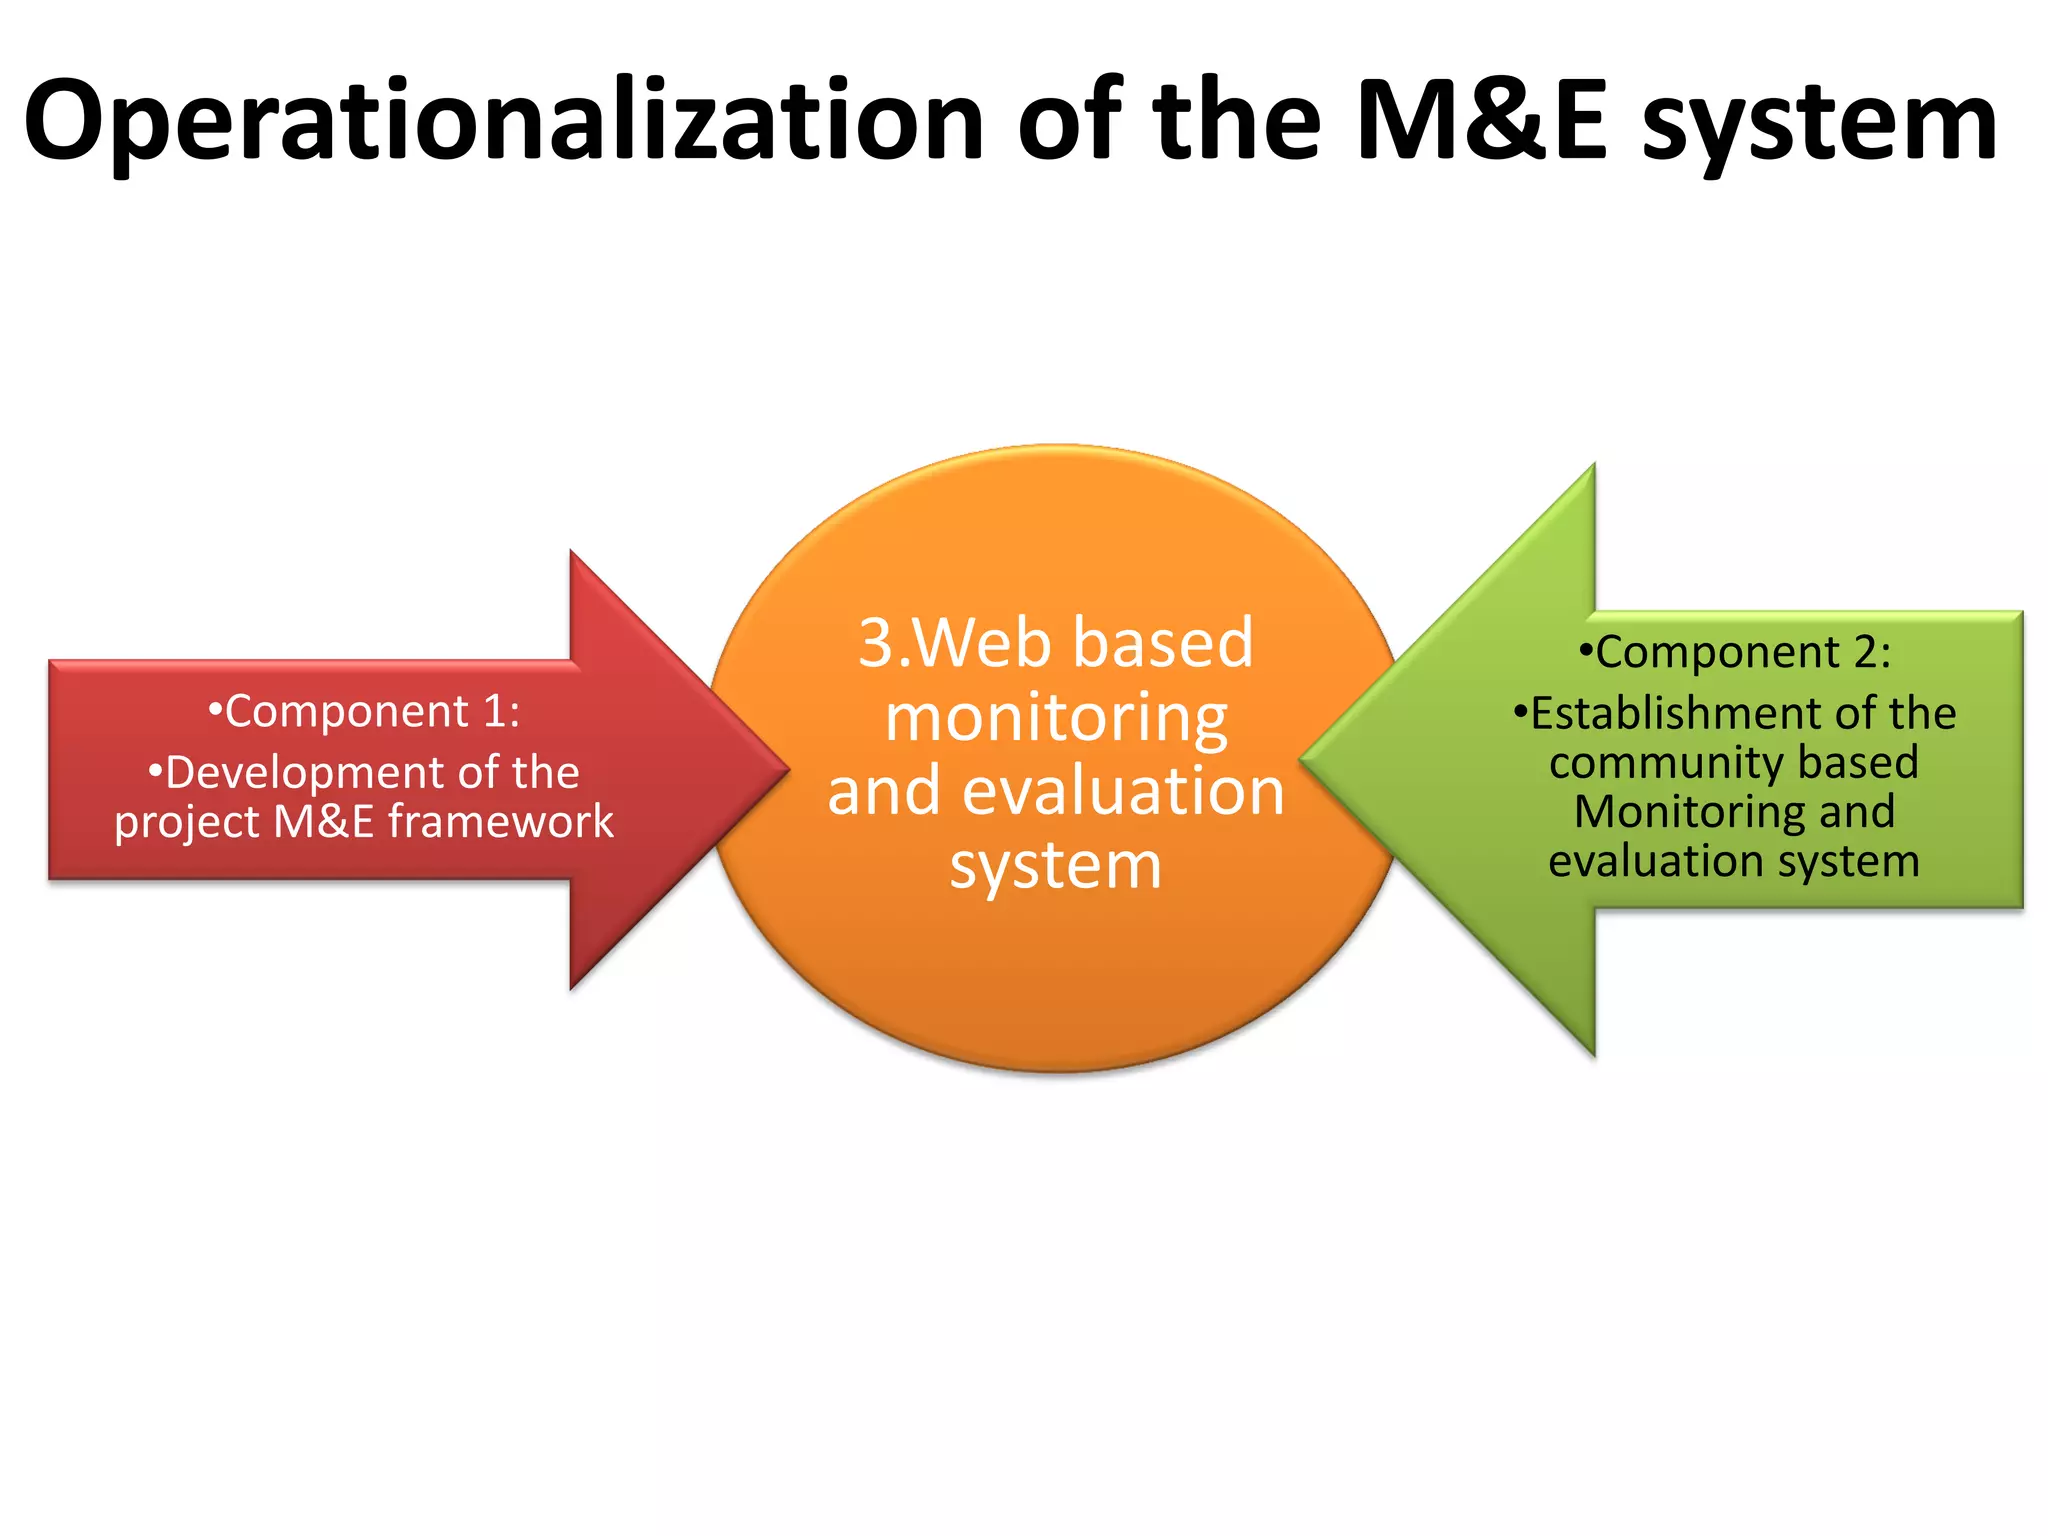
Operationalization of theM&E system
3.Web based •Component 2:
•Component 1: monitoring •Establishment of the
•Development of the community based
project M&E framework and evaluation Monitoring and
system evaluation system
13.
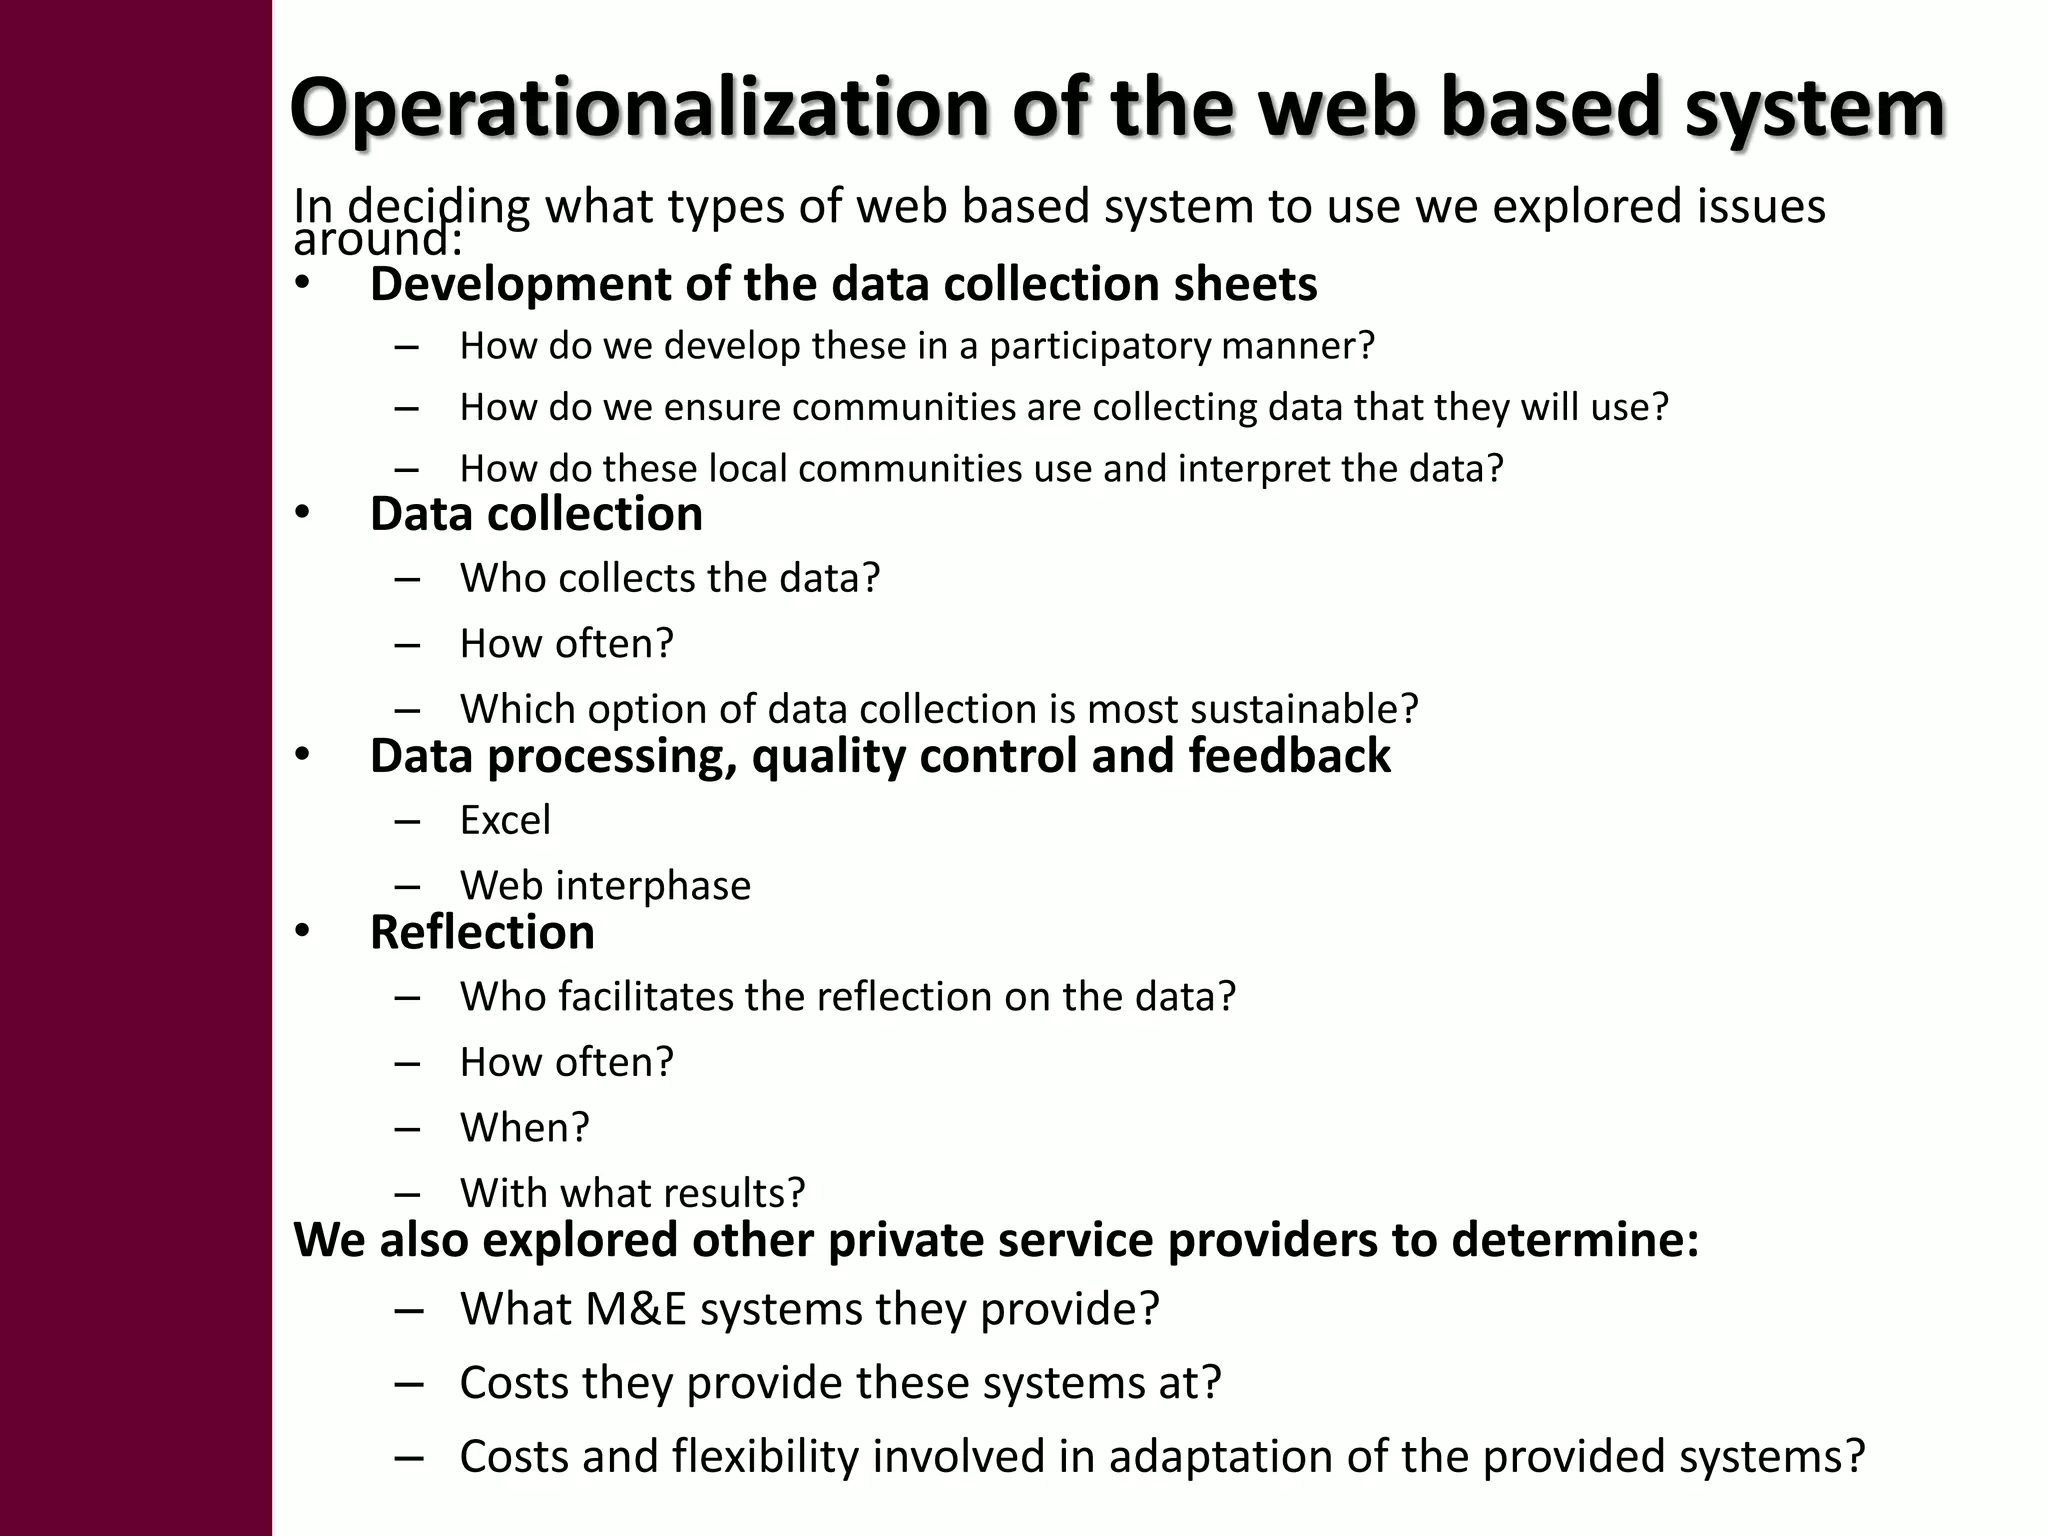
Operationalization of theweb based system
In deciding what types of web based system to use we explored issues
around:
• Development of the data collection sheets
– How do we develop these in a participatory manner?
– How do we ensure communities are collecting data that they will use?
– How do these local communities use and interpret the data?
• Data collection
– Who collects the data?
– How often?
– Which option of data collection is most sustainable?
• Data processing, quality control and feedback
– Excel
– Web interphase
• Reflection
– Who facilitates the reflection on the data?
– How often?
– When?
– With what results?
We also explored other private service providers to determine:
– What M&E systems they provide?
– Costs they provide these systems at?
– Costs and flexibility involved in adaptation of the provided systems?
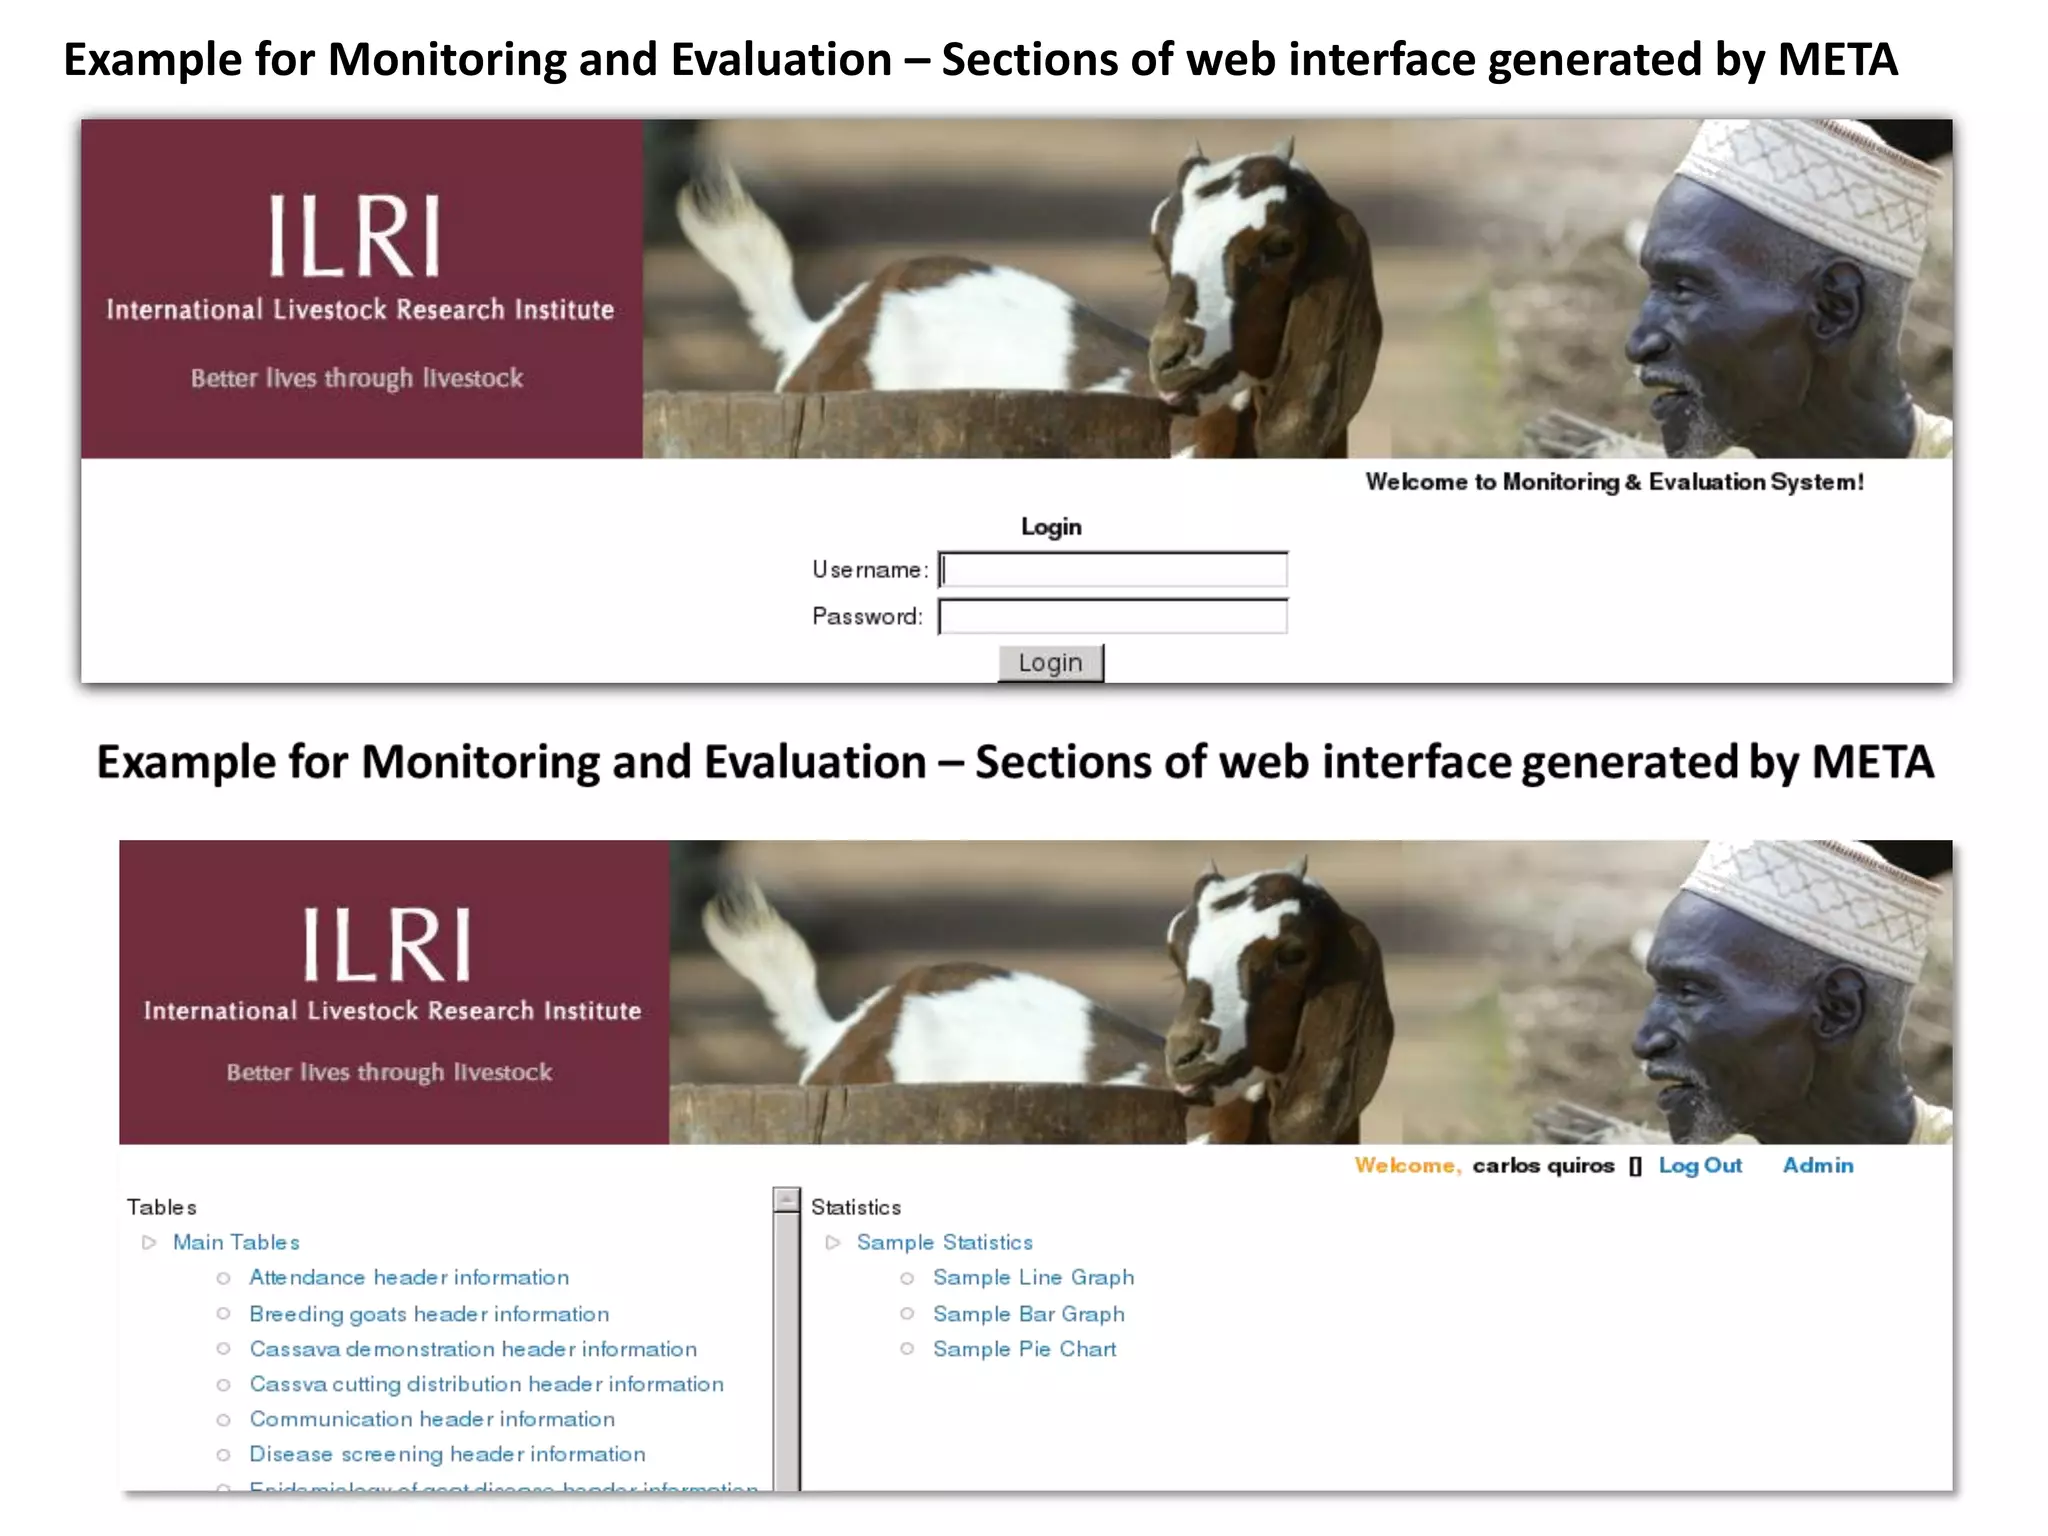
14.
Objective : Webbased M&E system
• To enable project implementers to measure and track
indicators outlined in the M & E framework online
• To enable stakeholders to track changes in the
project management and outcomes online.
• Online access by stakeholders to data that is
collected and uploaded into the system and
summaries generated by these data
• Statistical summaries will facilitate reflection sessions
with local communities to ensure democratic
decision making about project progress
15.
Functions of theweb system
• Data collection and entry : initially by field level research
assistants (Potential involvement of farmers and/or
extension workers - sustainability)
• Accessibility: of the system by the project and non
project partners (Public) through a login system with
differential user rights
• Analysis: query building or automatic generation
statistics at a click of the parameter
• Feedback and learning: Generated statistics and reports
are reported back to the livestock/breeder groups to
ensure reflection & decision making on project progress
• Not a Static system!! (Missing components to be
integrated (EIA and Markets) & adaptation of system
• The established web based M & E system can be
customised to be used by other projects (in ILRI)
16.
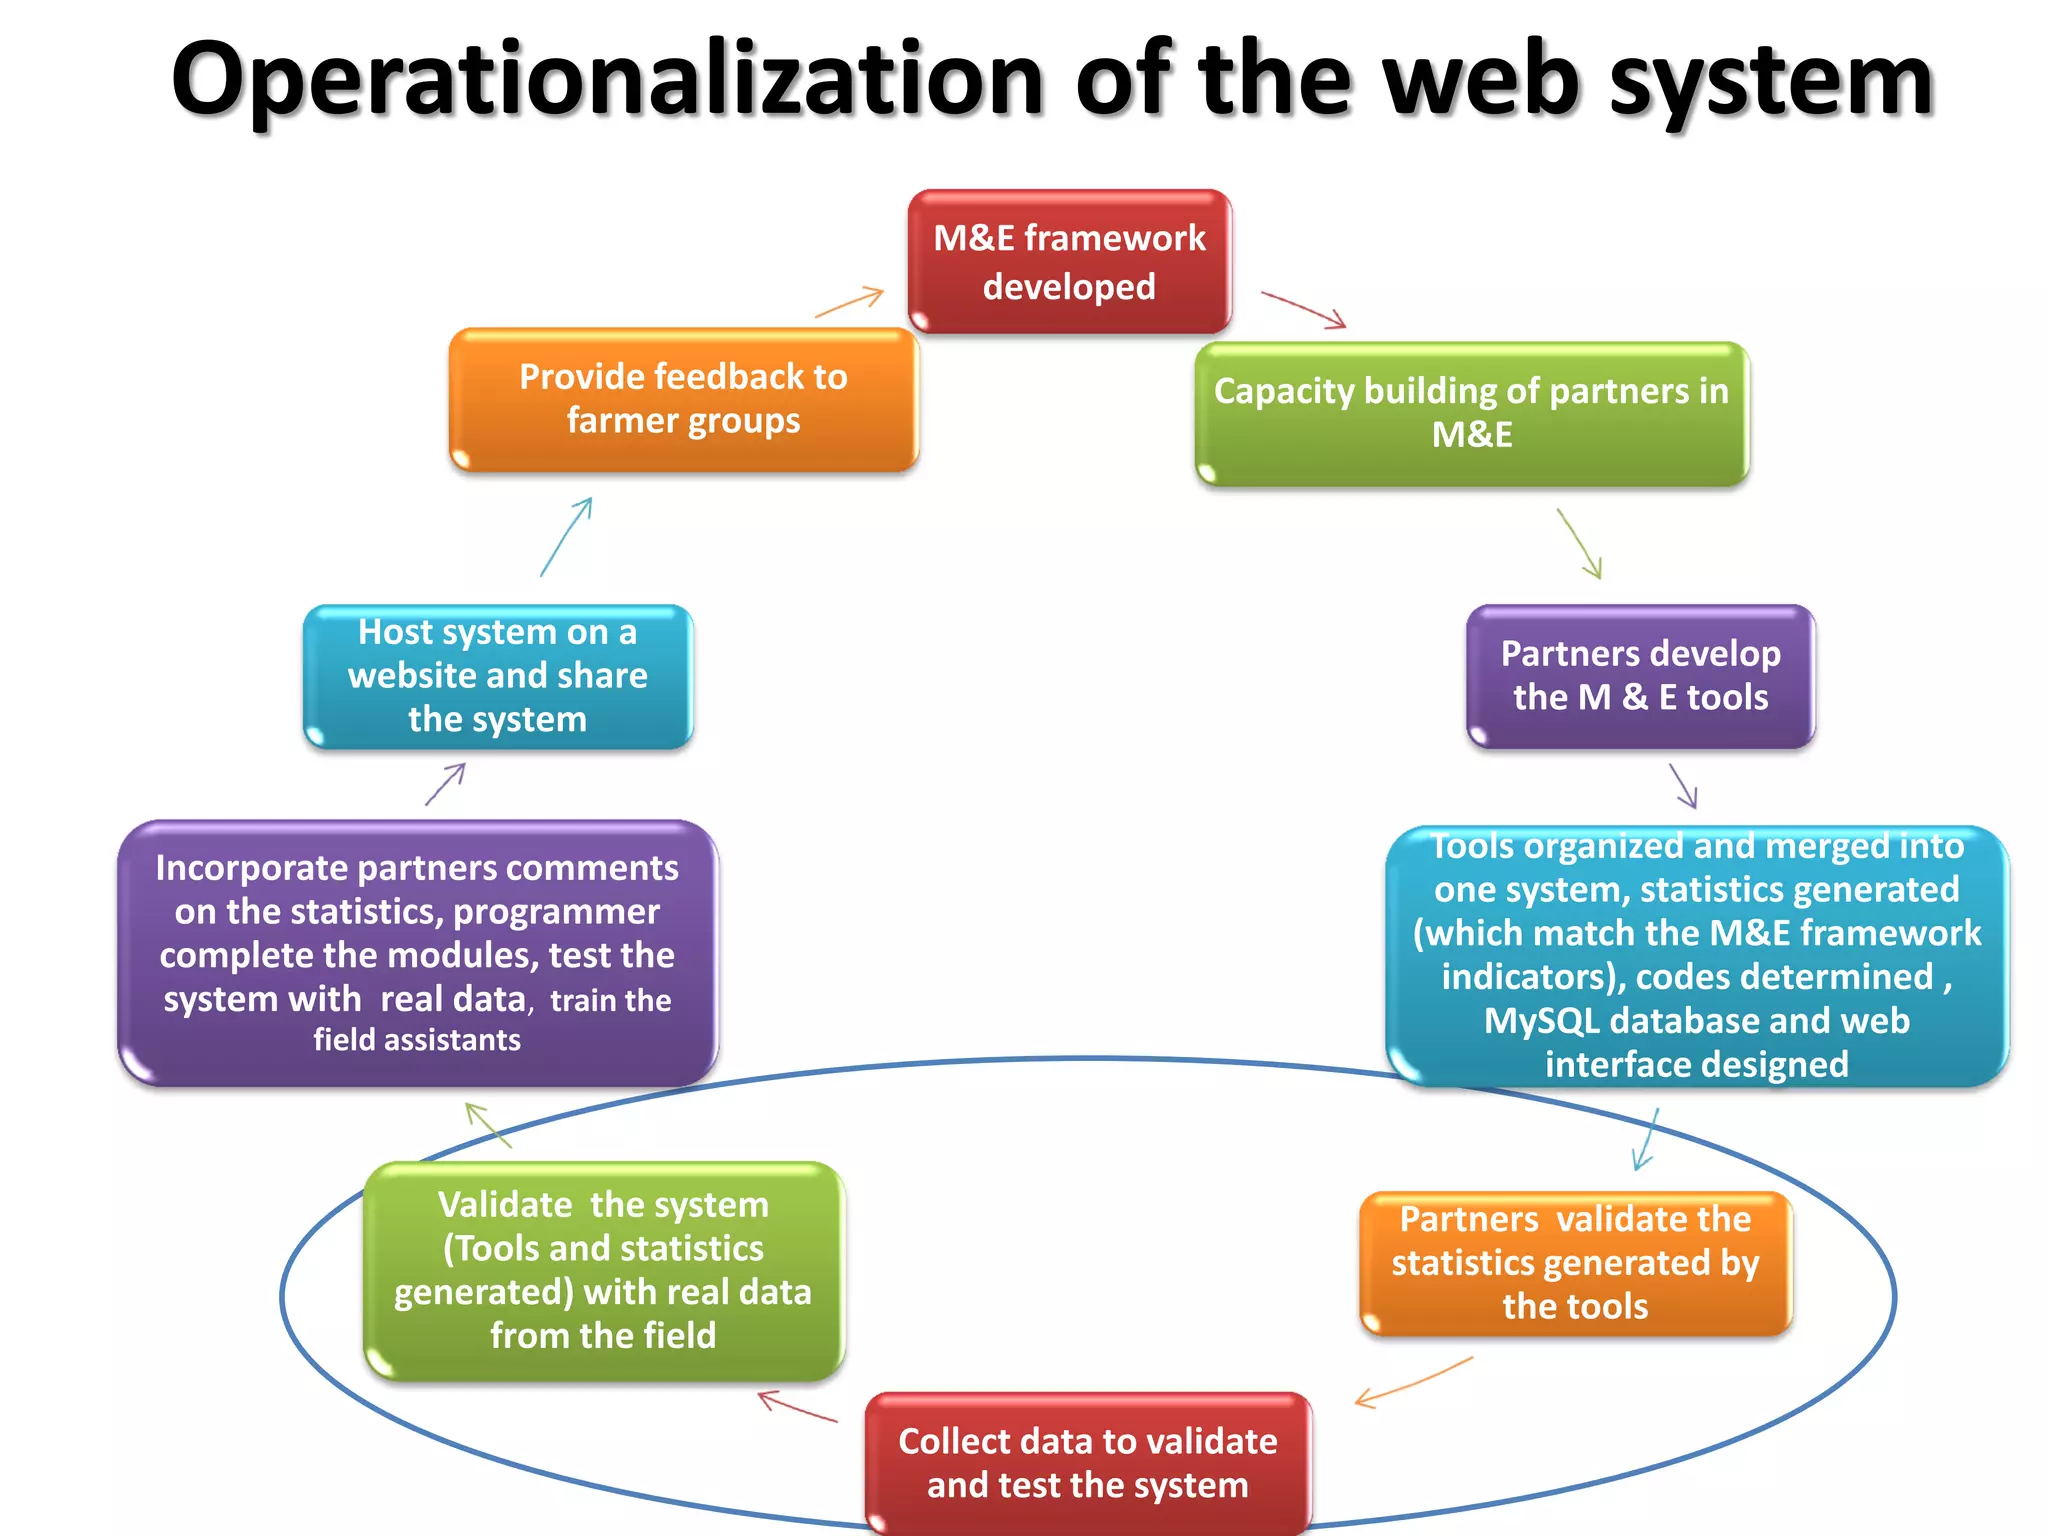
Operationalization of theweb system
M&E framework
developed
Provide feedback to Capacity building of partners in
farmer groups M&E
Host system on a
Partners develop
website and share
the M & E tools
the system
Tools organized and merged into
Incorporate partners comments
one system, statistics generated
on the statistics, programmer
(which match the M&E framework
complete the modules, test the
indicators), codes determined ,
system with real data, train the
field assistants
MySQL database and web
interface designed
Validate the system Partners validate the
(Tools and statistics statistics generated by
generated) with real data the tools
from the field
Collect data to validate
and test the system
17.
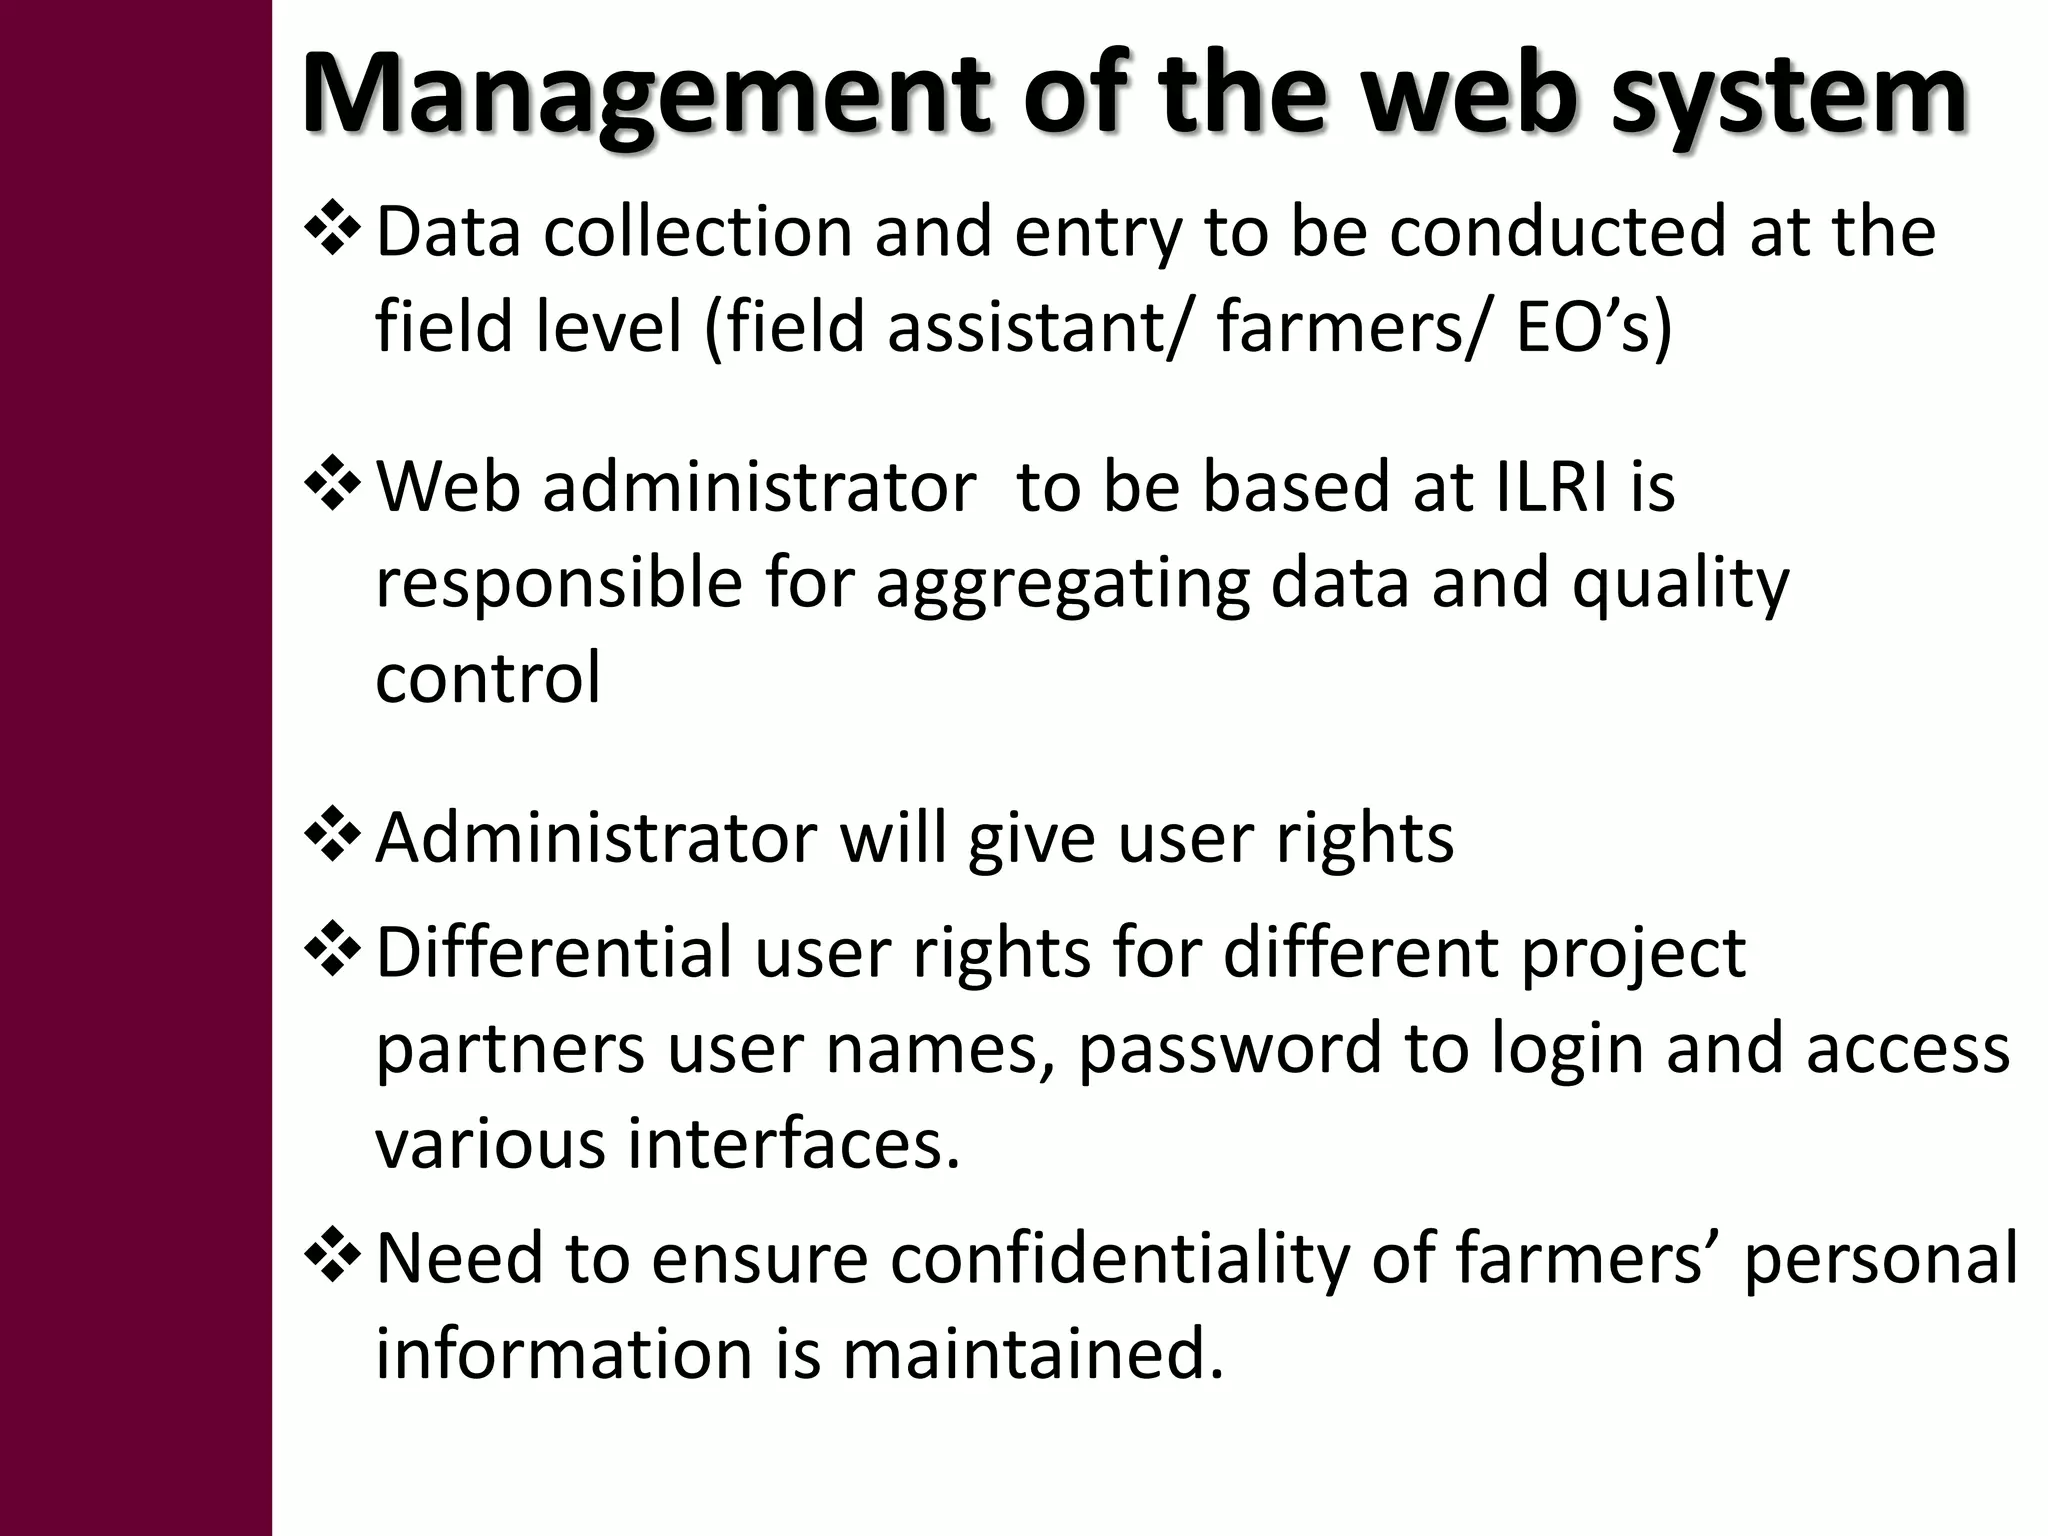
Management of theweb system
Data collection and entry to be conducted at the
field level (field assistant/ farmers/ EO’s)
Web administrator to be based at ILRI is
responsible for aggregating data and quality
control
Administrator will give user rights
Differential user rights for different project
partners user names, password to login and access
various interfaces.
Need to ensure confidentiality of farmers’ personal
information is maintained.
18.
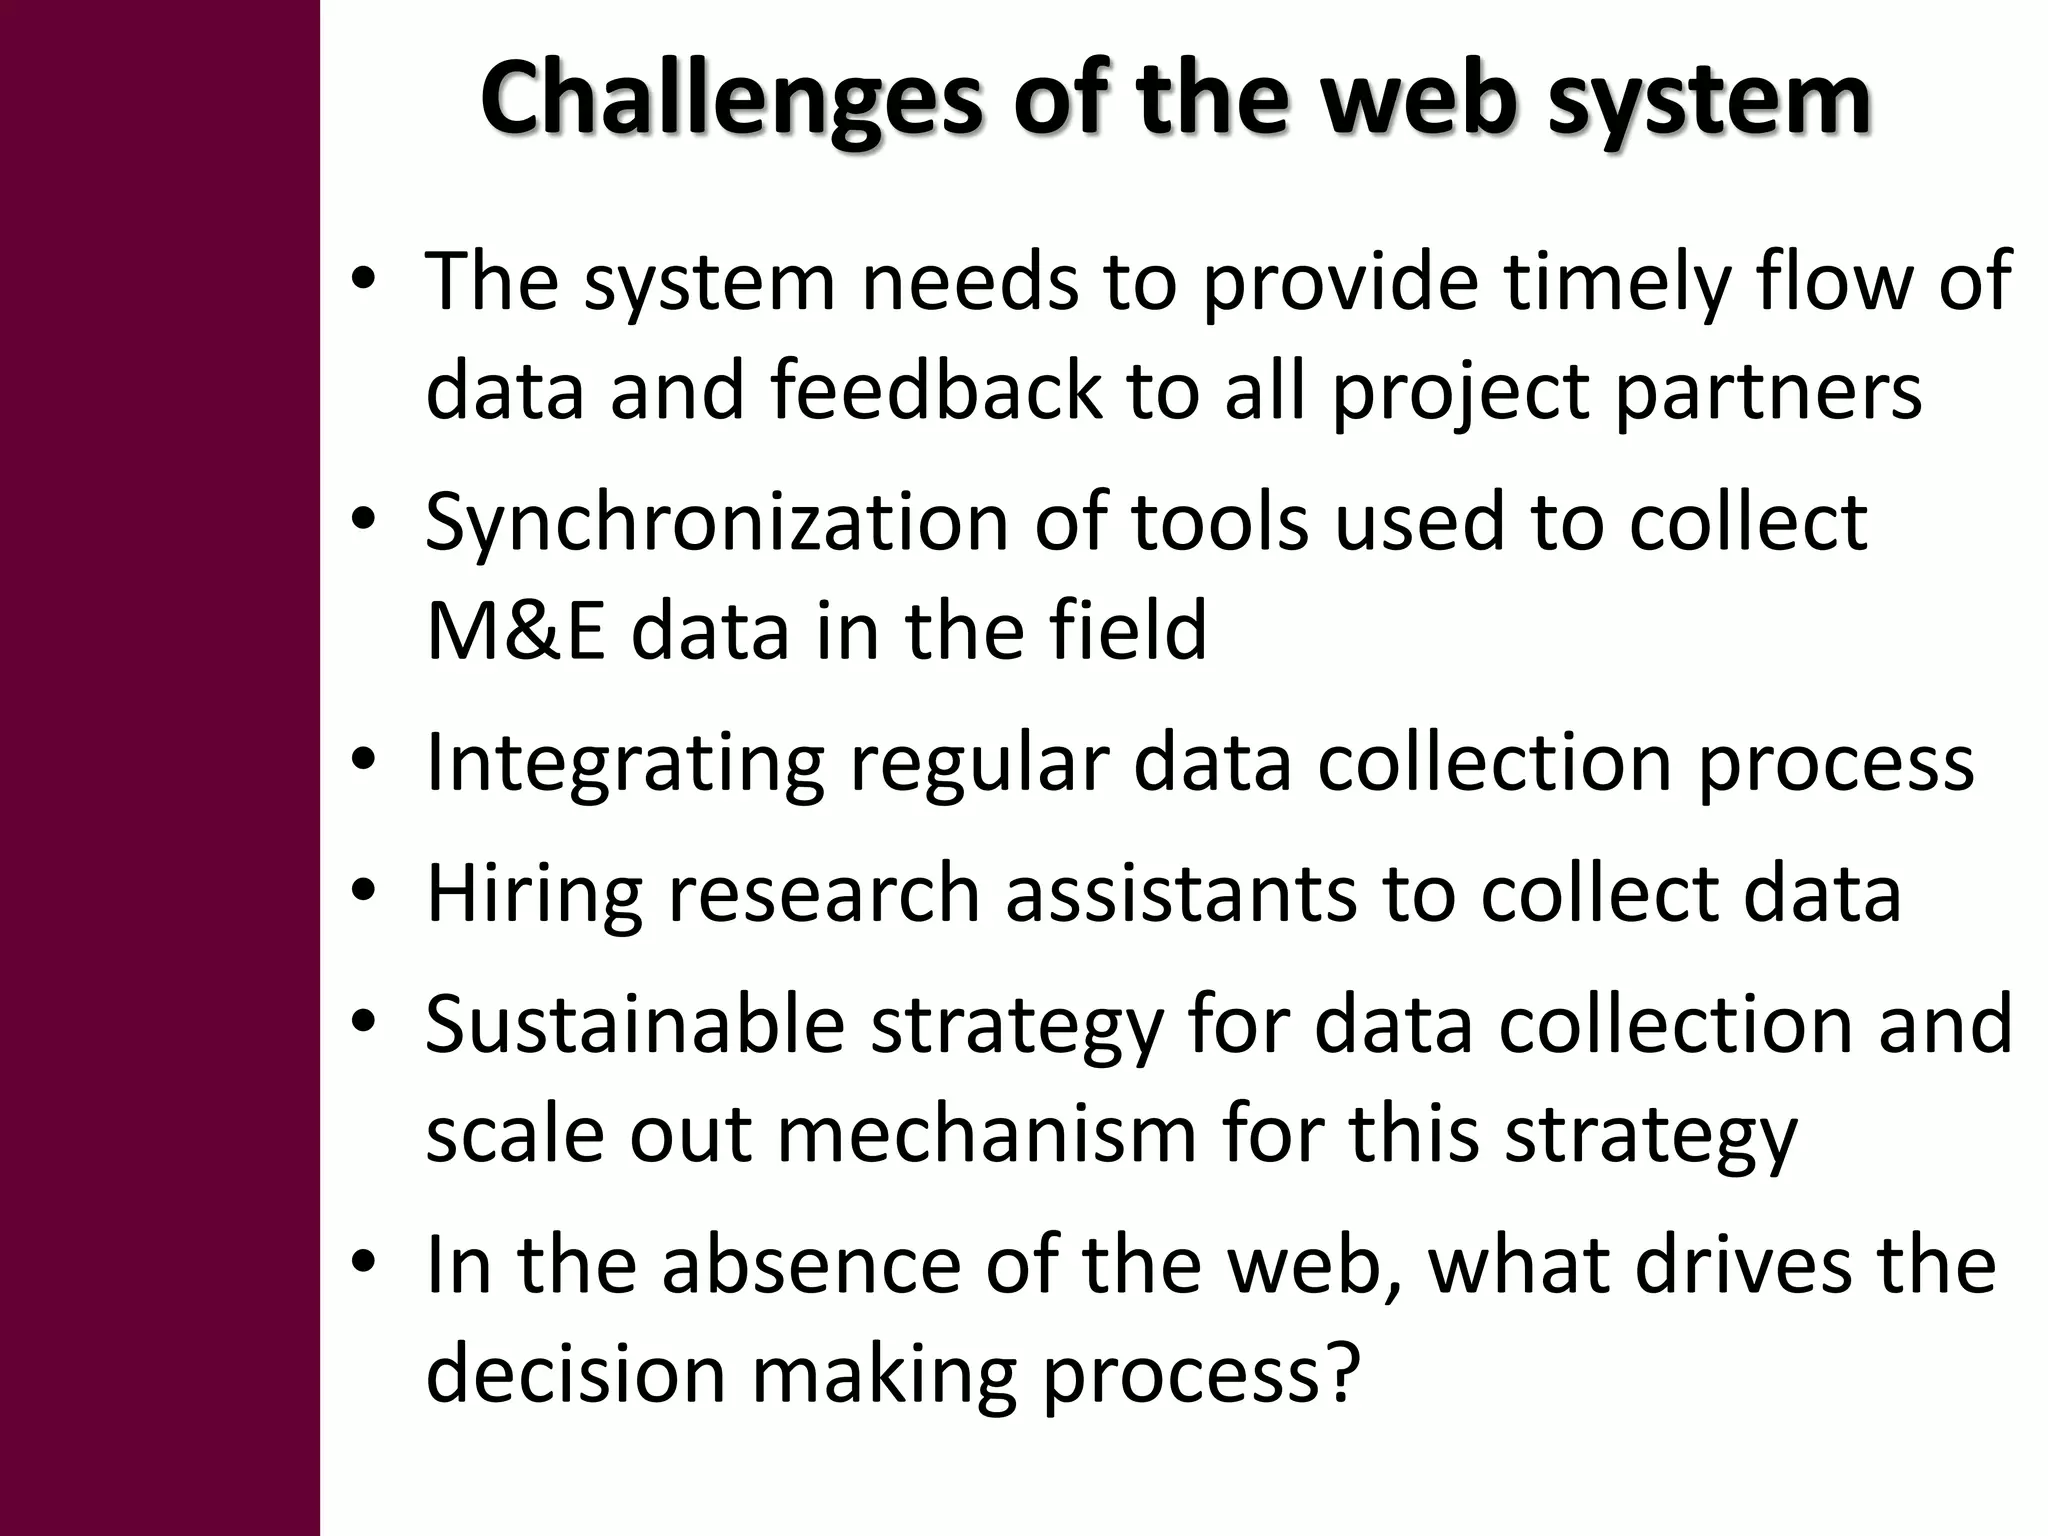
Challenges of theweb system
• The system needs to provide timely flow of
data and feedback to all project partners
• Synchronization of tools used to collect
M&E data in the field
• Integrating regular data collection process
• Hiring research assistants to collect data
• Sustainable strategy for data collection and
scale out mechanism for this strategy
• In the absence of the web, what drives the
decision making process?
19.
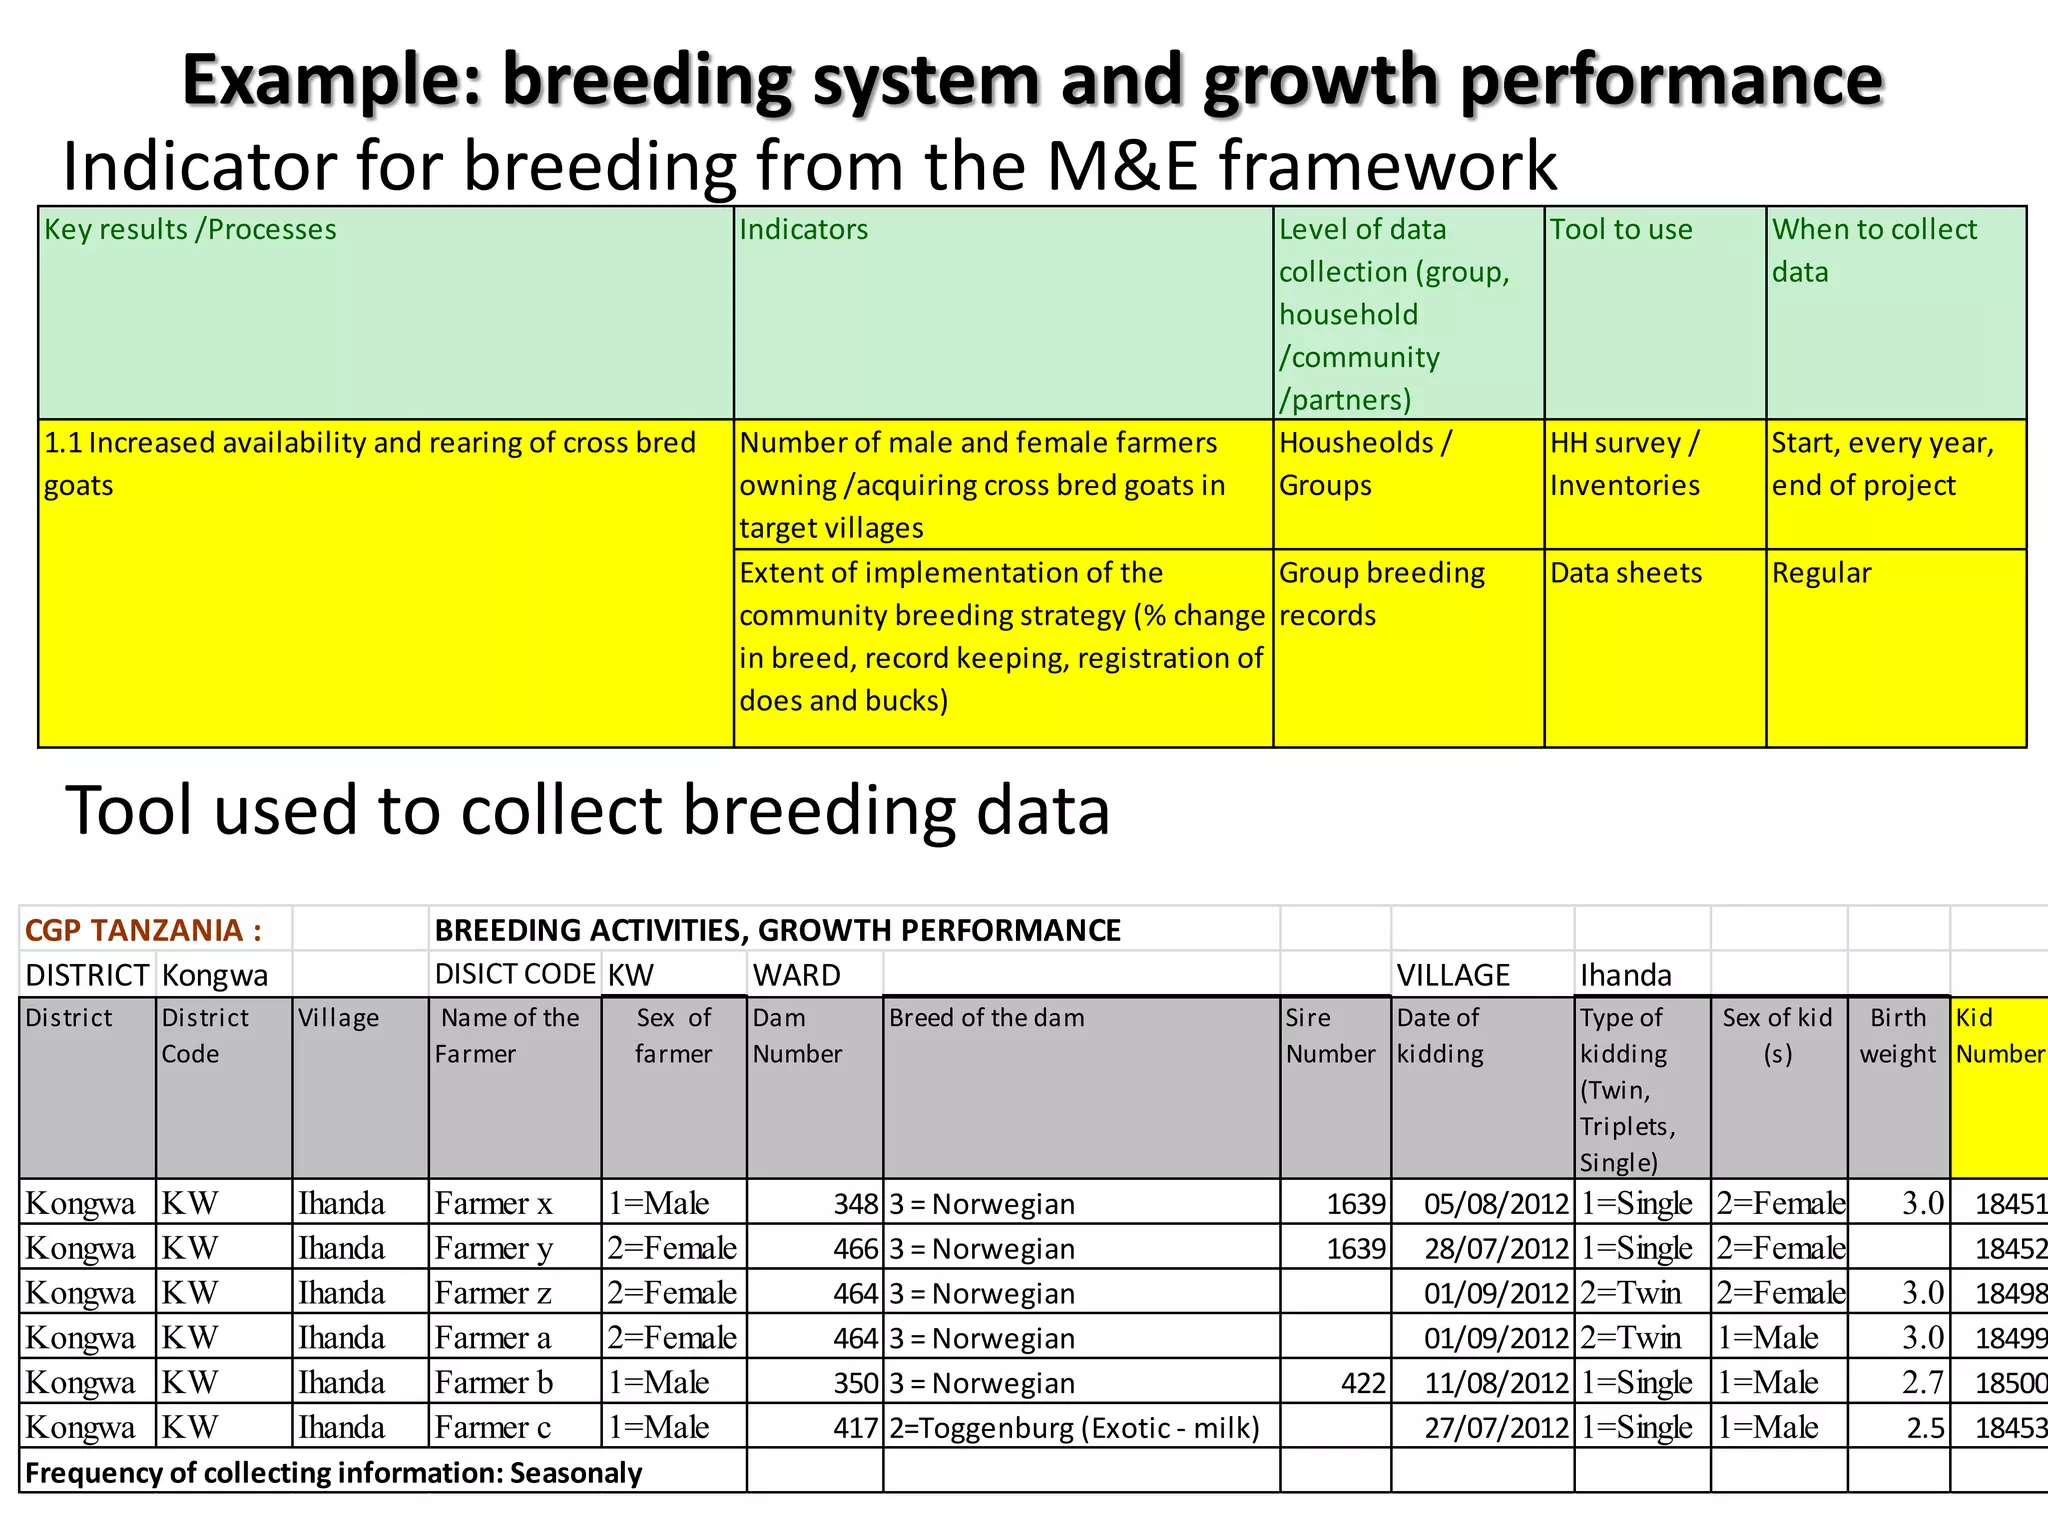
Example: breeding systemand growth performance
Indicator for breeding from the M&E framework
Key results /Processes Indicators Level of data Tool to use When to collect
collection (group, data
household
/community
/partners)
1.1 Increased availability and rearing of cross bred Number of male and female farmers Housheolds / HH survey / Start, every year,
goats owning /acquiring cross bred goats in Groups Inventories end of project
target villages
Extent of implementation of the Group breeding Data sheets Regular
community breeding strategy (% change records
in breed, record keeping, registration of
does and bucks)
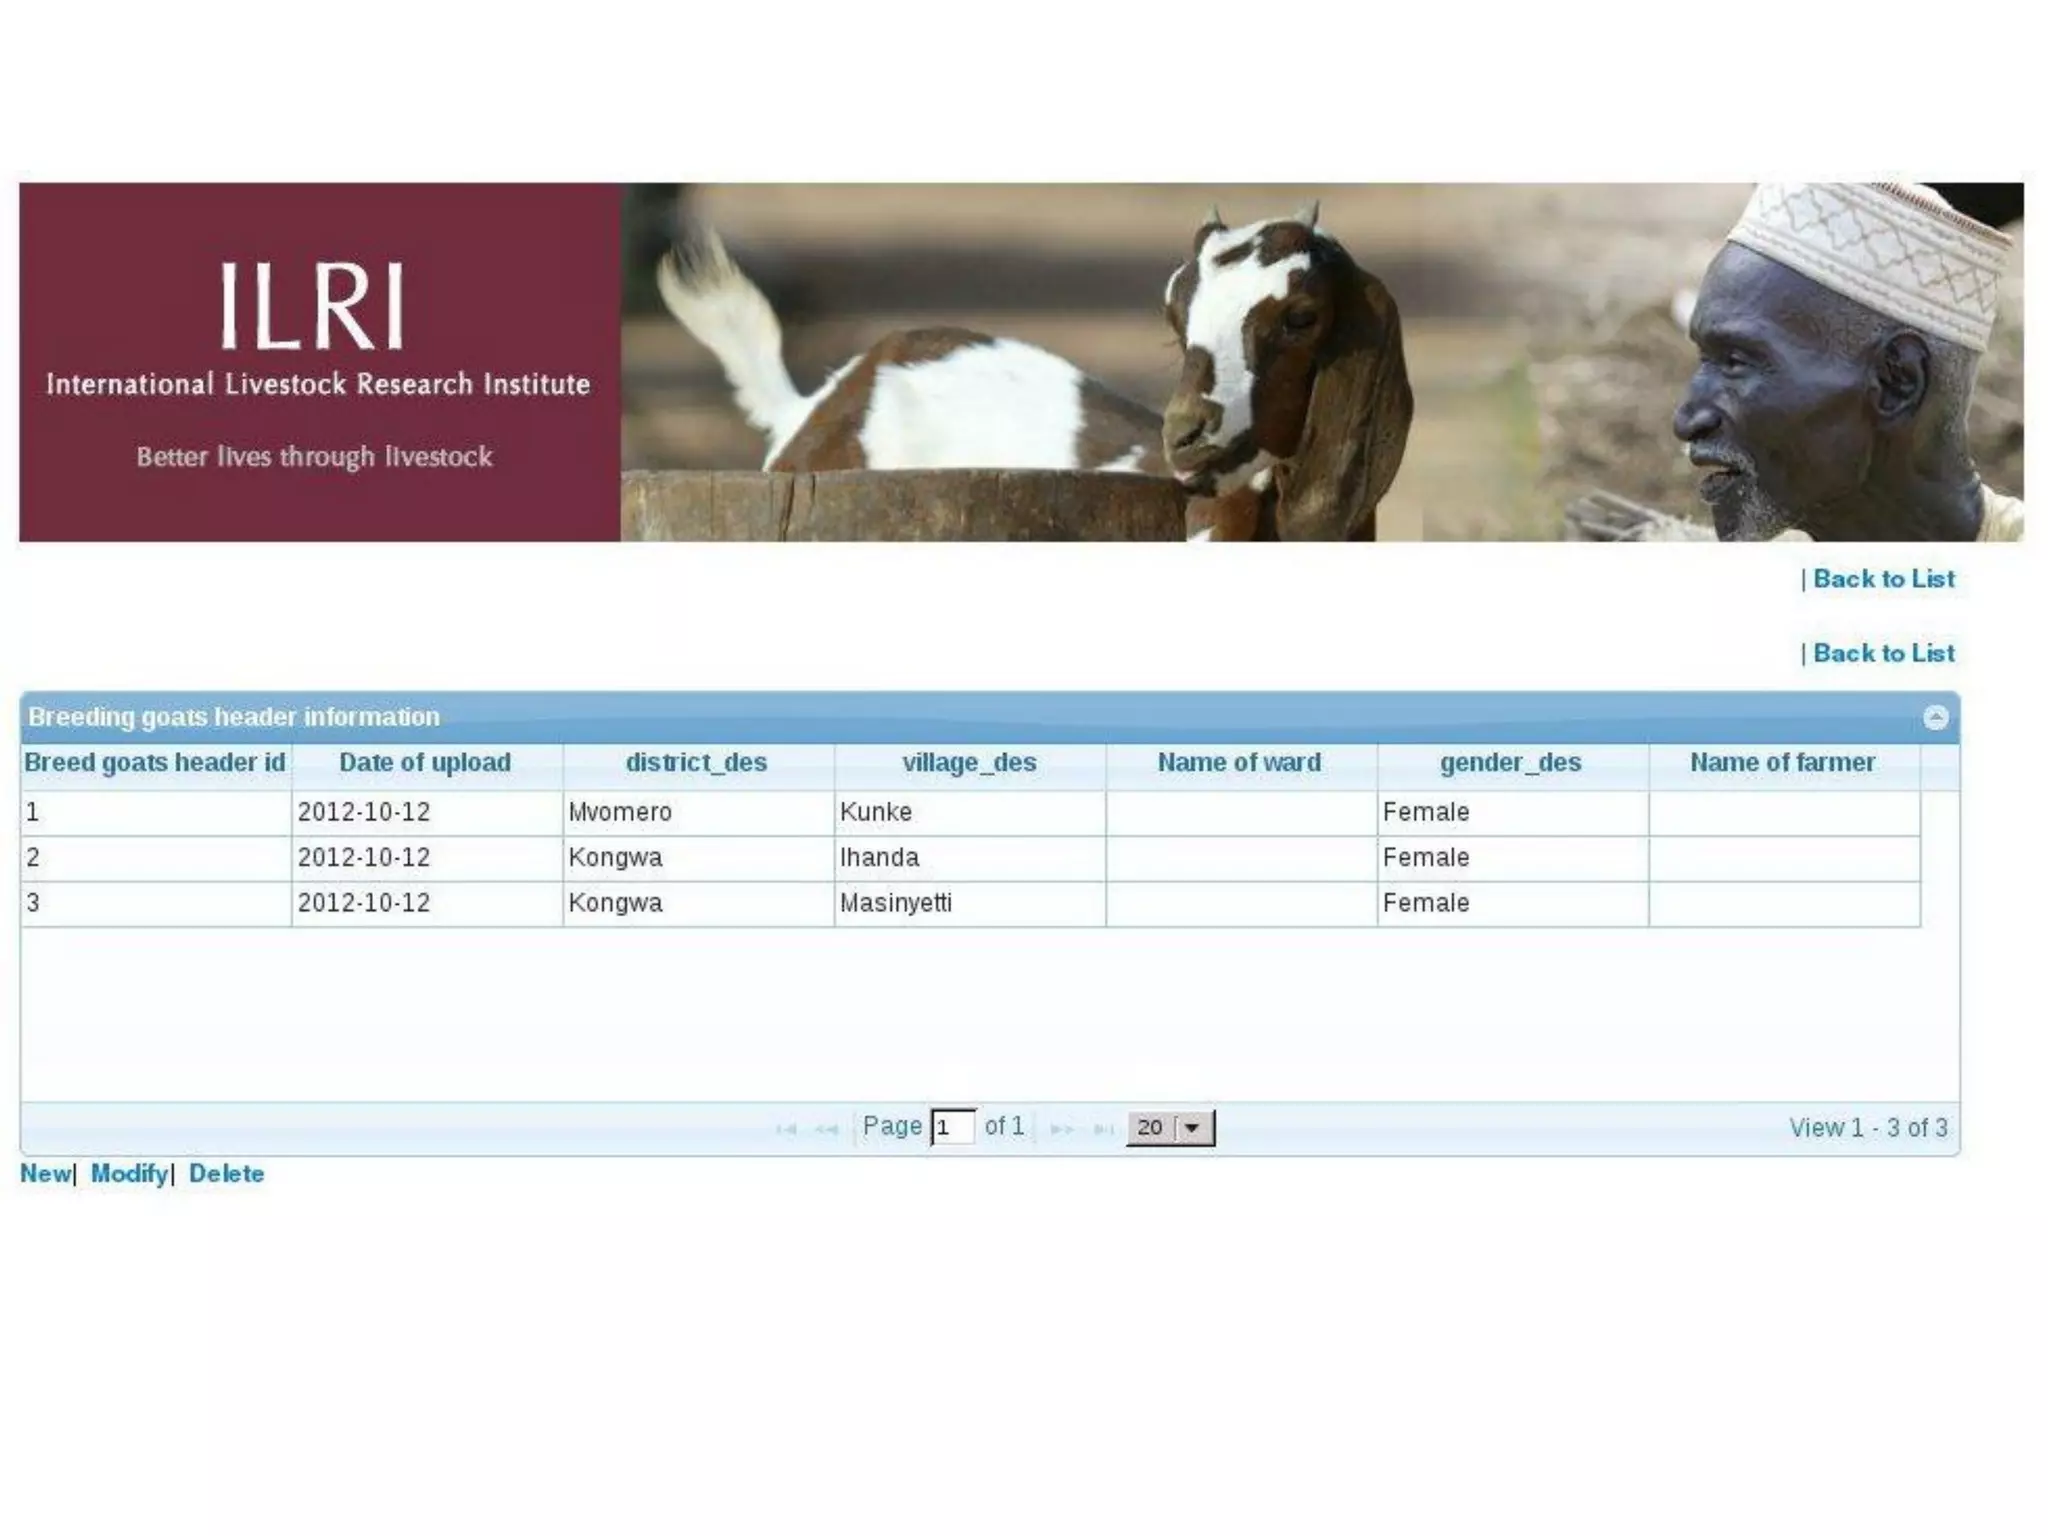
Tool used to collect breeding data
CGP TANZANIA : BREEDING ACTIVITIES, GROWTH PERFORMANCE
DISTRICT Kongwa DISICT CODE KW WARD VILLAGE Ihanda
District District Village Name of the Sex of Dam Breed of the dam Sire Date of Type of Sex of kid Birth Kid
Code Farmer farmer Number Number kidding kidding (s) weight Number
(Twin,
Triplets,
Single)
Kongwa KW Ihanda Farmer x 1=Male 348 3 = Norwegian 1639 05/08/2012 1=Single 2=Female 3.0 18451
Kongwa KW Ihanda Farmer y 2=Female 466 3 = Norwegian 1639 28/07/2012 1=Single 2=Female 18452
Kongwa KW Ihanda Farmer z 2=Female 464 3 = Norwegian 01/09/2012 2=Twin 2=Female 3.0 18498
Kongwa KW Ihanda Farmer a 2=Female 464 3 = Norwegian 01/09/2012 2=Twin 1=Male 3.0 18499
Kongwa KW Ihanda Farmer b 1=Male 350 3 = Norwegian 422 11/08/2012 1=Single 1=Male 2.7 18500
Kongwa KW Ihanda Farmer c 1=Male 417 2=Toggenburg (Exotic ‐ milk) 27/07/2012 1=Single 1=Male 2.5 18453
Frequency of collecting information: Seasonaly
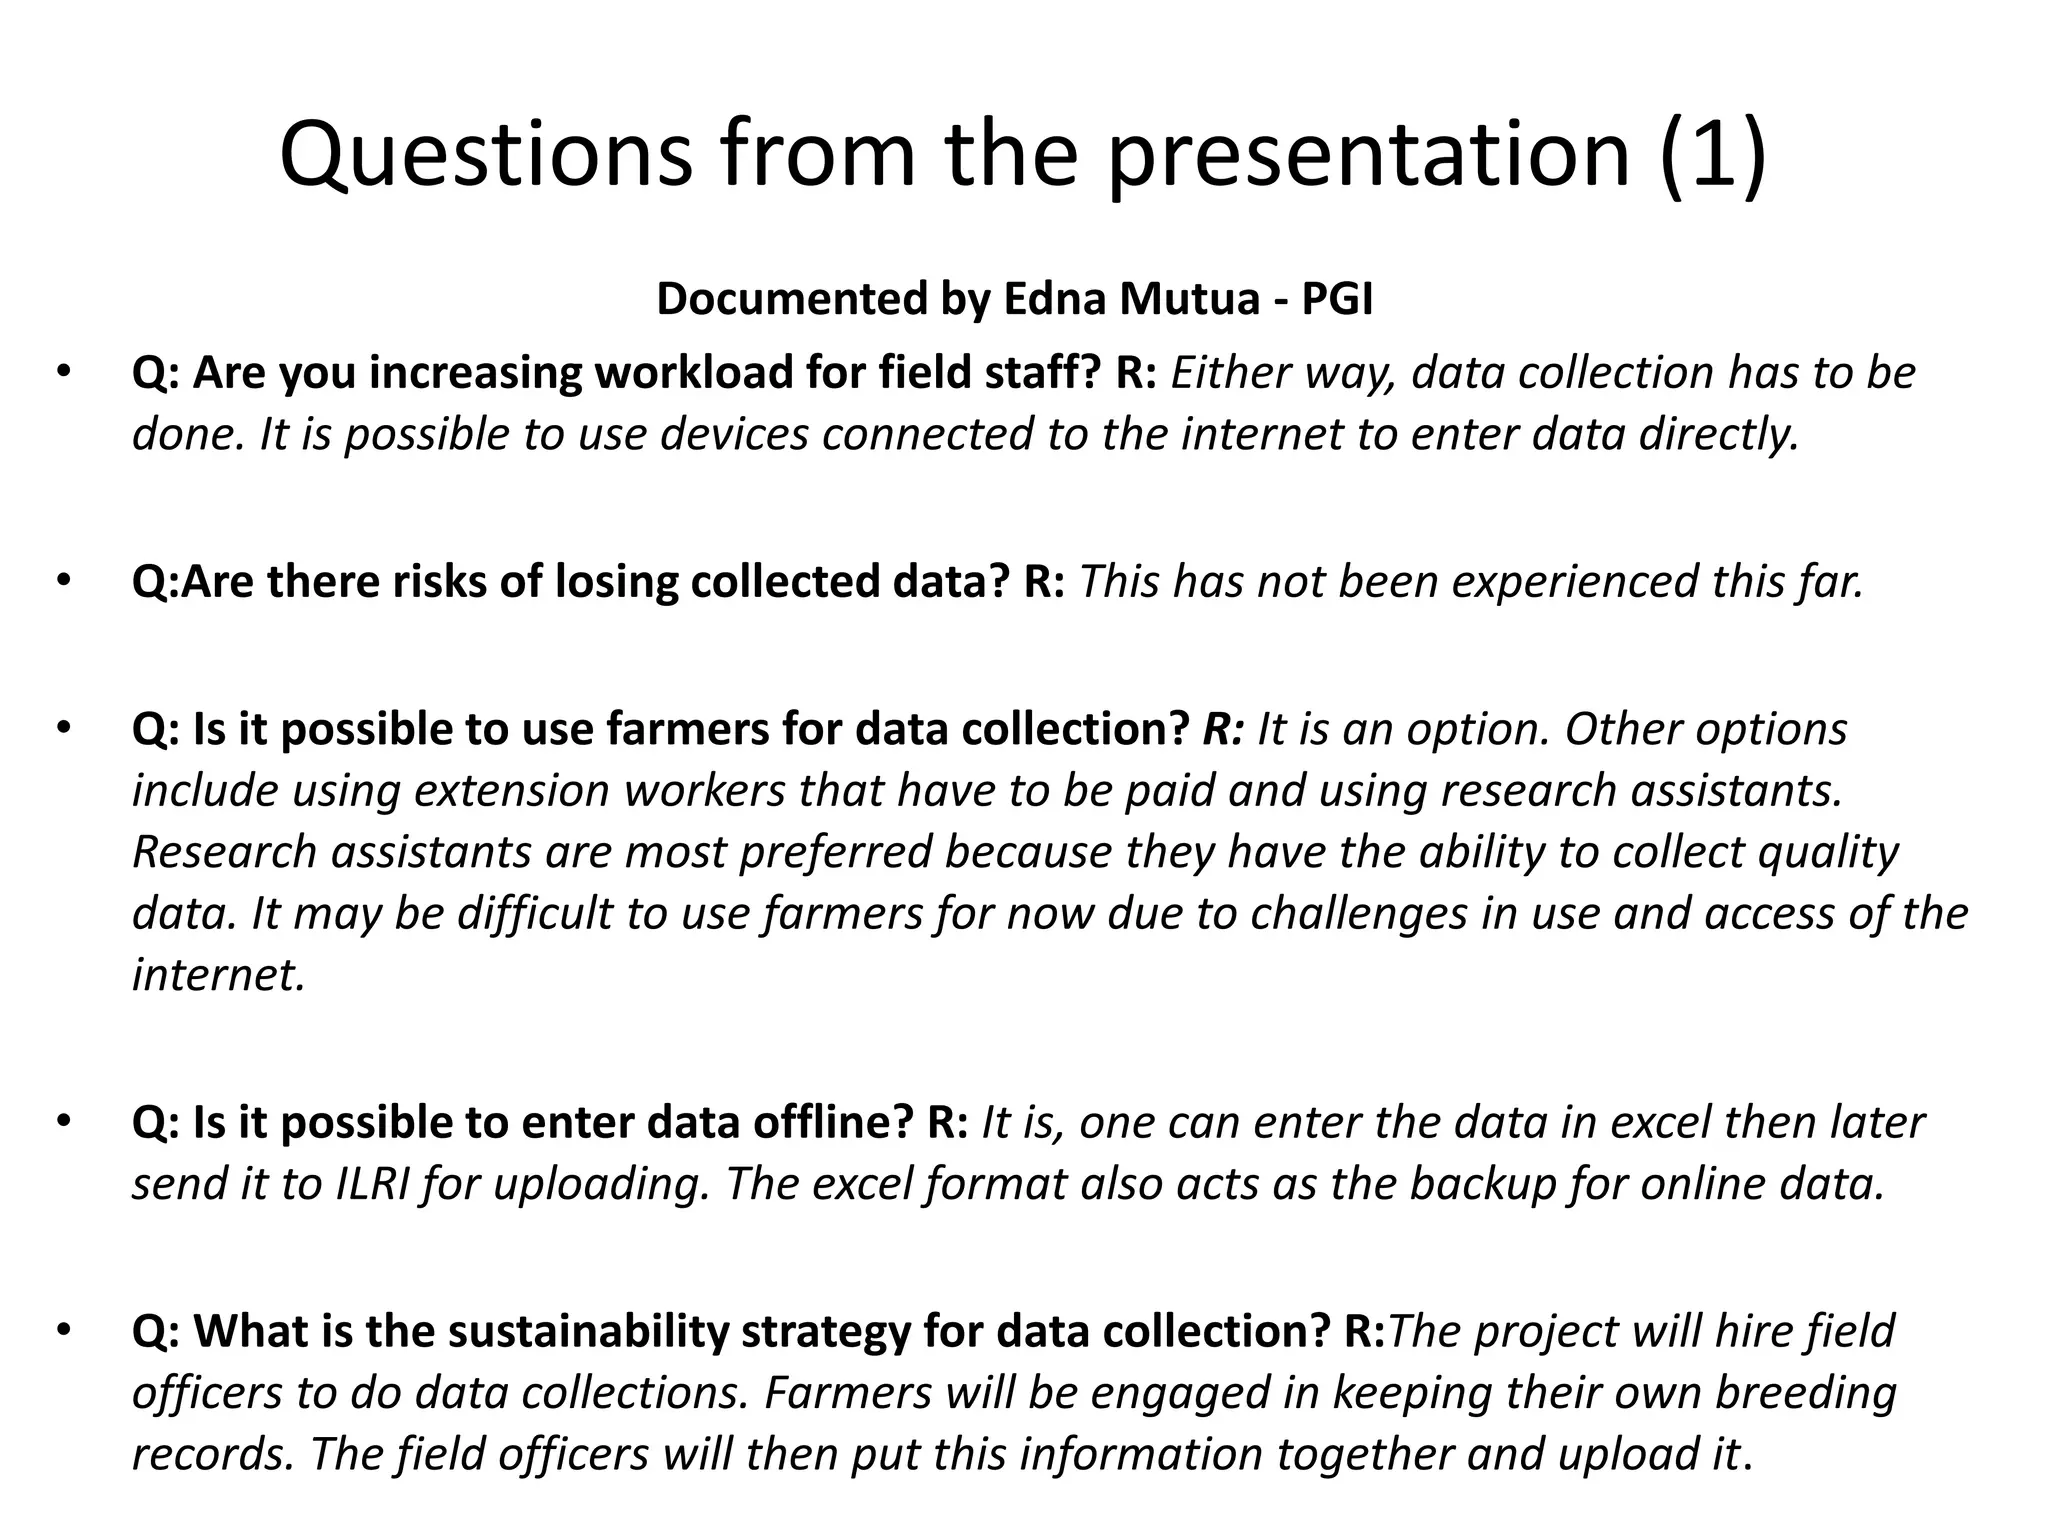
Questions from thepresentation (1)
Documented by Edna Mutua - PGI
• Q: Are you increasing workload for field staff? R: Either way, data collection has to be
done. It is possible to use devices connected to the internet to enter data directly.
• Q:Are there risks of losing collected data? R: This has not been experienced this far.
• Q: Is it possible to use farmers for data collection? R: It is an option. Other options
include using extension workers that have to be paid and using research assistants.
Research assistants are most preferred because they have the ability to collect quality
data. It may be difficult to use farmers for now due to challenges in use and access of the
internet.
• Q: Is it possible to enter data offline? R: It is, one can enter the data in excel then later
send it to ILRI for uploading. The excel format also acts as the backup for online data.
• Q: What is the sustainability strategy for data collection? R:The project will hire field
officers to do data collections. Farmers will be engaged in keeping their own breeding
records. The field officers will then put this information together and upload it.
25.
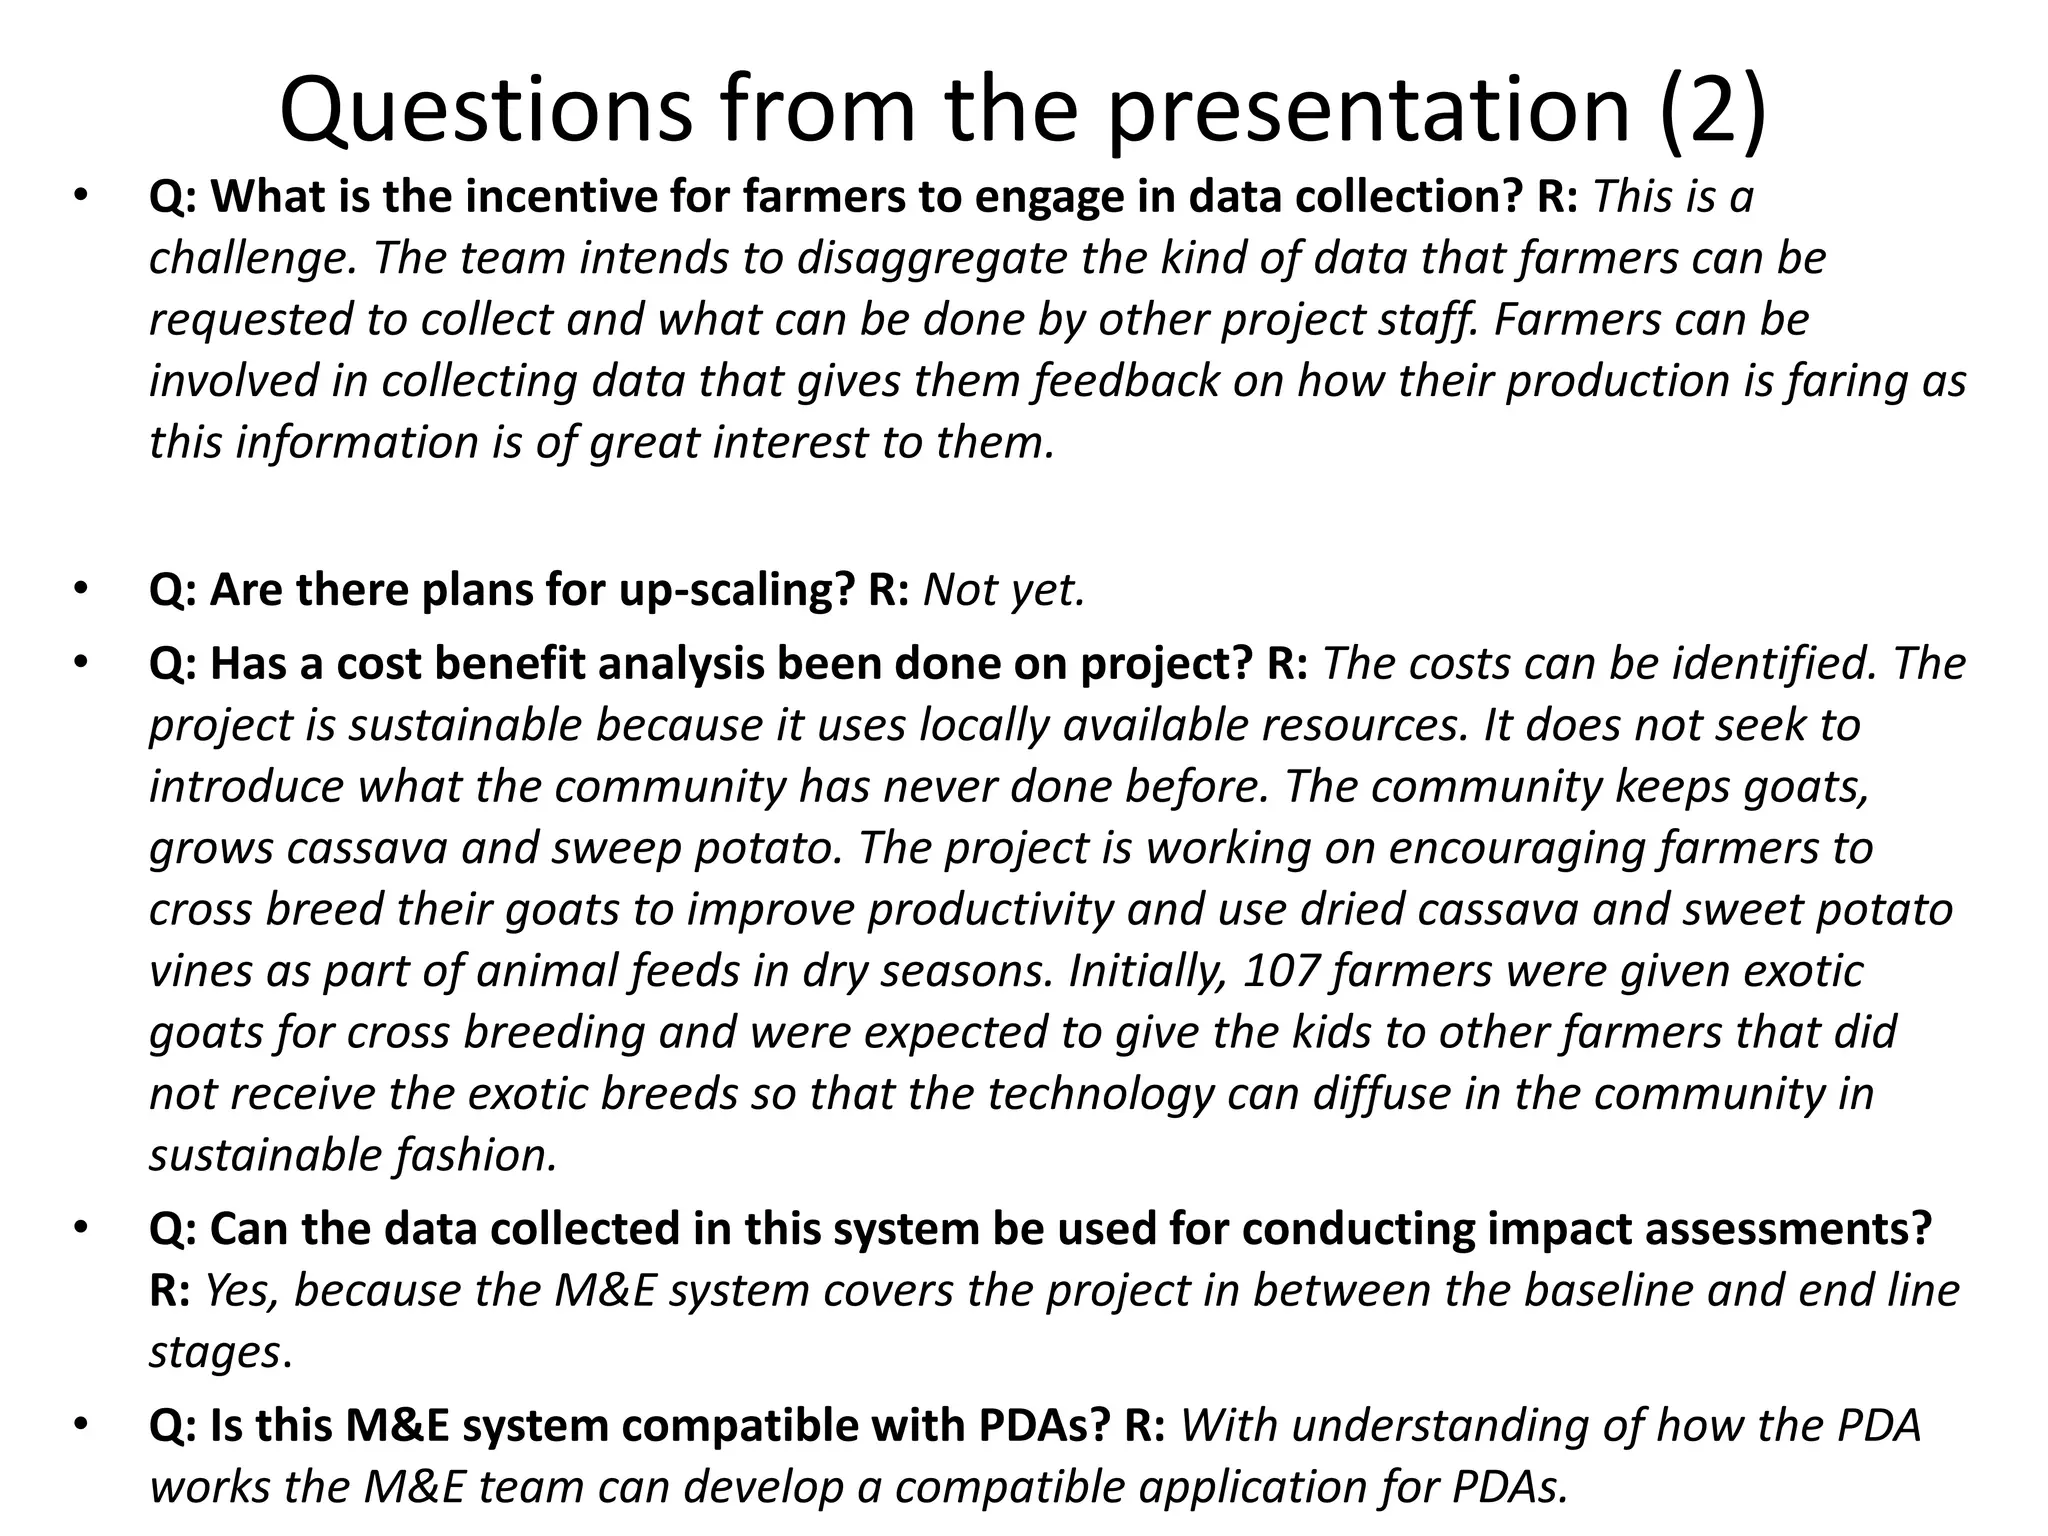
Questions from thepresentation (2)
• Q: What is the incentive for farmers to engage in data collection? R: This is a
challenge. The team intends to disaggregate the kind of data that farmers can be
requested to collect and what can be done by other project staff. Farmers can be
involved in collecting data that gives them feedback on how their production is faring as
this information is of great interest to them.
• Q: Are there plans for up-scaling? R: Not yet.
• Q: Has a cost benefit analysis been done on project? R: The costs can be identified. The
project is sustainable because it uses locally available resources. It does not seek to
introduce what the community has never done before. The community keeps goats,
grows cassava and sweep potato. The project is working on encouraging farmers to
cross breed their goats to improve productivity and use dried cassava and sweet potato
vines as part of animal feeds in dry seasons. Initially, 107 farmers were given exotic
goats for cross breeding and were expected to give the kids to other farmers that did
not receive the exotic breeds so that the technology can diffuse in the community in
sustainable fashion.
• Q: Can the data collected in this system be used for conducting impact assessments?
R: Yes, because the M&E system covers the project in between the baseline and end line
stages.
• Q: Is this M&E system compatible with PDAs? R: With understanding of how the PDA
works the M&E team can develop a compatible application for PDAs.