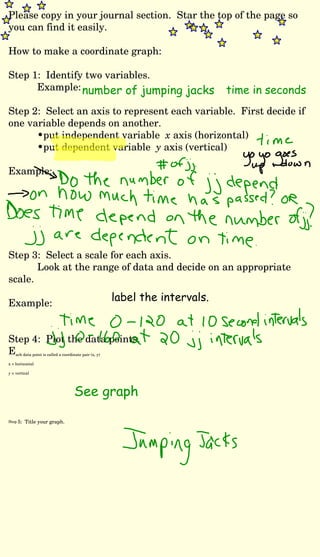
A genda Monday, Sept. 14, 2009 1.  Complete a self assessment of your glyph with the rubric in pencil.  G ive yourself a check for each category in pencil.  Turn in glyph. 2.  Variables & Patterns problem 1.2 How to make a coordinate graph 3.  Homework  2  V&P p. 15 # 1 - 3  you will need graph paper
What does a coordinate graph look like? What is the purpose of a coordinate graph? How do you locate points on a coordinate graph?
Please copy in your journal section.  Star the top of the page so you can find it easily. How to make a coordinate graph: Step 1:  Identify two variables. Example:  Step 2:  Select an axis to represent each variable.  First decide if one variable depends on another. • put independent variable  x  axis (horizontal) • put dependent variable  y  axis (vertical) Example: Step 3:  Select a scale for each axis.  Look at the range of data and decide on an appropriate scale.  Example:  Step 4:  Plot the data points.  E ach data point is called a coordinate pair (x, y) x = horizontal y = vertical Step  5:  Title your graph. number of jumping jacks time in seconds label the intervals. See graph
 
Complete Problem 1.2 on p. 9  with your partner.  Label a piece of graph paper for a new journal page: V&P  1.2  9/14 Use your jumping jack data.
Summarizing questions Which variable is on the x-axis? Why? What is the least value on the x-axis?  What is the greatest value on the x-axis? What scale did you use?  Why? What is the size of the interval on the x-axis?  Why? Which variable is on the y-axis? What is the least value on the y-axis?  What is the greatest value on the y-axis? What scale did you use?  Why? What is the size of the interval on the y-axis?  Why?
Homework: 2  V&P p. 15 # 1 - 3  - you will need a piece of graph paper
Attachments

Variables & Patterns 1.2

  • 1.
    A genda Monday,Sept. 14, 2009 1. Complete a self assessment of your glyph with the rubric in pencil. G ive yourself a check for each category in pencil. Turn in glyph. 2. Variables & Patterns problem 1.2 How to make a coordinate graph 3. Homework 2 V&P p. 15 # 1 - 3 you will need graph paper
  • 2.
    What does acoordinate graph look like? What is the purpose of a coordinate graph? How do you locate points on a coordinate graph?
  • 3.
    Please copy inyour journal section. Star the top of the page so you can find it easily. How to make a coordinate graph: Step 1: Identify two variables. Example: Step 2: Select an axis to represent each variable. First decide if one variable depends on another. • put independent variable x axis (horizontal) • put dependent variable y axis (vertical) Example: Step 3: Select a scale for each axis. Look at the range of data and decide on an appropriate scale. Example: Step 4: Plot the data points. E ach data point is called a coordinate pair (x, y) x = horizontal y = vertical Step 5: Title your graph. number of jumping jacks time in seconds label the intervals. See graph
  • 4.
  • 5.
    Complete Problem 1.2on p. 9 with your partner. Label a piece of graph paper for a new journal page: V&P 1.2 9/14 Use your jumping jack data.
  • 6.
    Summarizing questions Whichvariable is on the x-axis? Why? What is the least value on the x-axis? What is the greatest value on the x-axis? What scale did you use? Why? What is the size of the interval on the x-axis? Why? Which variable is on the y-axis? What is the least value on the y-axis? What is the greatest value on the y-axis? What scale did you use? Why? What is the size of the interval on the y-axis? Why?
  • 7.
    Homework: 2 V&P p. 15 # 1 - 3 - you will need a piece of graph paper
  • 8.