This document discusses different visualization techniques for tracking project progress:
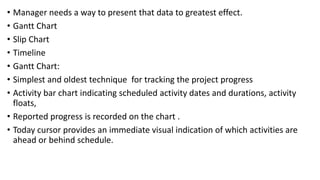
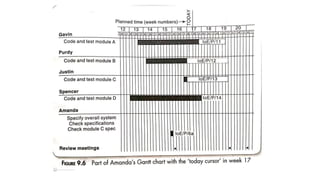
- A Gantt chart provides a simple bar chart to track scheduled activity dates, durations, floats, and reported progress. The today cursor indicates which activities are ahead or behind schedule.
- A slip chart more clearly shows activities that are not progressing as scheduled, with greater slippage bending the slip line more. A very jagged slip line indicates a need to reschedule.
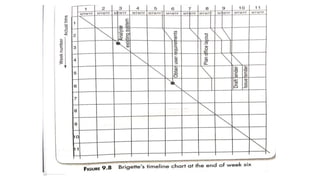
- A timeline chart displays how targets have changed over the project duration, with planned time on the horizontal axis and elapsed time on the vertical. Meandering lines represent changing scheduled completion dates. Timelines are useful for execution and post-project review.