Planning a Project
•Define Goals
• Develop Tasks
• Establish Timeframes
• Resource Availability?
• Organize
5.
Managing and Trackinga
Project
• Track Progress
– Are the tasks being completed on time?
– Is one task holding up the whole project?
• Manage Finances
– Is the project going to stay within the budget?
6.
Using MS Project
•Define the Project
• Build the Plan
– Set a start date
– Enter tasks/durations
– Assign resources
– Link tasks
– Fine tune the plan
7.
Using MS Project(cont’d)
• Track and Manage
– Set a baseline
– Enter actuals
– Adjust plan
• Close Project
8.
Defining the Project
•The objective of the project should be
defined by the person/group that is going to
manage the project.
• Tasks, start times, and deadlines should be
clearly established.
9.
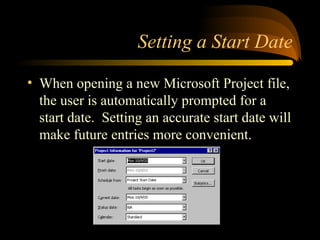
Setting a StartDate
• When opening a new Microsoft Project file,
the user is automatically prompted for a
start date. Setting an accurate start date will
make future entries more convenient.
10.
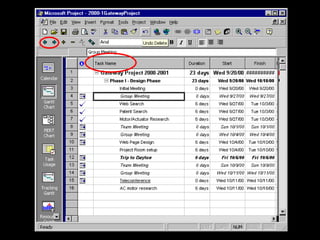
Entering Tasks andDurations
• Tasks are entered in the “Task Name”
column
• Subtasks are created by indenting a task.
• Durations may be entered in number of
working days or start and finish dates may
be used
12.
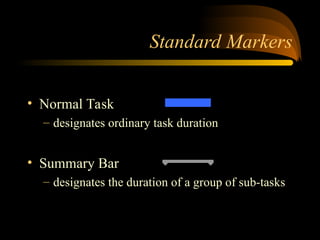
Standard Markers
• NormalTask
– designates ordinary task duration
• Summary Bar
– designates the duration of a group of sub-tasks
13.
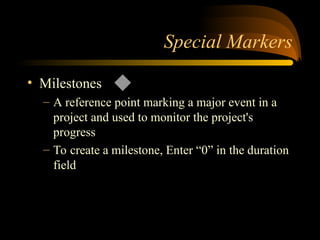
Special Markers
• Milestones
–A reference point marking a major event in a
project and used to monitor the project's
progress
– To create a milestone, Enter “0” in the duration
field
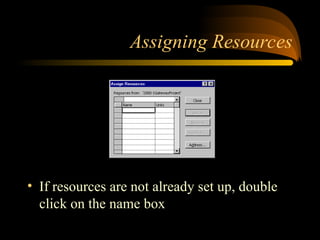
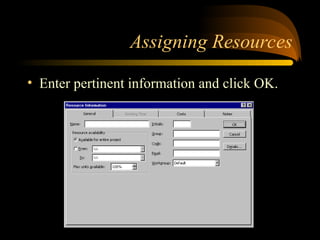
Assigning Resources
• Aresource can be a single person, a piece
of equipment, or it can represent a group,
such as Plumbers
• Information on resources include
Availability, Costs, and Working Time
• Resources are very important in accurate
scheduling
16.
Assigning Resources
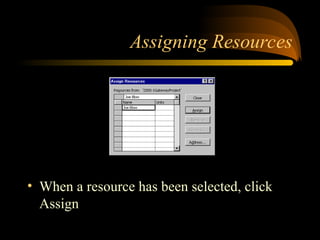
• ToAssign a Resource:
– Select the task to which you want to assign the
resource
– Click the Assign Resources button on the
toolbar
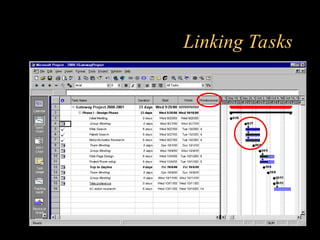
Linking Tasks
• Sometasks require that another task be
completed before it can begin. These tasks
must be linked.
• Tasks and subtasks are linked by assigning
Predecessors.
21.
Linking Tasks
• Predecessor
–A task that must start or finish before another
task can start or finish
• Successor
– A task that cannot start or finish until another
task starts or finishes
– A task becomes a successor when a row
number is entered in the predecessor column
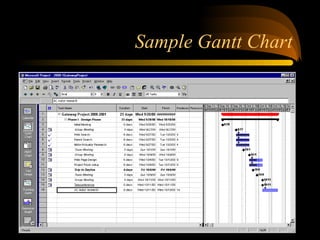
Fine Tune thePlan
• When all resources have been assigned and
appropriate tasks are linked, the original
Gantt chart will be complete
• Check to make sure tasks have been linked
correctly and task durations are correct
• The project is now ready to begin
24.
Set a Baseline
•A baseline compares your original plan for
the project with the actual course of the
project.
• You can see which tasks started earlier or
later than planned, exceeded their original
budget, took longer than planned, and so
on.
25.
Set a Baseline
•Create a baseline after you've polished it
and just before you actually start work on
the project
• To track costs, be sure to enter cost
information before you create the baseline
• Updates can easily be made to the baseline
if information is missing
26.
Set a Baseline
•The Baseline plan includes:
– Tasks (start and finish dates, duration, work,
cost, splits, timephased work, and timephased
cost)
– Resources (work, cost, timephased work, and
timephased cost)
– Assignments (start and finish dates, work, cost,
timephased work, and timephased cost)
27.
Set a Baseline
•To set a baseline:
– Point to Tracking on the Tools menu
– Click Save Baseline
28.
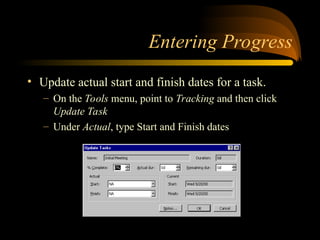
Entering Progress
• Updateactual start and finish dates for a task.
– On the Tools menu, point to Tracking and then click
Update Task
– Under Actual, type Start and Finish dates
29.
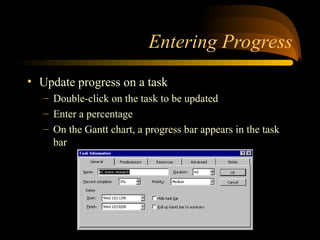
Entering Progress
• Updateprogress on a task
– Double-click on the task to be updated
– Enter a percentage
– On the Gantt chart, a progress bar appears in the task
bar
30.
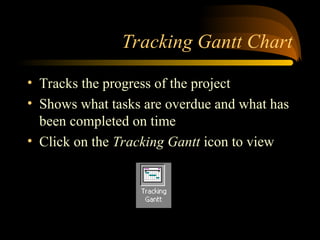
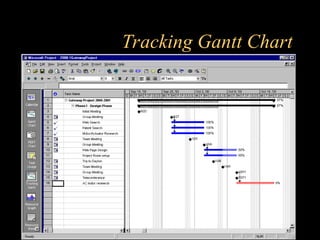
Tracking Gantt Chart
•Tracks the progress of the project
• Shows what tasks are overdue and what has
been completed on time
• Click on the Tracking Gantt icon to view
Tracking Progress
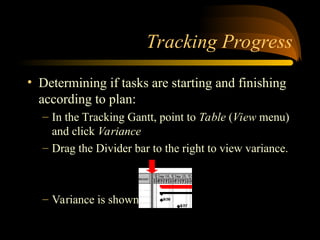
• Determiningif tasks are starting and finishing
according to plan:
– In the Tracking Gantt, point to Table (View menu)
and click Variance
– Drag the Divider bar to the right to view variance.
– Variance is shown in Days
33.
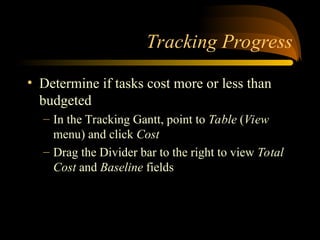
Tracking Progress
• Determineif tasks cost more or less than
budgeted
– In the Tracking Gantt, point to Table (View
menu) and click Cost
– Drag the Divider bar to the right to view Total
Cost and Baseline fields
34.
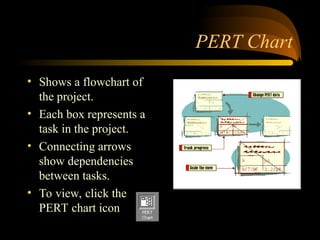
PERT Chart
• Showsa flowchart of
the project.
• Each box represents a
task in the project.
• Connecting arrows
show dependencies
between tasks.
• To view, click the
PERT chart icon
35.
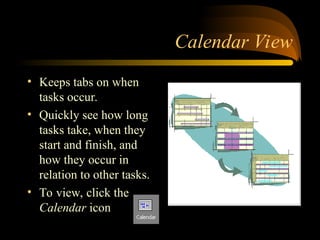
Calendar View
• Keepstabs on when
tasks occur.
• Quickly see how long
tasks take, when they
start and finish, and
how they occur in
relation to other tasks.
• To view, click the
Calendar icon
36.
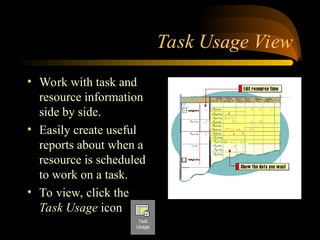
Task Usage View
•Work with task and
resource information
side by side.
• Easily create useful
reports about when a
resource is scheduled
to work on a task.
• To view, click the
Task Usage icon
37.
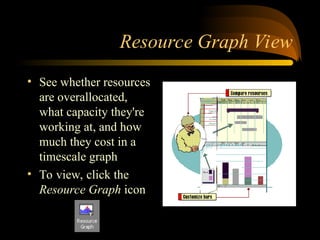
Resource Graph View
•See whether resources
are overallocated,
what capacity they're
working at, and how
much they cost in a
timescale graph
• To view, click the
Resource Graph icon
38.
More Views
• ResourceSheet View
– Easy way to review, add, edit data about
resources
• Resource Usage View
– Work with resource and task information side
by side
39.
The Project isNow Complete !!
• MS Project is a very powerful tool if it is
used correctly
• This program can save a lot of time for
engineers who are interested in time, cost,
etc.
• Automatically keeps your project
organized.