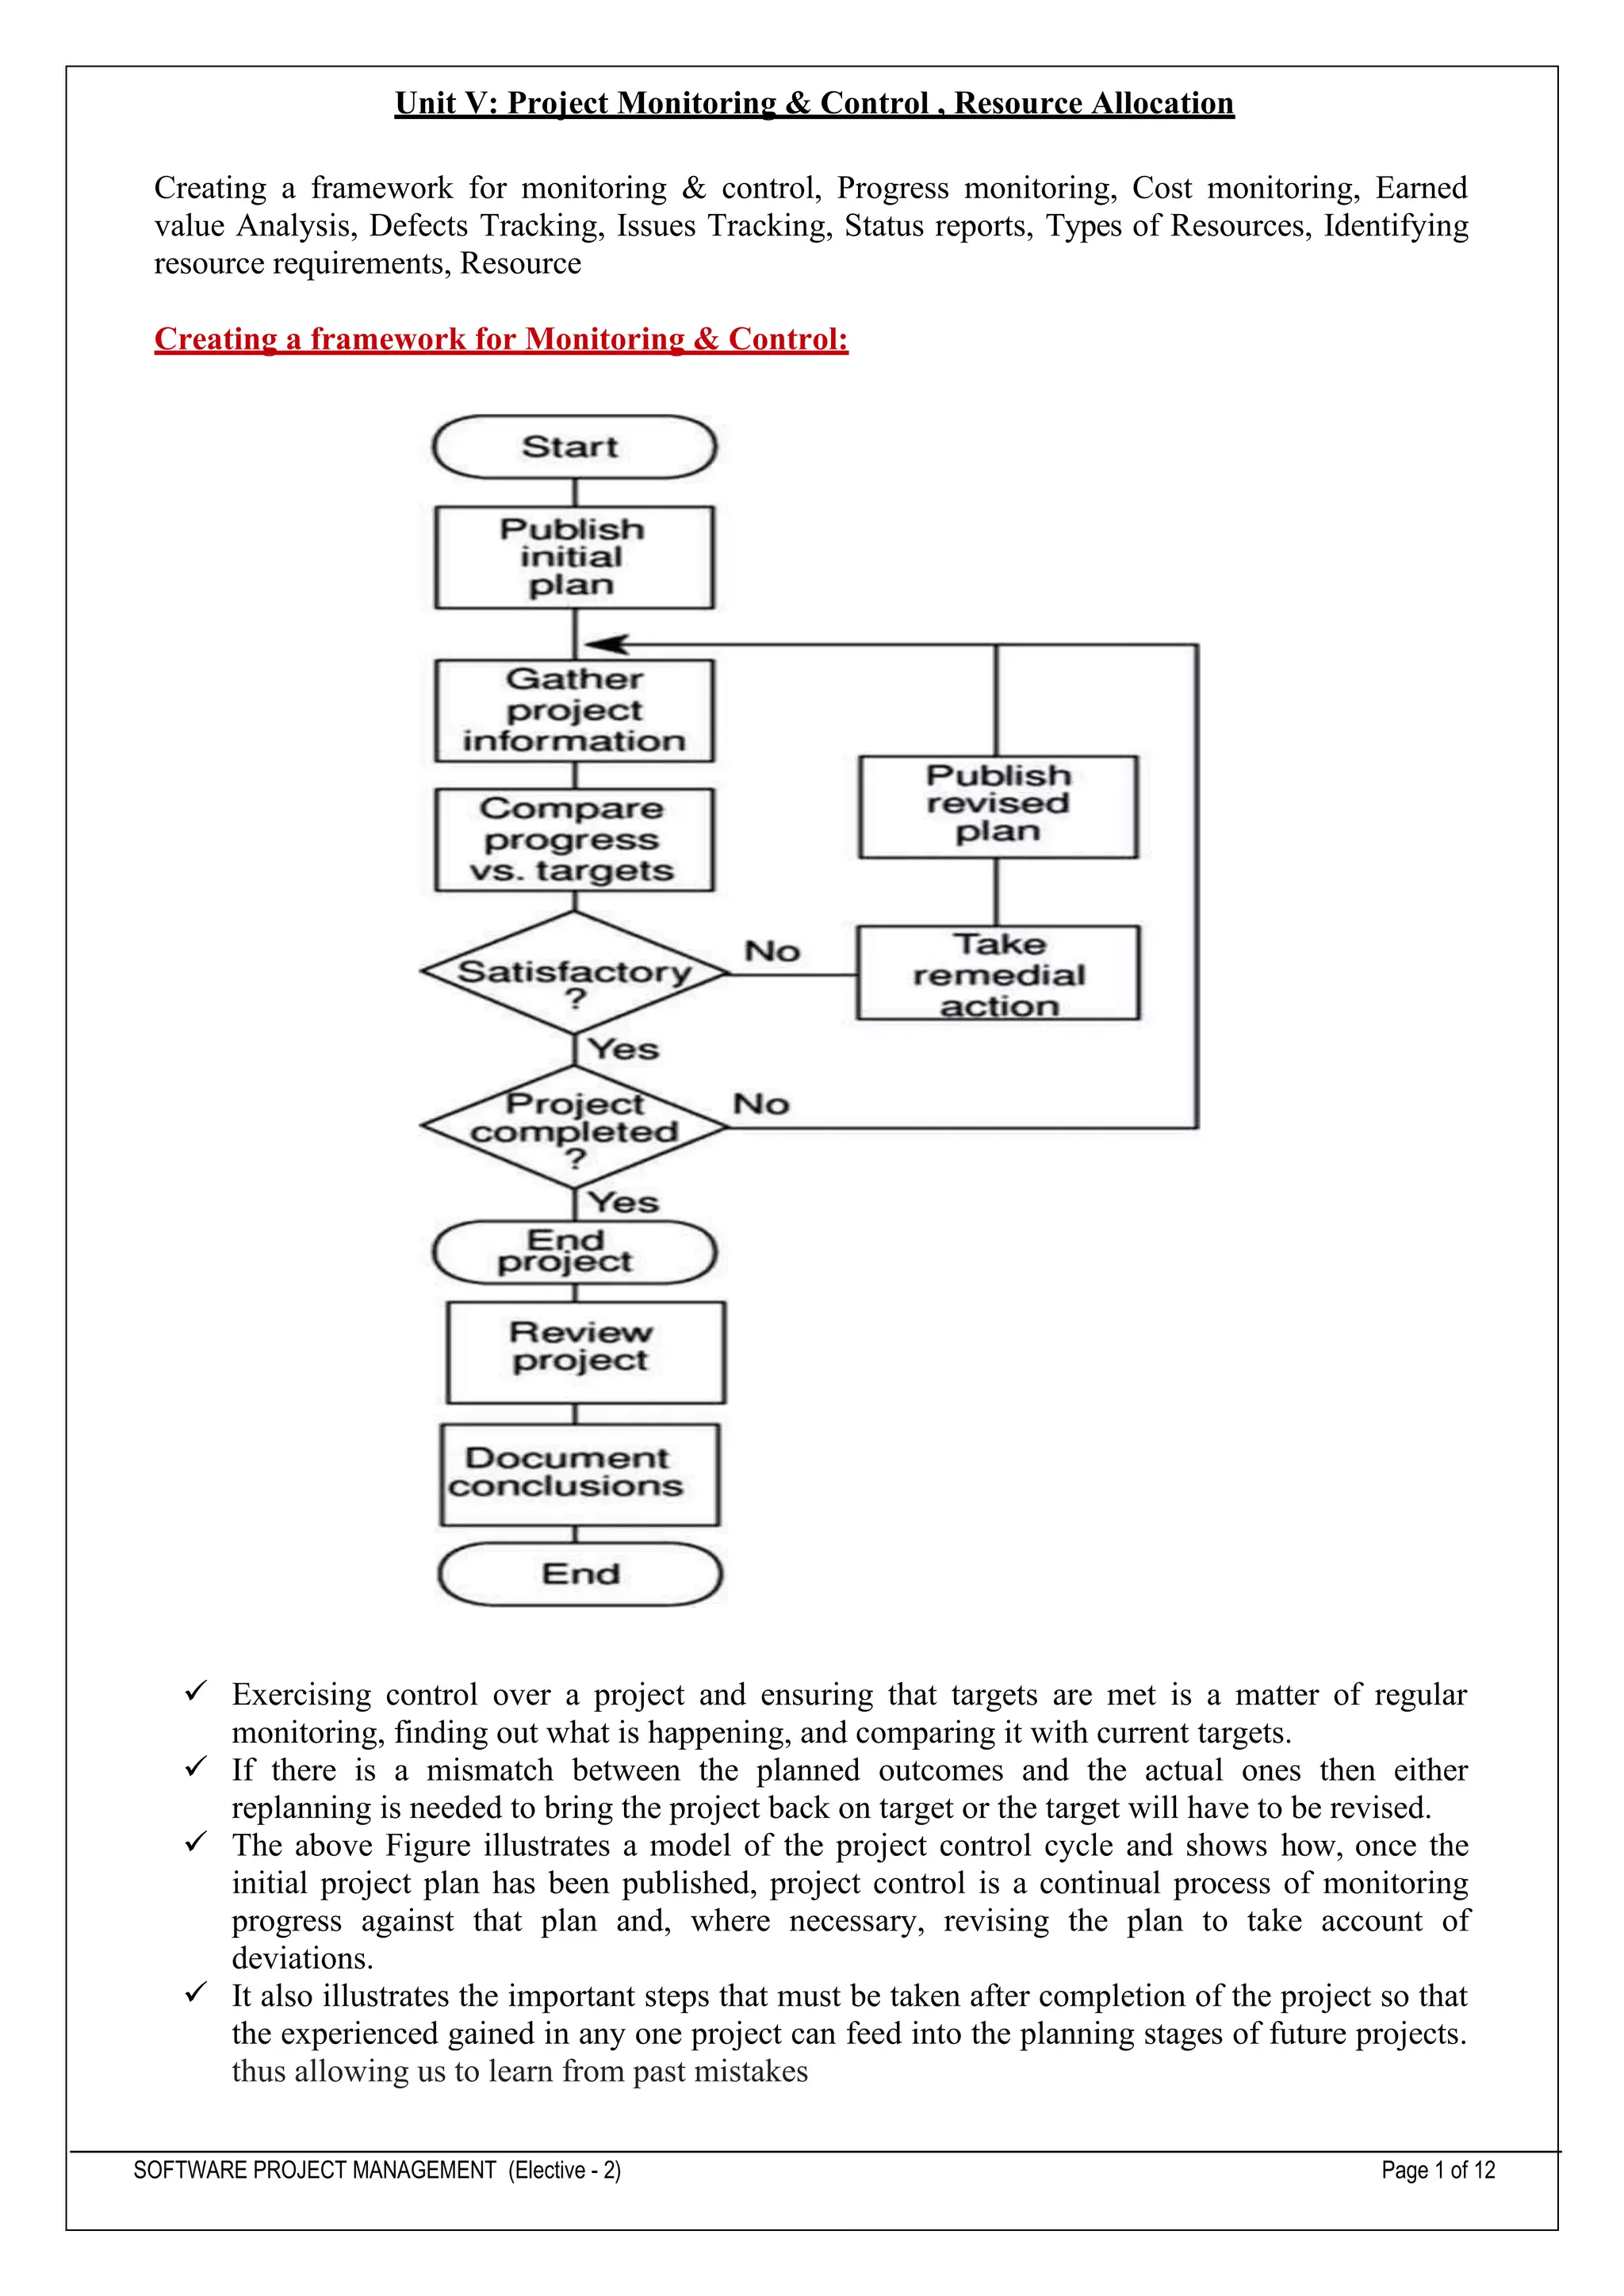
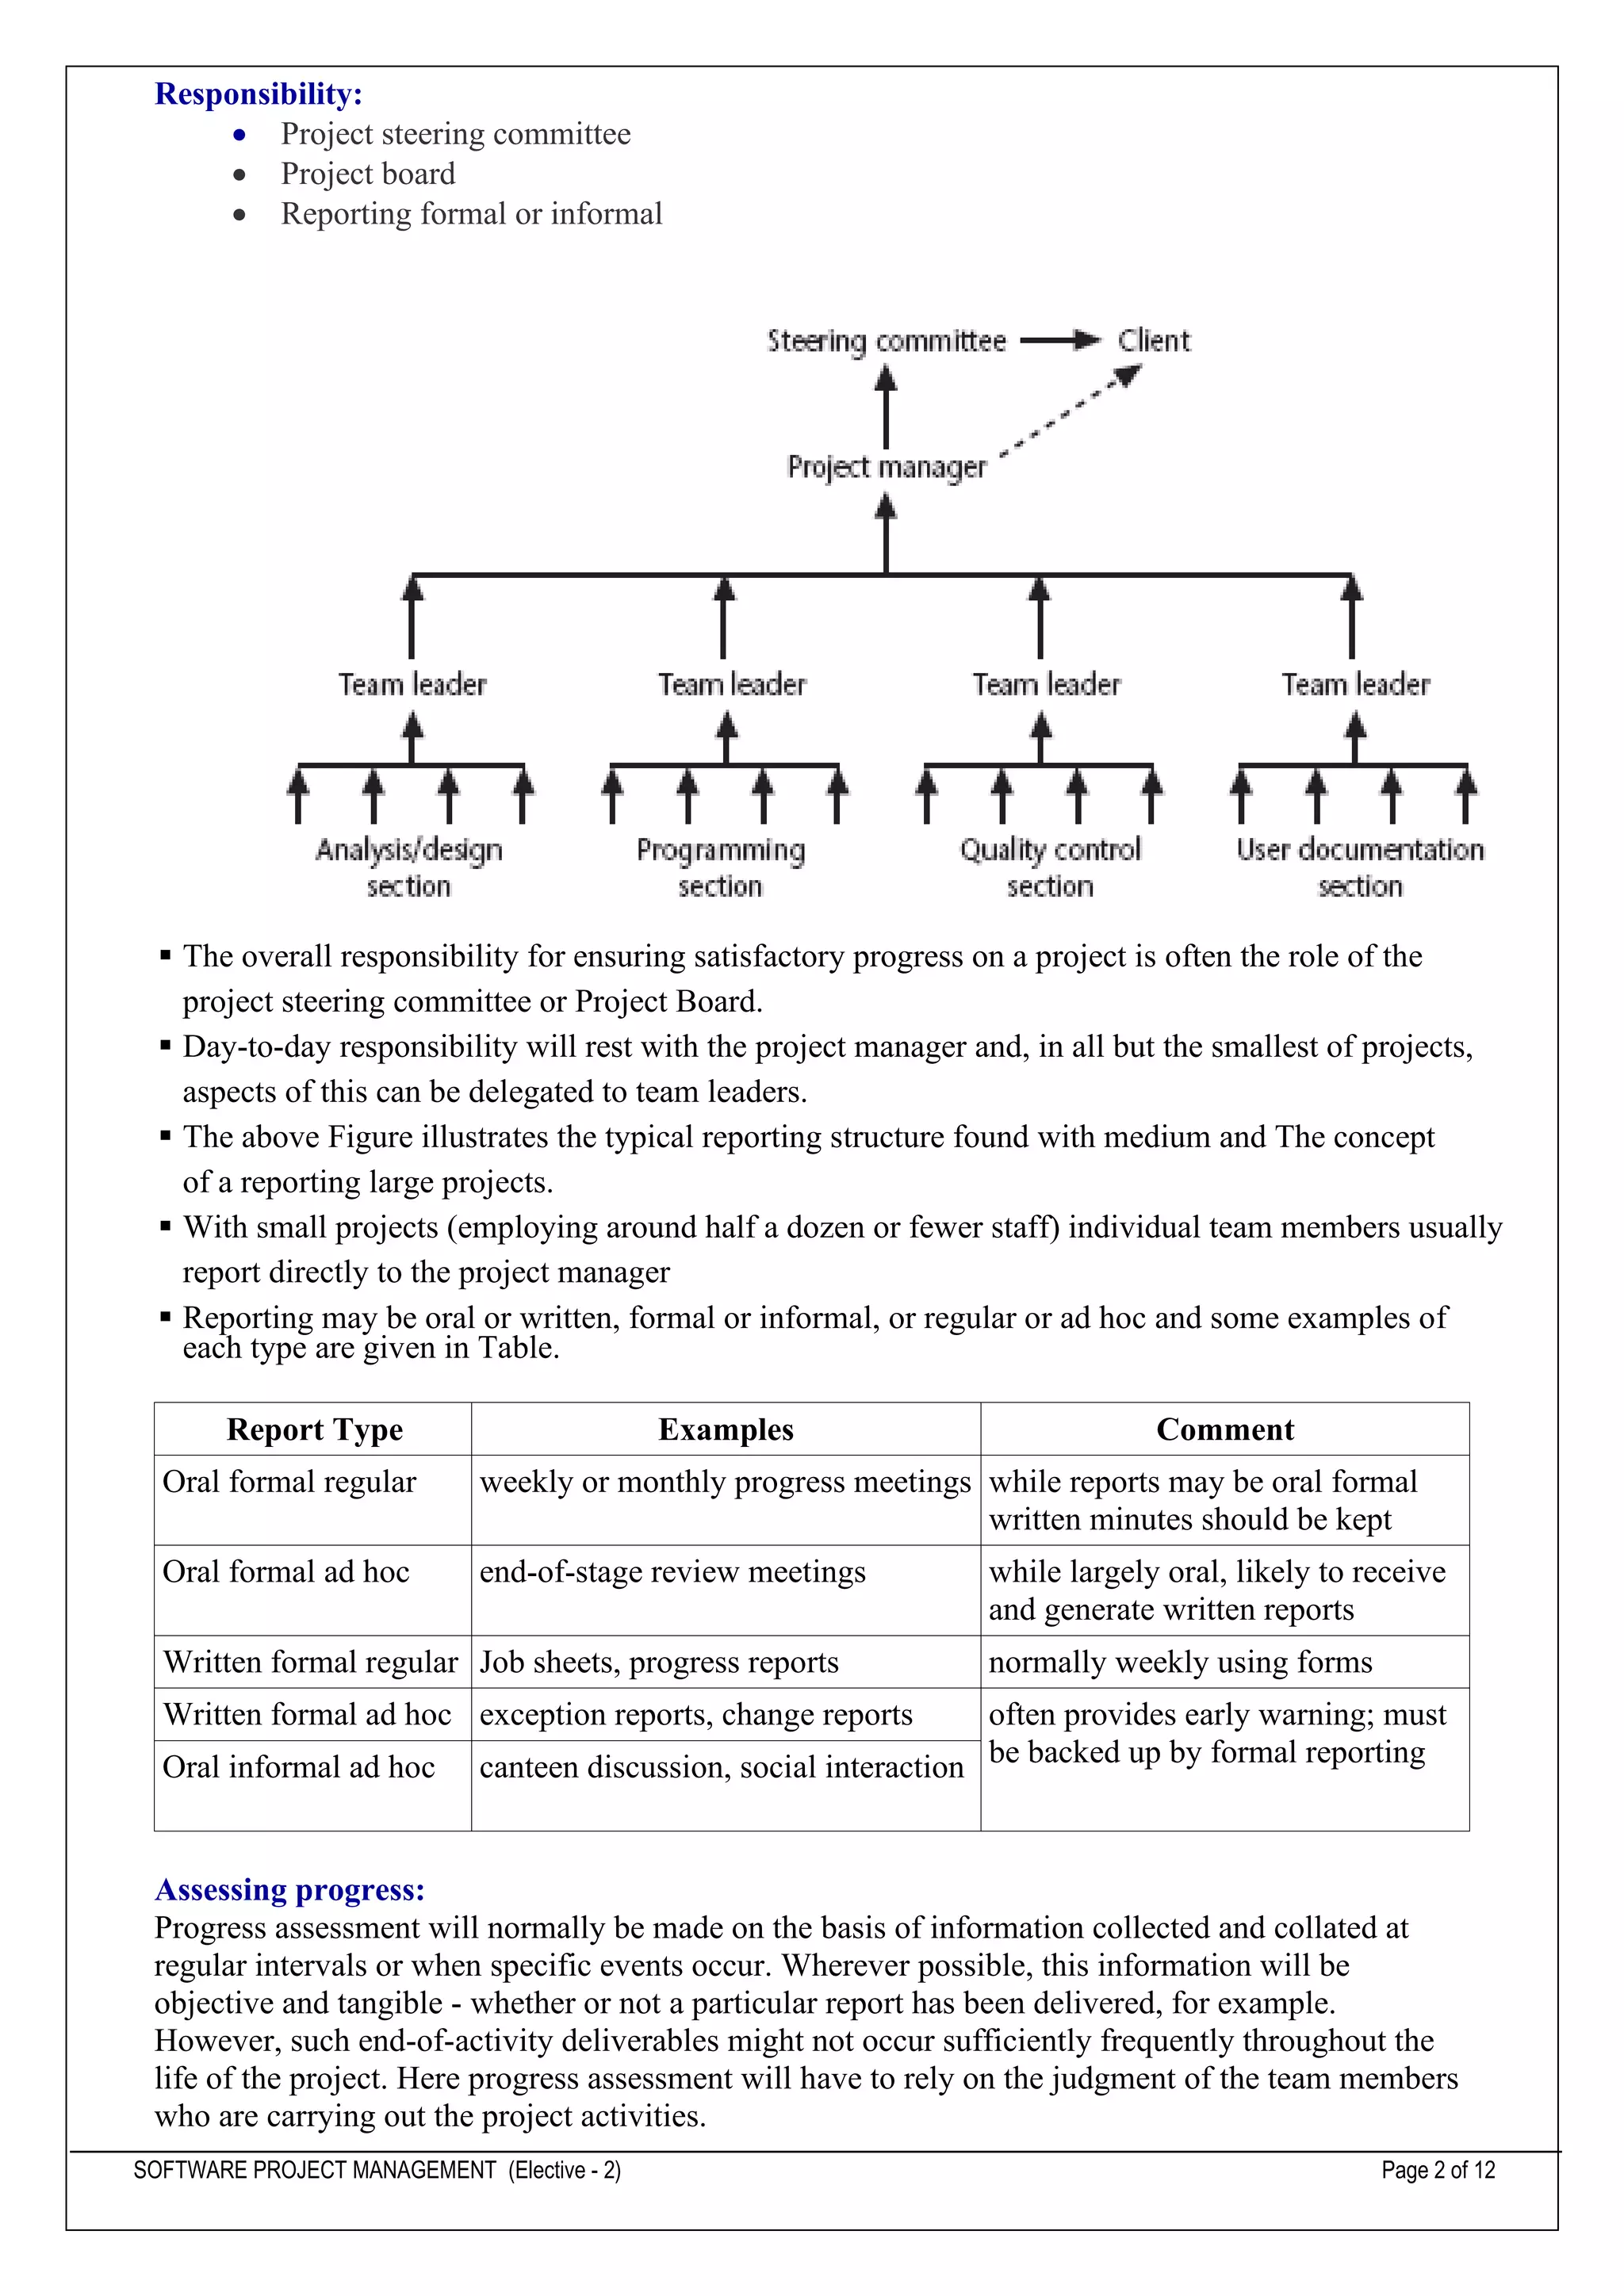
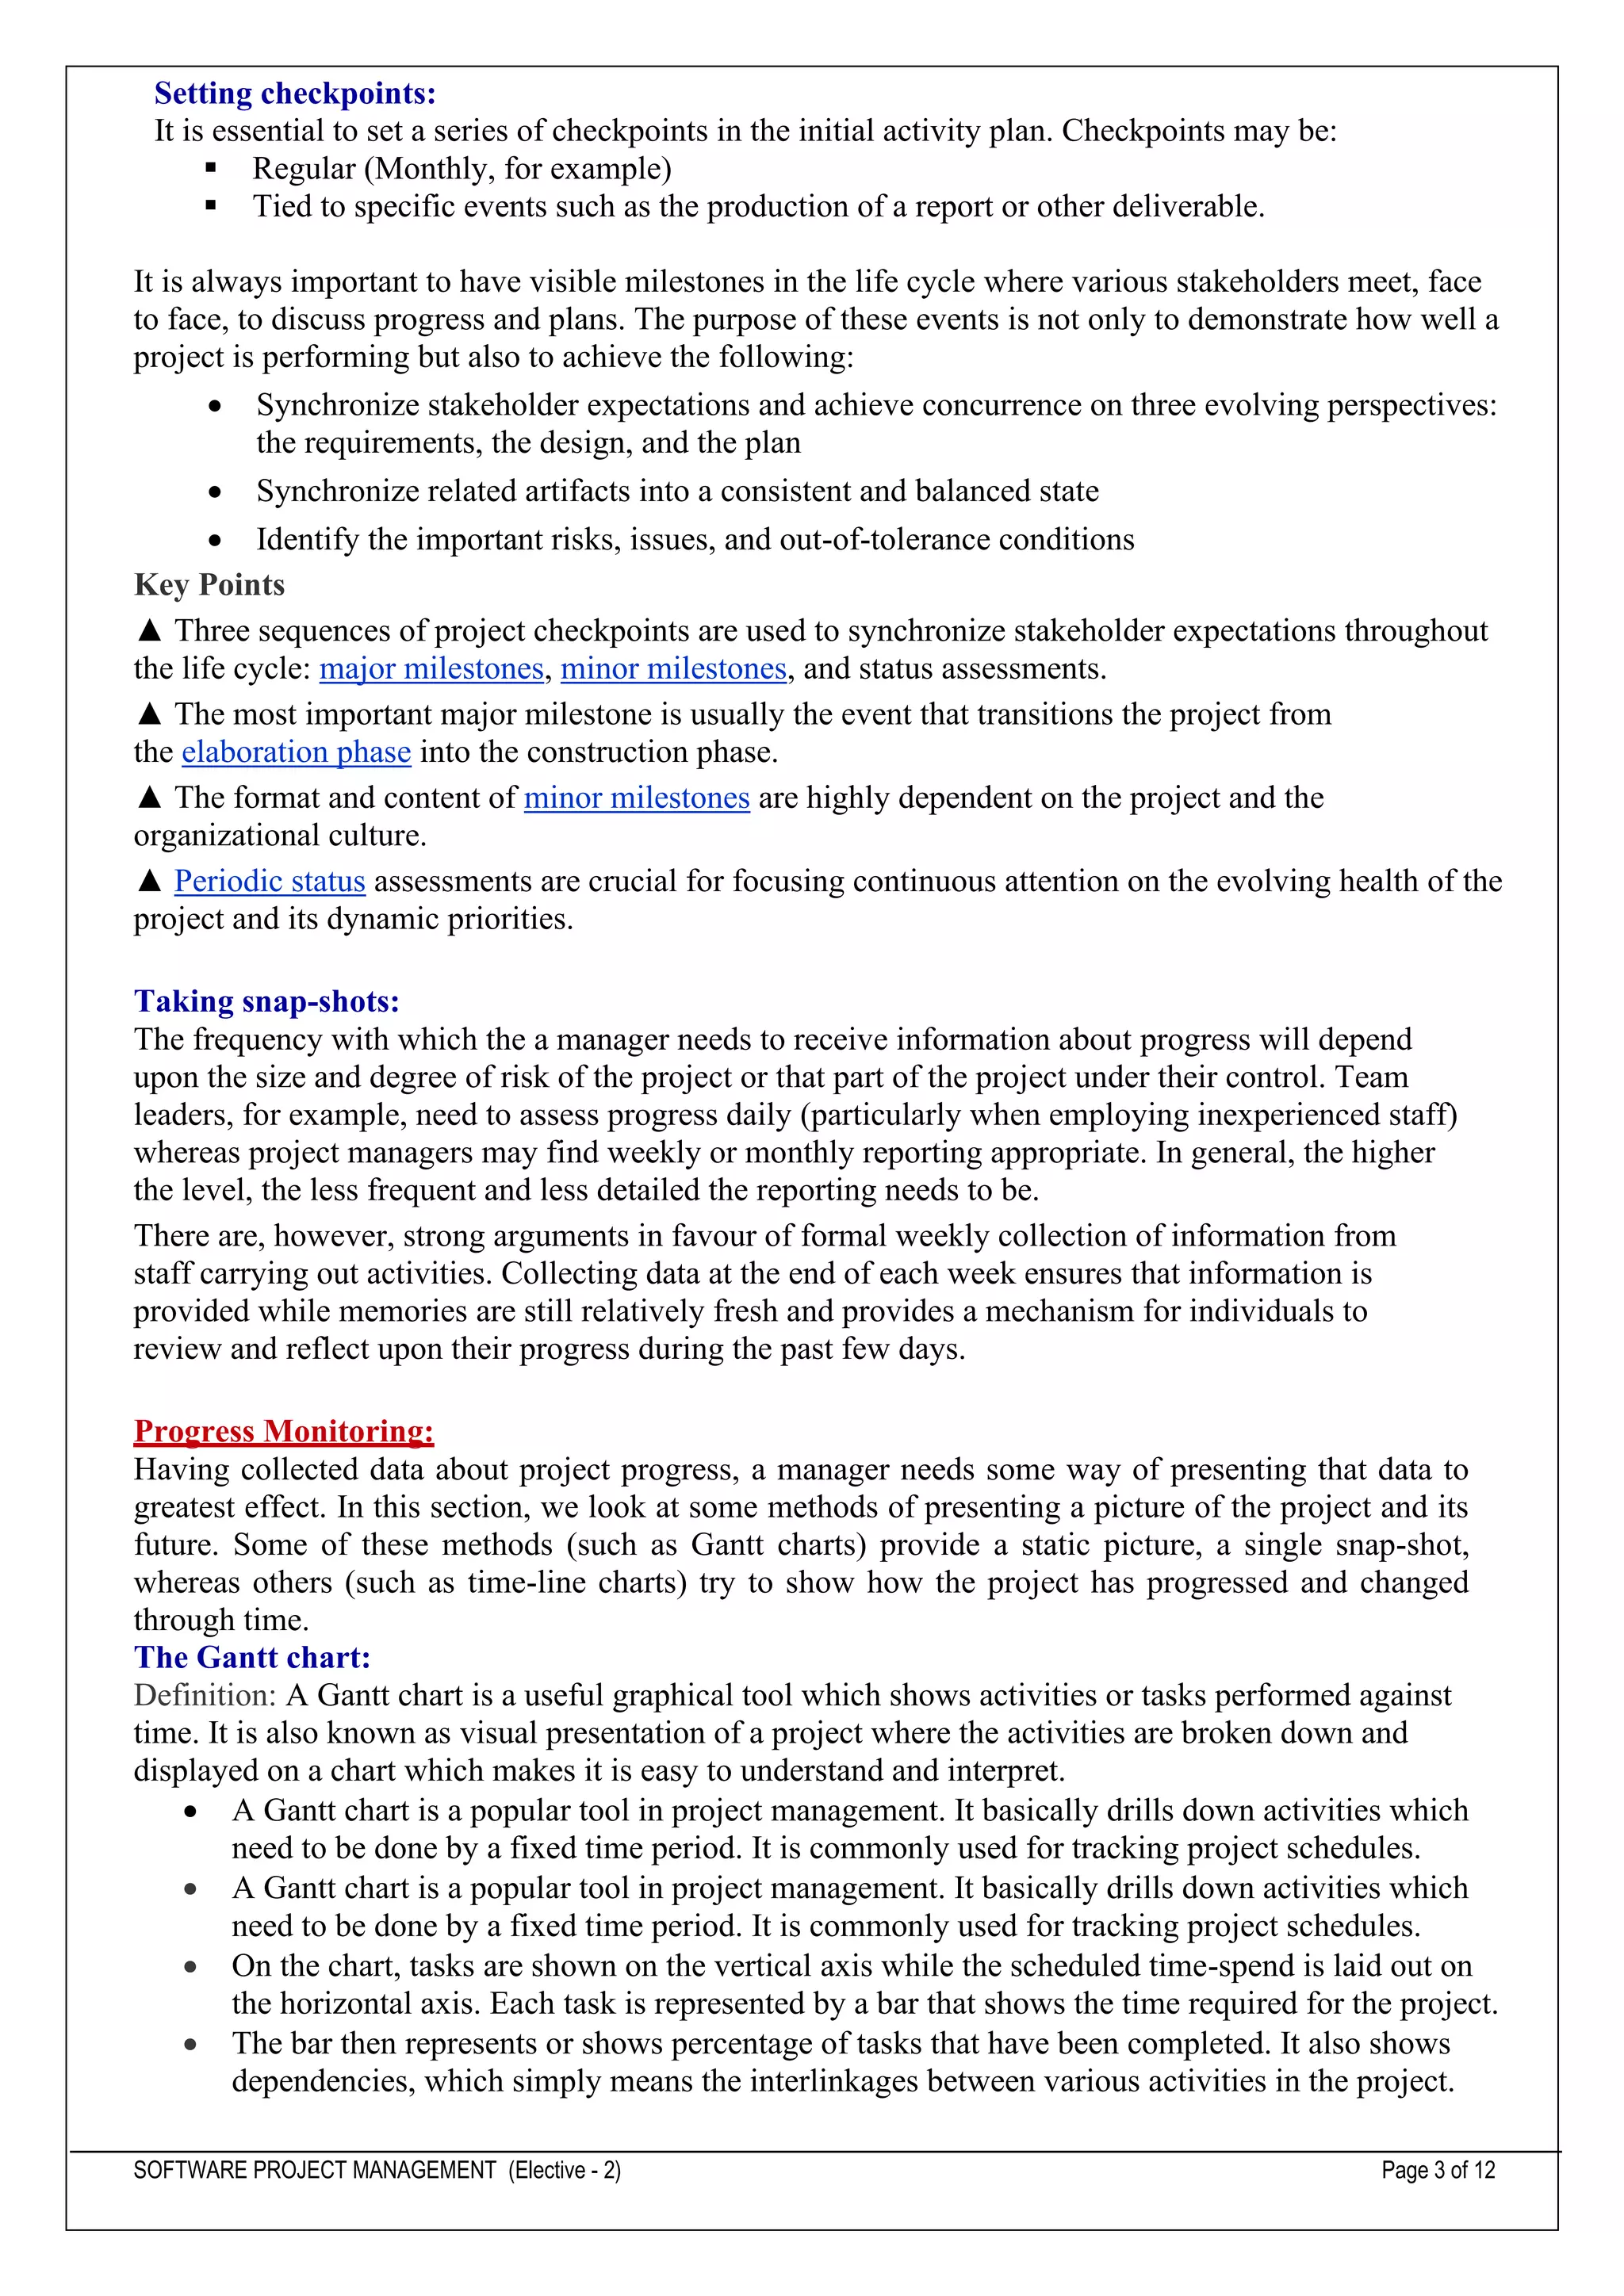
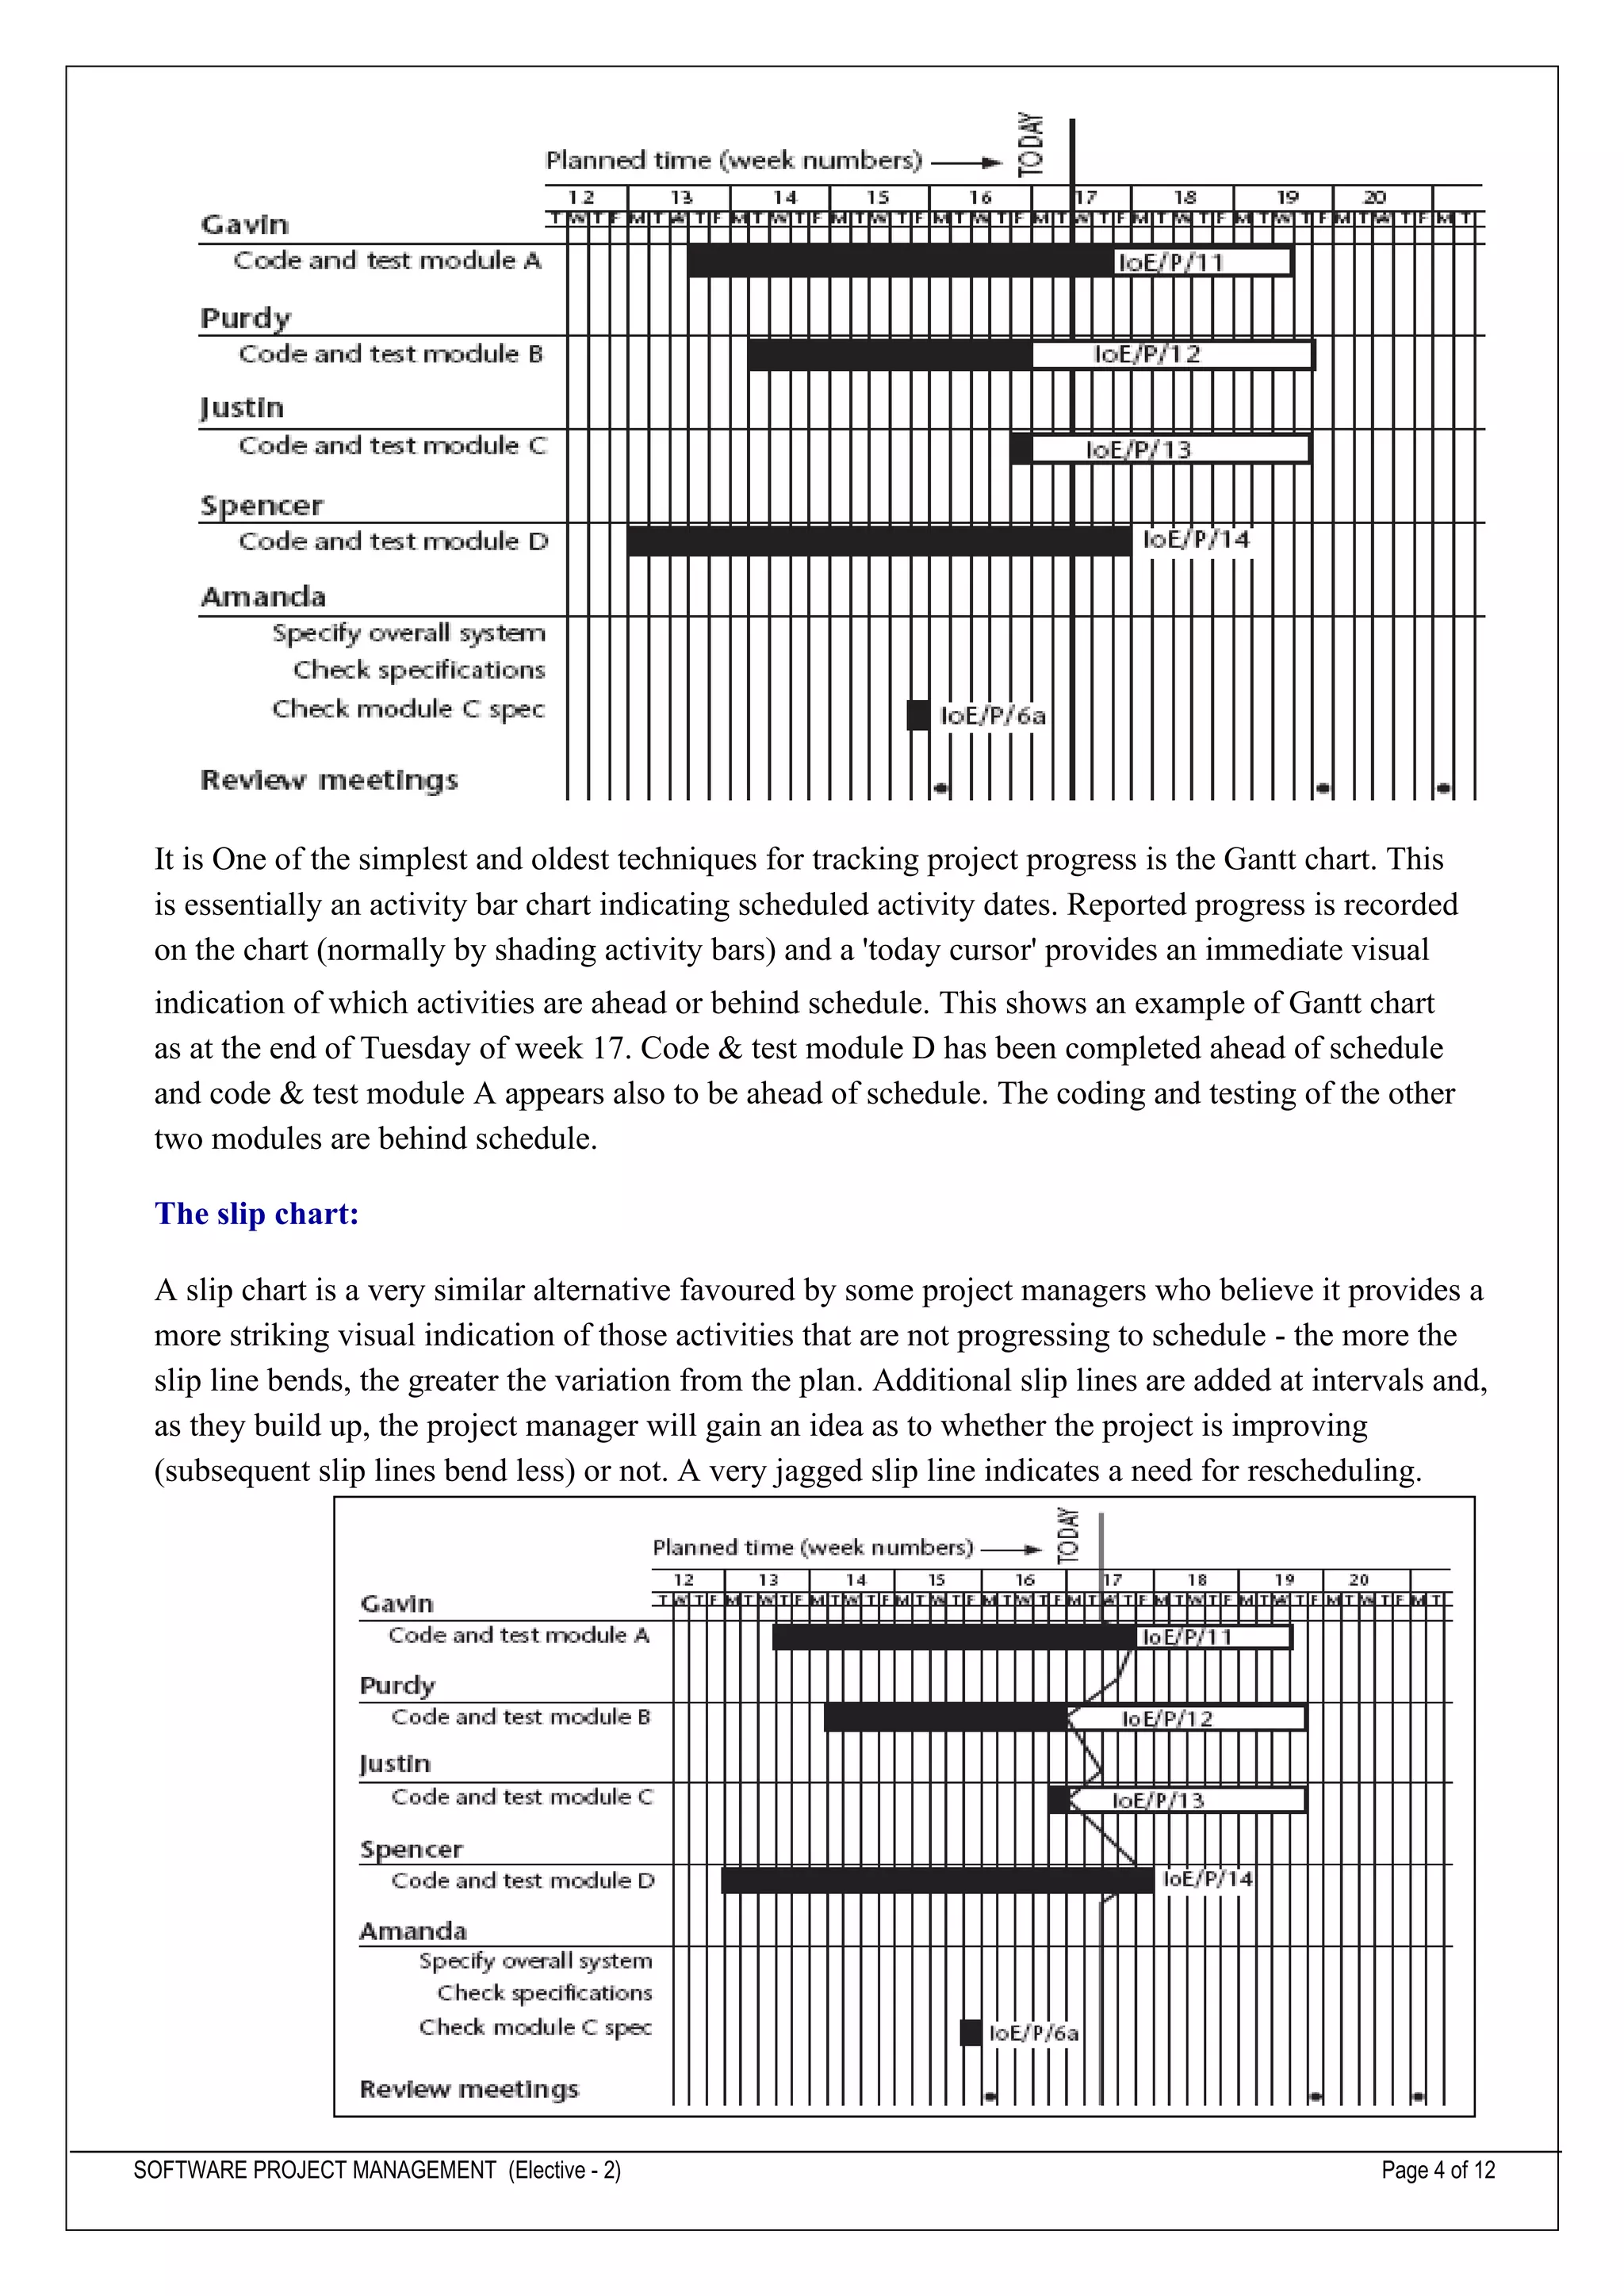
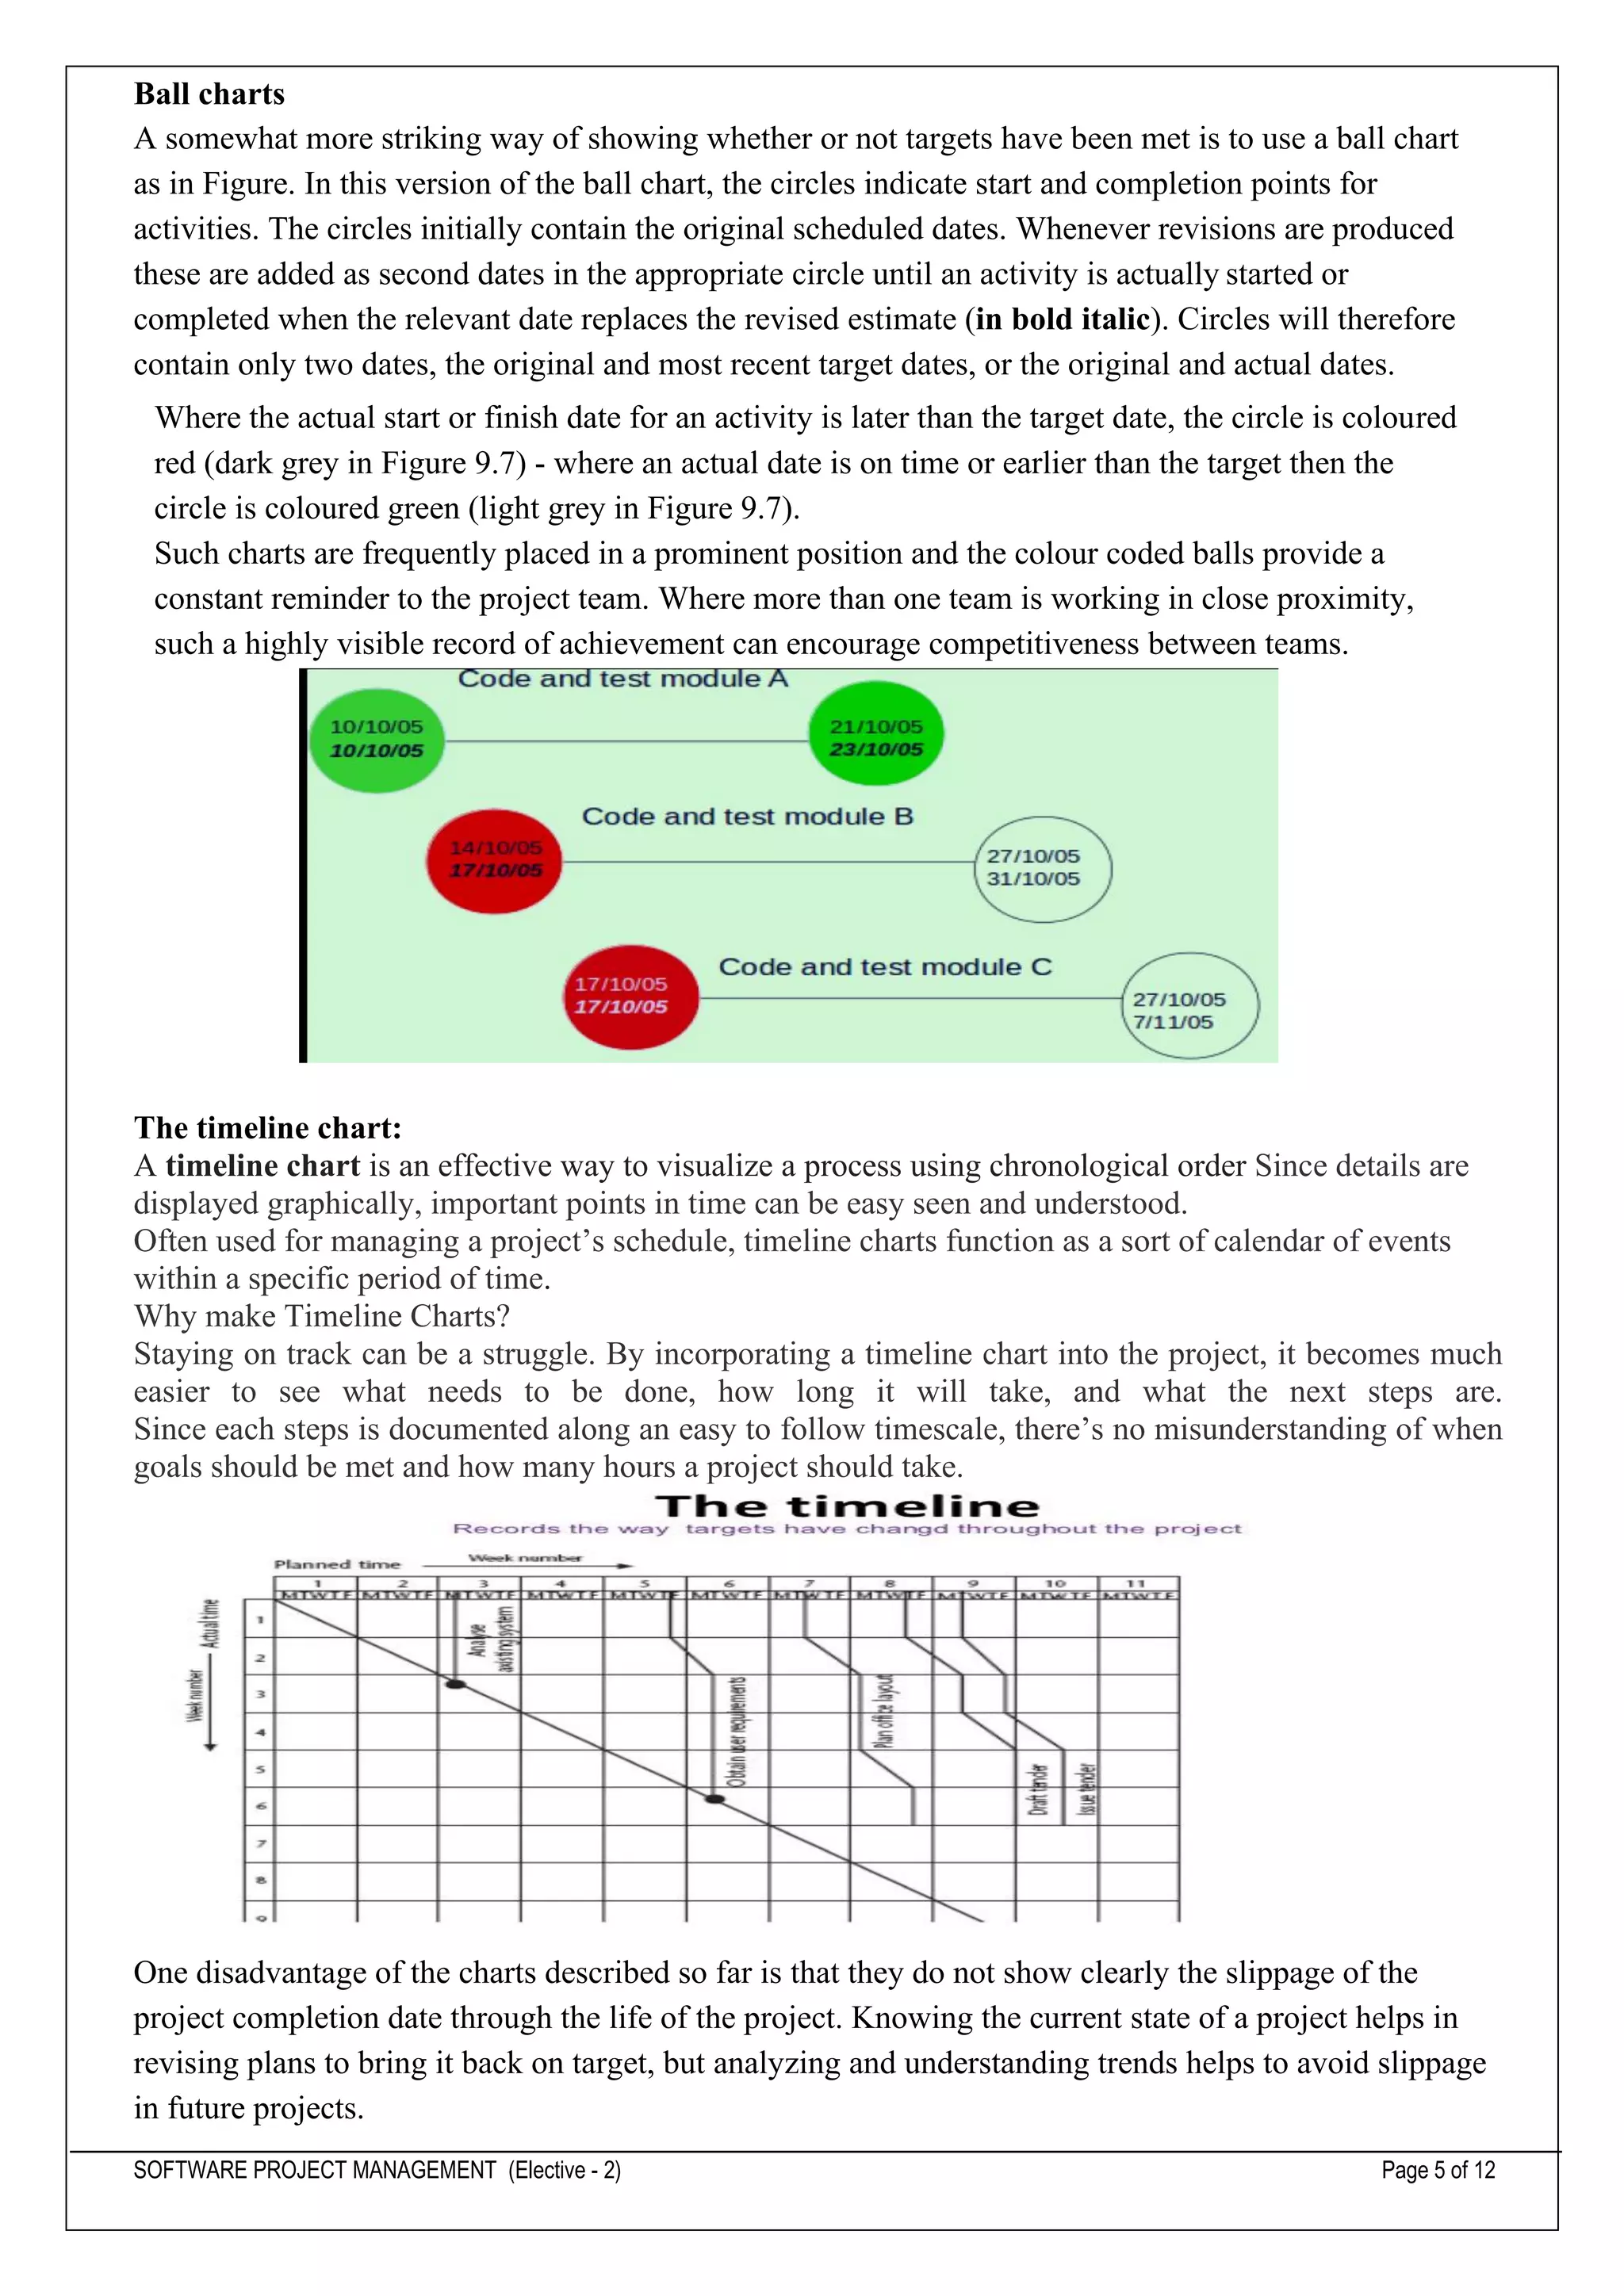
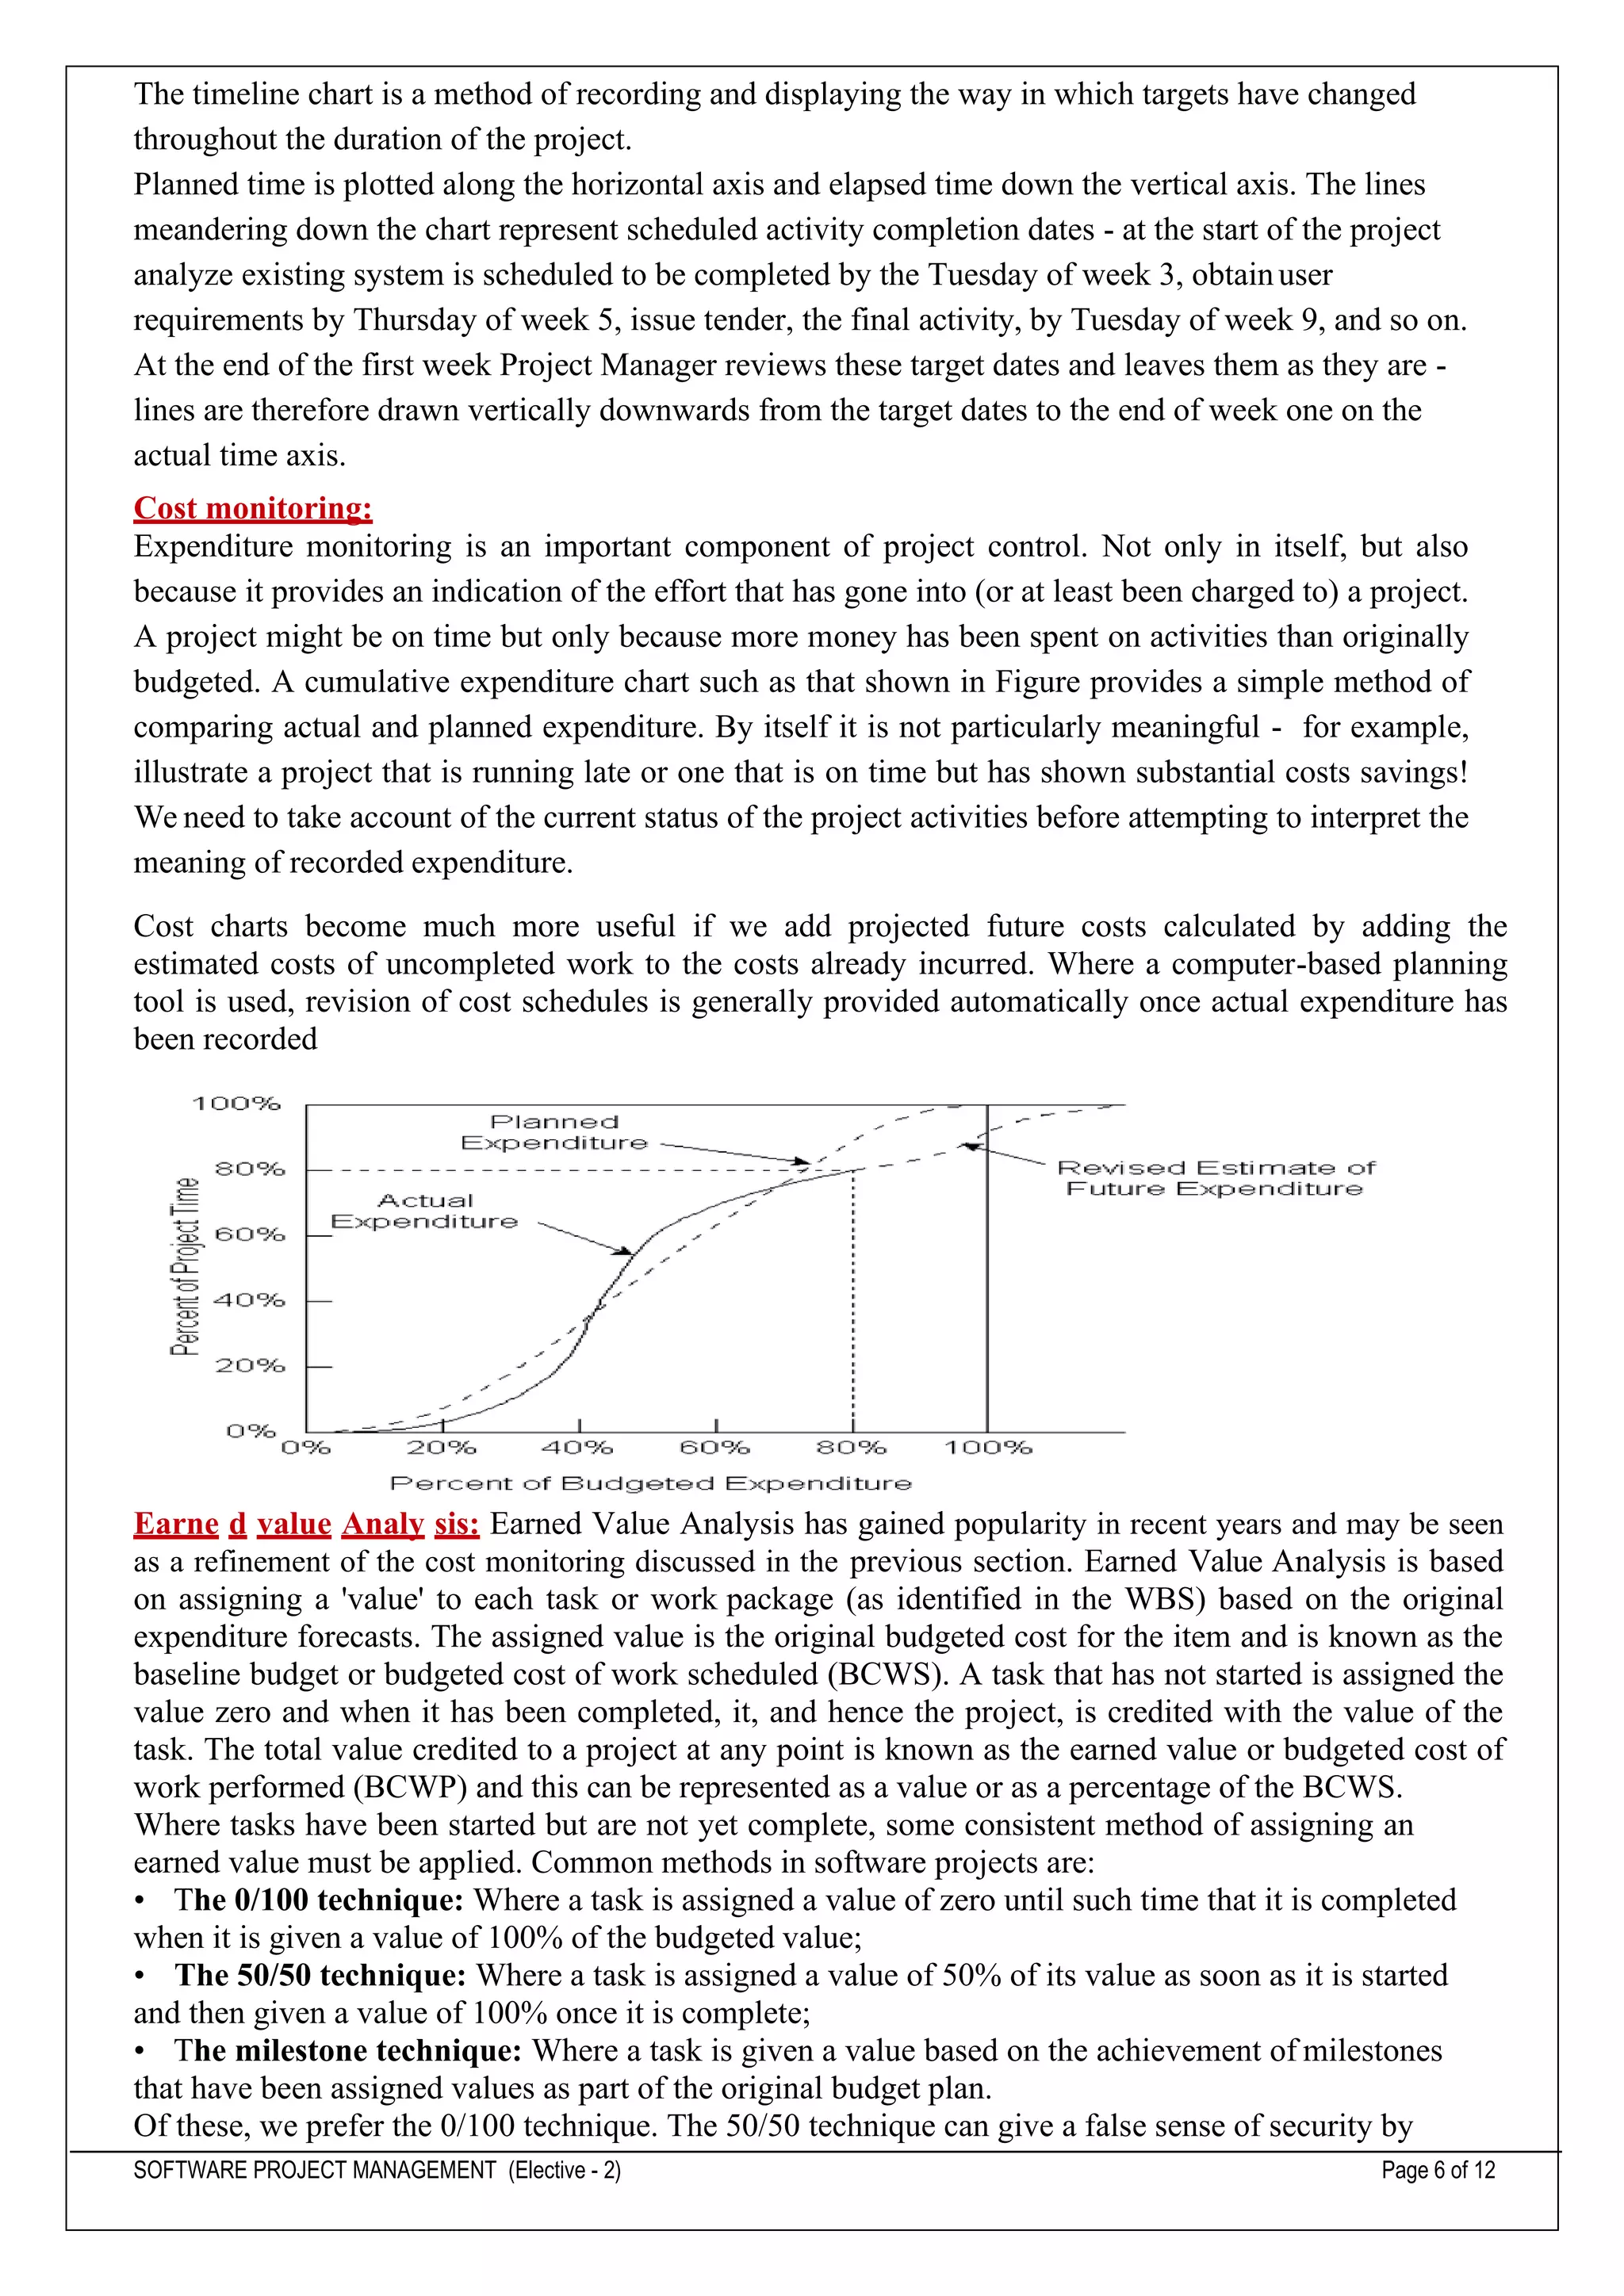
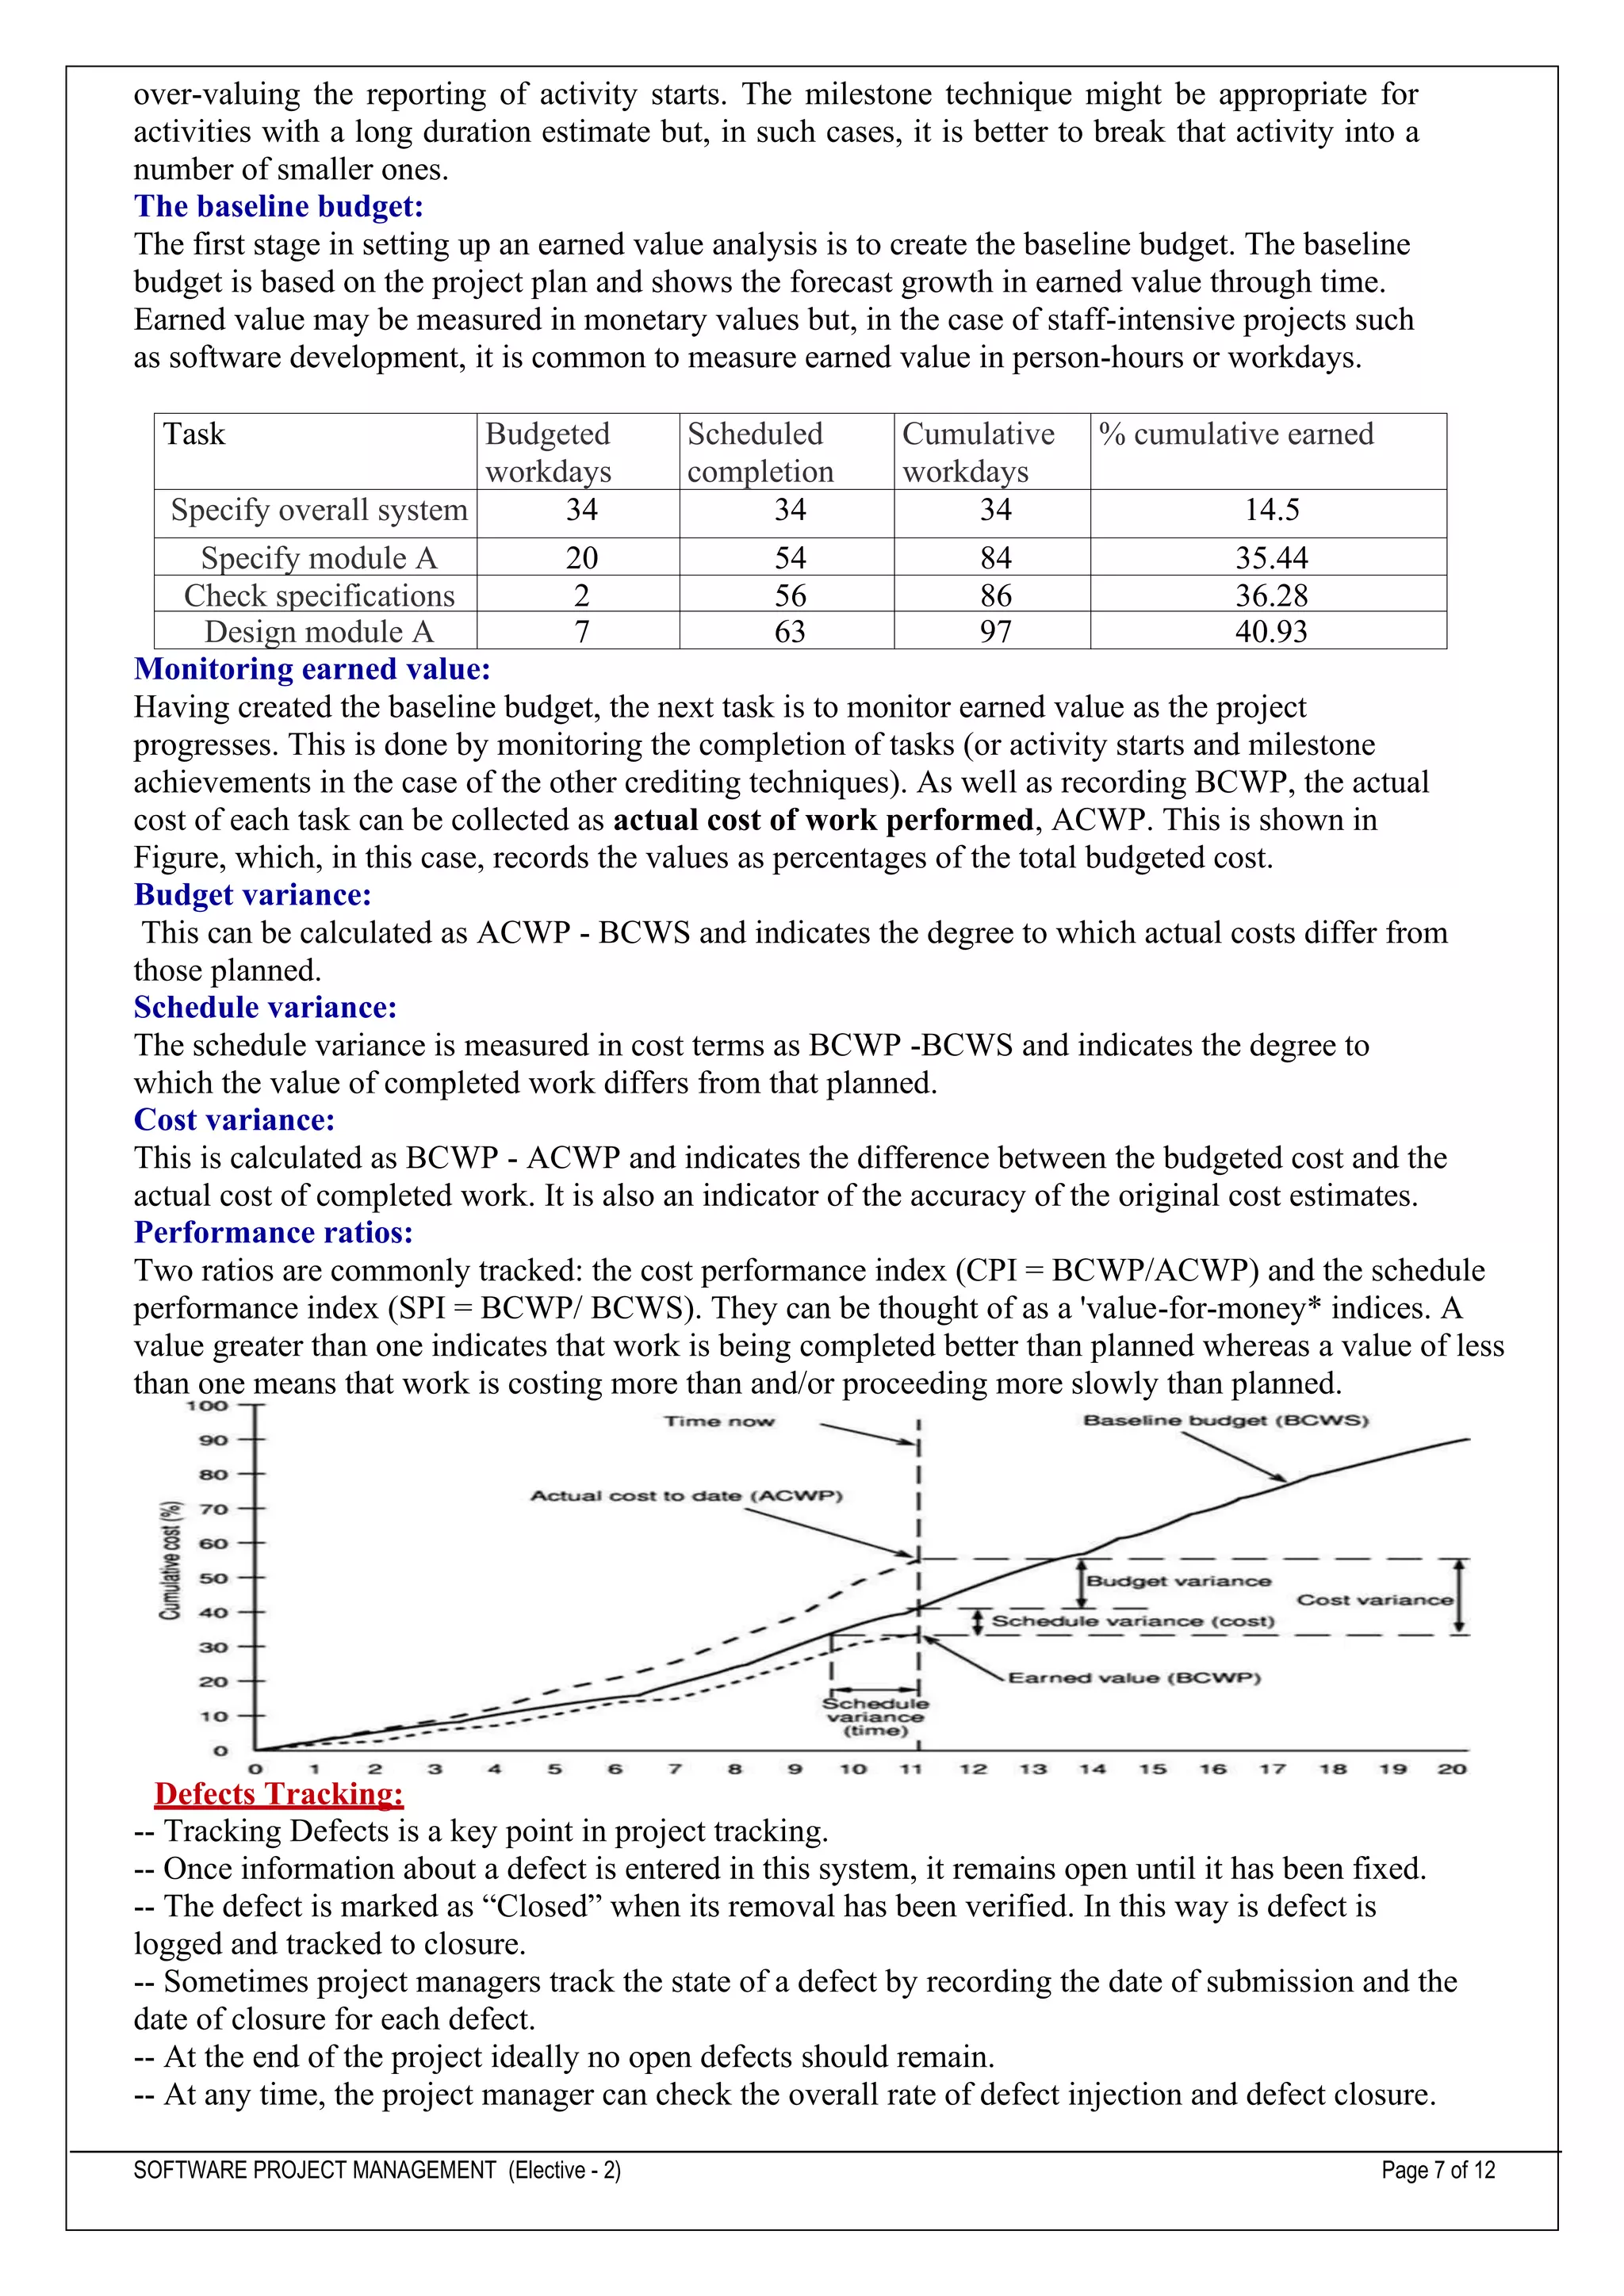
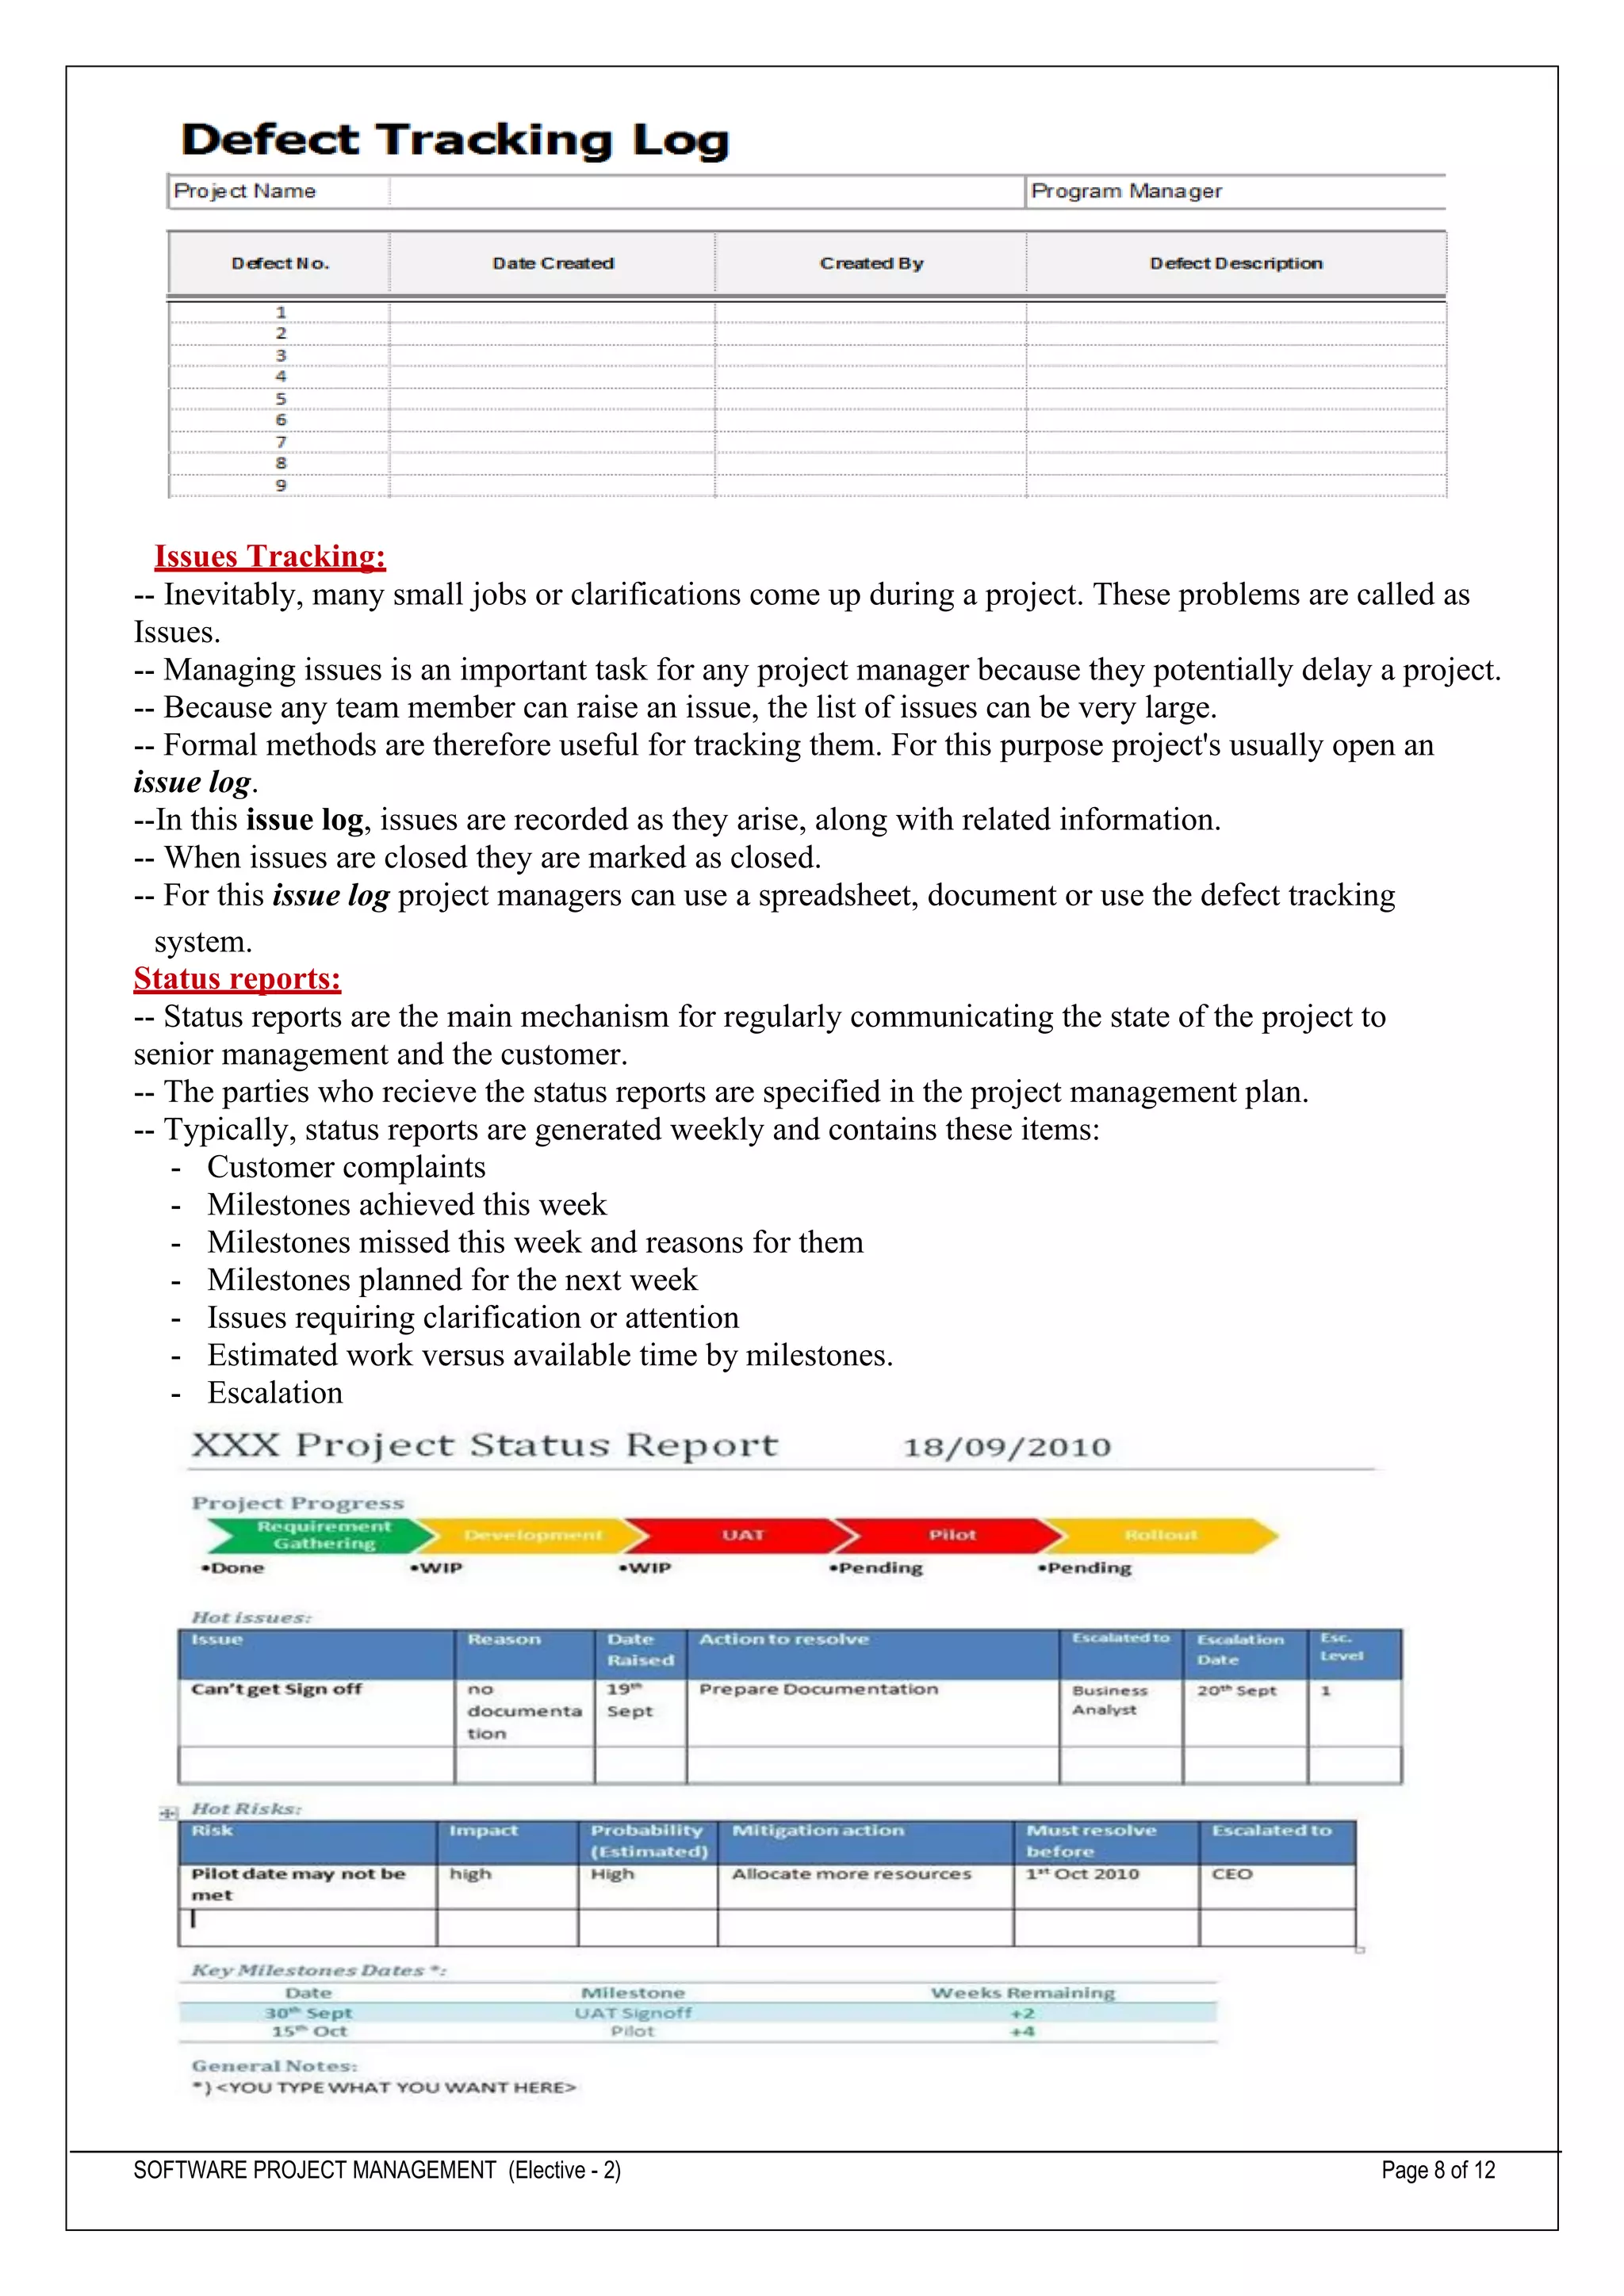
SlideShare a Scribd company logo
1 of 12
Download to read offline
SOFTWARE PROJECT MANAGEMENT (Elective - 2) Page 1 of 12
Unit V: Project Monitoring & Control , Resource Allocation
Creating a framework for monitoring & control, Progress monitoring, Cost monitoring, Earned
value Analysis, Defects Tracking, Issues Tracking, Status reports, Types of Resources, Identifying
resource requirements, Resource
Creating a framework for Monitoring & Control:
✓ Exercising control over a project and ensuring that targets are met is a matter of regular
monitoring, finding out what is happening, and comparing it with current targets.
✓ If there is a mismatch between the planned outcomes and the actual ones then either
replanning is needed to bring the project back on target or the target will have to be revised.
✓ The above Figure illustrates a model of the project control cycle and shows how, once the
initial project plan has been published, project control is a continual process of monitoring
progress against that plan and, where necessary, revising the plan to take account of
deviations.
✓ It also illustrates the important steps that must be taken after completion of the project so that
the experienced gained in any one project can feed into the planning stages of future projects.
thus allowing us to learn from past mistakes
SOFTWARE PROJECT MANAGEMENT (Elective - 2) Page 2 of 12
Responsibility:
• Project steering committee
• Project board
• Reporting formal or informal
▪ The overall responsibility for ensuring satisfactory progress on a project is often the role of the
project steering committee or Project Board.
▪ Day-to-day responsibility will rest with the project manager and, in all but the smallest of projects,
aspects of this can be delegated to team leaders.
▪ The above Figure illustrates the typical reporting structure found with medium and The concept
of a reporting large projects.
▪ With small projects (employing around half a dozen or fewer staff) individual team members usually
report directly to the project manager
▪ Reporting may be oral or written, formal or informal, or regular or ad hoc and some examples of
each type are given in Table.
Report Type Examples Comment
Oral formal regular weekly or monthly progress meetings while reports may be oral formal
written minutes should be kept
Oral formal ad hoc end-of-stage review meetings while largely oral, likely to receive
and generate written reports
Written formal regular Job sheets, progress reports normally weekly using forms
Written formal ad hoc exception reports, change reports often provides early warning; must
be backed up by formal reporting
Oral informal ad hoc canteen discussion, social interaction
Assessing progress:
Progress assessment will normally be made on the basis of information collected and collated at
regular intervals or when specific events occur. Wherever possible, this information will be
objective and tangible - whether or not a particular report has been delivered, for example.
However, such end-of-activity deliverables might not occur sufficiently frequently throughout the
life of the project. Here progress assessment will have to rely on the judgment of the team members
who are carrying out the project activities.
SOFTWARE PROJECT MANAGEMENT (Elective - 2) Page 3 of 12
Setting checkpoints:
It is essential to set a series of checkpoints in the initial activity plan. Checkpoints may be:
▪ Regular (Monthly, for example)
▪ Tied to specific events such as the production of a report or other deliverable.
It is always important to have visible milestones in the life cycle where various stakeholders meet, face
to face, to discuss progress and plans. The purpose of these events is not only to demonstrate how well a
project is performing but also to achieve the following:
• Synchronize stakeholder expectations and achieve concurrence on three evolving perspectives:
the requirements, the design, and the plan
• Synchronize related artifacts into a consistent and balanced state
• Identify the important risks, issues, and out-of-tolerance conditions
Key Points
▲ Three sequences of project checkpoints are used to synchronize stakeholder expectations throughout
the life cycle: major milestones, minor milestones, and status assessments.
▲ The most important major milestone is usually the event that transitions the project from
the elaboration phase into the construction phase.
▲ The format and content of minor milestones are highly dependent on the project and the
organizational culture.
▲ Periodic status assessments are crucial for focusing continuous attention on the evolving health of the
project and its dynamic priorities.
Taking snap-shots:
The frequency with which the a manager needs to receive information about progress will depend
upon the size and degree of risk of the project or that part of the project under their control. Team
leaders, for example, need to assess progress daily (particularly when employing inexperienced staff)
whereas project managers may find weekly or monthly reporting appropriate. In general, the higher
the level, the less frequent and less detailed the reporting needs to be.
There are, however, strong arguments in favour of formal weekly collection of information from
staff carrying out activities. Collecting data at the end of each week ensures that information is
provided while memories are still relatively fresh and provides a mechanism for individuals to
review and reflect upon their progress during the past few days.
Progress Monitoring:
Having collected data about project progress, a manager needs some way of presenting that data to
greatest effect. In this section, we look at some methods of presenting a picture of the project and its
future. Some of these methods (such as Gantt charts) provide a static picture, a single snap-shot,
whereas others (such as time-line charts) try to show how the project has progressed and changed
through time.
The Gantt chart:
Definition: A Gantt chart is a useful graphical tool which shows activities or tasks performed against
time. It is also known as visual presentation of a project where the activities are broken down and
displayed on a chart which makes it is easy to understand and interpret.
• A Gantt chart is a popular tool in project management. It basically drills down activities which
need to be done by a fixed time period. It is commonly used for tracking project schedules.
• A Gantt chart is a popular tool in project management. It basically drills down activities which
need to be done by a fixed time period. It is commonly used for tracking project schedules.
• On the chart, tasks are shown on the vertical axis while the scheduled time-spend is laid out on
the horizontal axis. Each task is represented by a bar that shows the time required for the project.
• The bar then represents or shows percentage of tasks that have been completed. It also shows
dependencies, which simply means the interlinkages between various activities in the project.
SOFTWARE PROJECT MANAGEMENT (Elective - 2) Page 4 of 12
It is One of the simplest and oldest techniques for tracking project progress is the Gantt chart. This
is essentially an activity bar chart indicating scheduled activity dates. Reported progress is recorded
on the chart (normally by shading activity bars) and a 'today cursor' provides an immediate visual
indication of which activities are ahead or behind schedule. This shows an example of Gantt chart
as at the end of Tuesday of week 17. Code & test module D has been completed ahead of schedule
and code & test module A appears also to be ahead of schedule. The coding and testing of the other
two modules are behind schedule.
The slip chart:
A slip chart is a very similar alternative favoured by some project managers who believe it provides a
more striking visual indication of those activities that are not progressing to schedule - the more the
slip line bends, the greater the variation from the plan. Additional slip lines are added at intervals and,
as they build up, the project manager will gain an idea as to whether the project is improving
(subsequent slip lines bend less) or not. A very jagged slip line indicates a need for rescheduling.
SOFTWARE PROJECT MANAGEMENT (Elective - 2) Page 5 of 12
Ball charts
A somewhat more striking way of showing whether or not targets have been met is to use a ball chart
as in Figure. In this version of the ball chart, the circles indicate start and completion points for
activities. The circles initially contain the original scheduled dates. Whenever revisions are produced
these are added as second dates in the appropriate circle until an activity is actually started or
completed when the relevant date replaces the revised estimate (in bold italic). Circles will therefore
contain only two dates, the original and most recent target dates, or the original and actual dates.
Where the actual start or finish date for an activity is later than the target date, the circle is coloured
red (dark grey in Figure 9.7) - where an actual date is on time or earlier than the target then the
circle is coloured green (light grey in Figure 9.7).
Such charts are frequently placed in a prominent position and the colour coded balls provide a
constant reminder to the project team. Where more than one team is working in close proximity,
such a highly visible record of achievement can encourage competitiveness between teams.
The timeline chart:
A timeline chart is an effective way to visualize a process using chronological order Since details are
displayed graphically, important points in time can be easy seen and understood.
Often used for managing a project’s schedule, timeline charts function as a sort of calendar of events
within a specific period of time.
Why make Timeline Charts?
Staying on track can be a struggle. By incorporating a timeline chart into the project, it becomes much
easier to see what needs to be done, how long it will take, and what the next steps are.
Since each steps is documented along an easy to follow timescale, there’s no misunderstanding of when
goals should be met and how many hours a project should take.
One disadvantage of the charts described so far is that they do not show clearly the slippage of the
project completion date through the life of the project. Knowing the current state of a project helps in
revising plans to bring it back on target, but analyzing and understanding trends helps to avoid slippage
in future projects.
SOFTWARE PROJECT MANAGEMENT (Elective - 2) Page 6 of 12
The timeline chart is a method of recording and displaying the way in which targets have changed
throughout the duration of the project.
Planned time is plotted along the horizontal axis and elapsed time down the vertical axis. The lines
meandering down the chart represent scheduled activity completion dates - at the start of the project
analyze existing system is scheduled to be completed by the Tuesday of week 3, obtainuser
requirements by Thursday of week 5, issue tender, the final activity, by Tuesday of week 9, and so on.
At the end of the first week Project Manager reviews these target dates and leaves them as they are -
lines are therefore drawn vertically downwards from the target dates to the end of week one on the
actual time axis.
Cost monitoring:
Expenditure monitoring is an important component of project control. Not only in itself, but also
because it provides an indication of the effort that has gone into (or at least been charged to) a project.
A project might be on time but only because more money has been spent on activities than originally
budgeted. A cumulative expenditure chart such as that shown in Figure provides a simple method of
comparing actual and planned expenditure. By itself it is not particularly meaningful - for example,
illustrate a project that is running late or one that is on time but has shown substantial costs savings!
We need to take account of the current status of the project activities before attempting to interpret the
meaning of recorded expenditure.
Cost charts become much more useful if we add projected future costs calculated by adding the
estimated costs of uncompleted work to the costs already incurred. Where a computer-based planning
tool is used, revision of cost schedules is generally provided automatically once actual expenditure has
been recorded
Earne d value Analy sis: Earned Value Analysis has gained popularity in recent years and may be seen
as a refinement of the cost monitoring discussed in the previous section. Earned Value Analysis is based
on assigning a 'value' to each task or work package (as identified in the WBS) based on the original
expenditure forecasts. The assigned value is the original budgeted cost for the item and is known as the
baseline budget or budgeted cost of work scheduled (BCWS). A task that has not started is assigned the
value zero and when it has been completed, it, and hence the project, is credited with the value of the
task. The total value credited to a project at any point is known as the earned value or budgeted cost of
work performed (BCWP) and this can be represented as a value or as a percentage of the BCWS.
Where tasks have been started but are not yet complete, some consistent method of assigning an
earned value must be applied. Common methods in software projects are:
• The 0/100 technique: Where a task is assigned a value of zero until such time that it is completed
when it is given a value of 100% of the budgeted value;
• The 50/50 technique: Where a task is assigned a value of 50% of its value as soon as it is started
and then given a value of 100% once it is complete;
• The milestone technique: Where a task is given a value based on the achievement of milestones
that have been assigned values as part of the original budget plan.
Of these, we prefer the 0/100 technique. The 50/50 technique can give a false sense of security by
SOFTWARE PROJECT MANAGEMENT (Elective - 2) Page 7 of 12
over-valuing the reporting of activity starts. The milestone technique might be appropriate for
activities with a long duration estimate but, in such cases, it is better to break that activity into a
number of smaller ones.
The baseline budget:
The first stage in setting up an earned value analysis is to create the baseline budget. The baseline
budget is based on the project plan and shows the forecast growth in earned value through time.
Earned value may be measured in monetary values but, in the case of staff-intensive projects such
as software development, it is common to measure earned value in person-hours or workdays.
Task Budgeted
workdays
Scheduled
completion
Cumulative
workdays
% cumulative earned
Specify overall system 34 34 34 14.5
Specify module A 20 54 84 35.44
Check specifications 2 56 86 36.28
Design module A 7 63 97 40.93
Monitoring earned value:
Having created the baseline budget, the next task is to monitor earned value as the project
progresses. This is done by monitoring the completion of tasks (or activity starts and milestone
achievements in the case of the other crediting techniques). As well as recording BCWP, the actual
cost of each task can be collected as actual cost of work performed, ACWP. This is shown in
Figure, which, in this case, records the values as percentages of the total budgeted cost.
Budget variance:
This can be calculated as ACWP - BCWS and indicates the degree to which actual costs differ from
those planned.
Schedule variance:
The schedule variance is measured in cost terms as BCWP -BCWS and indicates the degree to
which the value of completed work differs from that planned.
Cost variance:
This is calculated as BCWP - ACWP and indicates the difference between the budgeted cost and the
actual cost of completed work. It is also an indicator of the accuracy of the original cost estimates.
Performance ratios:
Two ratios are commonly tracked: the cost performance index (CPI = BCWP/ACWP) and the schedule
performance index (SPI = BCWP/ BCWS). They can be thought of as a 'value-for-money* indices. A
value greater than one indicates that work is being completed better than planned whereas a value of less
than one means that work is costing more than and/or proceeding more slowly than planned.
Defects Tracking:
-- Tracking Defects is a key point in project tracking.
-- Once information about a defect is entered in this system, it remains open until it has been fixed.
-- The defect is marked as “Closed” when its removal has been verified. In this way is defect is
logged and tracked to closure.
-- Sometimes project managers track the state of a defect by recording the date of submission and the
date of closure for each defect.
-- At the end of the project ideally no open defects should remain.
-- At any time, the project manager can check the overall rate of defect injection and defect closure.
SOFTWARE PROJECT MANAGEMENT (Elective - 2) Page 8 of 12
Issues Tracking:
-- Inevitably, many small jobs or clarifications come up during a project. These problems are called as
Issues.
-- Managing issues is an important task for any project manager because they potentially delay a project.
-- Because any team member can raise an issue, the list of issues can be very large.
-- Formal methods are therefore useful for tracking them. For this purpose project's usually open an
issue log.
--In this issue log, issues are recorded as they arise, along with related information.
-- When issues are closed they are marked as closed.
-- For this issue log project managers can use a spreadsheet, document or use the defect tracking
system.
Status reports:
-- Status reports are the main mechanism for regularly communicating the state of the project to
senior management and the customer.
-- The parties who recieve the status reports are specified in the project management plan.
-- Typically, status reports are generated weekly and contains these items:
- Customer complaints
- Milestones achieved this week
- Milestones missed this week and reasons for them
- Milestones planned for the next week
- Issues requiring clarification or attention
- Estimated work versus available time by milestones.
- Escalation
SOFTWARE PROJECT MANAGEMENT (Elective - 2) Page 9 of 12
Types of Resources:
A resource is any item or person required for the execution of the project. This covers many things -
from paper clips to key personnel - and it is unlikely that we would wish to itemize every resource
required, let alone draw up a schedule for their use! Stationery and other standard office supplies, for
example, need not normally be the concern of the project manager - ensuring there is always an
adequate supply is the role of the office manager. The project manager must concentrate on those
resources where there is a possibility that, without planning, they might not be sufficiently available
when required.
Some resources, such as a project manager, will be required for the duration of the project whereas
others, such as a specific software developer, might be required for a single activity. The former,
while vital to the success of the project, does not require the same level of scheduling as the latter.
Individual programmers, for example, might be committed to working on a number of projects and
it will be important to book their time well in advance.
In general, resources will fall into one of seven categories.
Labour: The main items in this category will be members of the development project team such as
the project manager, systems analysts and software developers. liqually important will be the quality
assurance team and other support staff and any employees of the client organization who might be
required to undertake or participate in specific activities.
Equipment: Obvious items will include workstations and other computing and office equipment.
We must not forget that staff also need basic equipment such as desks and chairs.
Materials: Materials are items that are consumed, rather than equipment that is used. They are of
little consequence in most software projects but can be important for some - software that is to be
widely distributed might, for example, require supplies of floppy disks to be specially obtained.
Space: For projects that are undertaken w ith existing staff, space is normally readily available. If any
additional staff (recruited or contracted) should be needed then office space will need to be found.
Services: Some projects will require procurement of specialist services -development of a wide area
distributed system, for example, requires scheduling of telecommunications services.
Time is the resource that is being offset against the other primary The cost of money as a resources -
project time-scales can sometimes be reduced by increasing other resource is a factor taken resources
and will almost certainly be extended if they arc unexpectedly into account in DCF reduced.
evaluation.
Money: Money is a secondary resource - it is used to buy other resources and will be consumed as
other resources are used. It is similar to other resources in that it is available at a cost - in this case
interest charges.
Identifying resource requirements:
The first step in producing a resource allocation plan is to list the resources that will be required
along with the expected level of demand. This will normally be done by considering each activity in
turn and identifying the resources required. It is likely, however, that there will also be resources
required that are not activity specific but are part of the project's infrastructure (such as the project
manager) or required to support other resources (office space, for example, might be required to
house contract software developers).
SOFTWARE PROJECT MANAGEMENT (Elective - 2) Page 10 of 12
Resource Scheduling:
over the duration of the project.
--
Having
produce
d the
resource
require
ments
list, the
next
stage is
to map
this onto
the
activity
plan to
assess
the
distribut
ion of
resource
s
required
-- This is best done by representing the activity plan as a bar chart and using this to produce a
resource histogram for each resource.
SOFTWARE PROJECT MANAGEMENT (Elective - 2) Page 11 of 12
-- Changing the level of resources on a project over time, particularly personnel, generally adds to
the cost of a project. Recruiting staff has costs and even where staff are transferred internally,time
will be needed for familiarization w ith the new project environment.
-- The resource histogram in Figure poses particular problems in that it calls for two analyst-
designers to be idle for eleven days, one for six days and one for two days between the specification
and design stage.
-- White rectangles indicate when an activity is scheduled and shaded rectangles the total floatt.
Resource Smoothing:
“A technique that adjusts the activities of a schedule model such that the requirements for resources
on the project do not exceed certain predefined resource limits.”
In practice, resources have to be allocated to a project on an activity-by-activity basis and
finding the 'best' allocation can be time consuming and difficult. As soon as a member of the project
team is allocated to an activity that activity acquires a scheduled start and finish date and the team
member becomes unavailable for other activities for that period. Thus, allocating a resource to one
activity limits the flexibility for resource allocation and scheduling of other activities.
It is therefore helpful to prioritize activities so that resources can be allocated to competing
SOFTWARE PROJECT MANAGEMENT (Elective - 2) Page 12 of 12
activities in some rational order. The priority must always be to allocate resources to critical path
activities and then to those activities that are most likely to affect others. In that way, lower priority
activities are made to fit around the more critical, already scheduled activities. Of the various ways
of prioritizing activities, two are described below.
--Total float priority: Activities are ordered according to their total float, those with the smallest
total float having the highest priority. In the simplest application of this method, activities are
allocated resources in ascending order of total float. However, as scheduling proceeds, activities
will be delayed (if resources are not available at their earliest start dates) and total floats will be
reduced. It is therefore desirable to recalculate floats (and hence reorder the list) each time an
activity is delayed.
-- Ordered list priority: With this method, activities that can proceed at the same time are ordered
according to a set of simple criteria. An example of this is Burman's priority list, which takes into
account activity duration as well as total float:
1. shortest critical activity;
2. critical activities;
3. shortest non-critical activity;
4. non-critical activity with least float;
5. non-critical activities.

More Related Content

Similar to Unit 5.pdf

Critical Path Analysis
Critical Path AnalysisCritical Path Analysis
Critical Path Analysis
simu_mihai
 

Similar to Unit 5.pdf (20)

GANTT CHARTS.pptx
GANTT CHARTS.pptxGANTT CHARTS.pptx
GANTT CHARTS.pptx
 
-Project-Management.ppt
-Project-Management.ppt-Project-Management.ppt
-Project-Management.ppt
 
Time Management within IT Project Management
Time Management within IT Project ManagementTime Management within IT Project Management
Time Management within IT Project Management
 
PMNM101 Lesson 2 2022.pptx
PMNM101 Lesson 2 2022.pptxPMNM101 Lesson 2 2022.pptx
PMNM101 Lesson 2 2022.pptx
 
Gantt Chart
Gantt ChartGantt Chart
Gantt Chart
 
Critical Path Analysis
Critical Path AnalysisCritical Path Analysis
Critical Path Analysis
 
Pert and gantt chart
Pert and gantt chartPert and gantt chart
Pert and gantt chart
 
Project management
Project managementProject management
Project management
 
Project implimentation
Project implimentationProject implimentation
Project implimentation
 
Project implimentation
Project implimentationProject implimentation
Project implimentation
 
Communication
CommunicationCommunication
Communication
 
Project Management Techniques ( WBS & Critical Path Method )
Project Management Techniques ( WBS & Critical Path Method )Project Management Techniques ( WBS & Critical Path Method )
Project Management Techniques ( WBS & Critical Path Method )
 
Gantt Charts.ppt
Gantt Charts.pptGantt Charts.ppt
Gantt Charts.ppt
 
PROJECT SCHEDULE
PROJECT SCHEDULEPROJECT SCHEDULE
PROJECT SCHEDULE
 
Project Management
Project ManagementProject Management
Project Management
 
Planning And Managing The Project
Planning And Managing The ProjectPlanning And Managing The Project
Planning And Managing The Project
 
Fundamentals of scheduling
Fundamentals of schedulingFundamentals of scheduling
Fundamentals of scheduling
 
The simplified project management process it-toolkits
The simplified project management process   it-toolkitsThe simplified project management process   it-toolkits
The simplified project management process it-toolkits
 
HM 418 2e hcpm05 (1)
HM 418 2e hcpm05 (1)HM 418 2e hcpm05 (1)
HM 418 2e hcpm05 (1)
 
PROJECT PLANNING
PROJECT PLANNINGPROJECT PLANNING
PROJECT PLANNING
 

Recently uploaded

Integrated Test Rig For HTFE-25 - Neometrix
Integrated Test Rig For HTFE-25 - NeometrixIntegrated Test Rig For HTFE-25 - Neometrix
Integrated Test Rig For HTFE-25 - Neometrix
Neometrix_Engineering_Pvt_Ltd
 
Standard vs Custom Battery Packs - Decoding the Power Play
Standard vs Custom Battery Packs - Decoding the Power PlayStandard vs Custom Battery Packs - Decoding the Power Play
Standard vs Custom Battery Packs - Decoding the Power Play
Epec Engineered Technologies
 
Cara Menggugurkan Sperma Yang Masuk Rahim Biyar Tidak Hamil
Cara Menggugurkan Sperma Yang Masuk Rahim Biyar Tidak HamilCara Menggugurkan Sperma Yang Masuk Rahim Biyar Tidak Hamil
Cara Menggugurkan Sperma Yang Masuk Rahim Biyar Tidak Hamil
Cara Menggugurkan Kandungan 087776558899
 
Digital Communication Essentials: DPCM, DM, and ADM .pptx
Digital Communication Essentials: DPCM, DM, and ADM .pptxDigital Communication Essentials: DPCM, DM, and ADM .pptx
Digital Communication Essentials: DPCM, DM, and ADM .pptx
pritamlangde
 
Hospital management system project report.pdf
Hospital management system project report.pdfHospital management system project report.pdf
Hospital management system project report.pdf
Kamal Acharya
 
Kuwait City MTP kit ((+919101817206)) Buy Abortion Pills Kuwait
Kuwait City MTP kit ((+919101817206)) Buy Abortion Pills KuwaitKuwait City MTP kit ((+919101817206)) Buy Abortion Pills Kuwait
Kuwait City MTP kit ((+919101817206)) Buy Abortion Pills Kuwait
jaanualu31
 
scipt v1.pptxcxxxxxxxxxxxxxxxxxxxxxxxxxxxxxxxxxxxxxxxxxxxxxxxxxxxxxxxxxxxxxxx...
scipt v1.pptxcxxxxxxxxxxxxxxxxxxxxxxxxxxxxxxxxxxxxxxxxxxxxxxxxxxxxxxxxxxxxxxx...scipt v1.pptxcxxxxxxxxxxxxxxxxxxxxxxxxxxxxxxxxxxxxxxxxxxxxxxxxxxxxxxxxxxxxxxx...
scipt v1.pptxcxxxxxxxxxxxxxxxxxxxxxxxxxxxxxxxxxxxxxxxxxxxxxxxxxxxxxxxxxxxxxxx...
HenryBriggs2
 

Recently uploaded (20)

Ground Improvement Technique: Earth Reinforcement
Ground Improvement Technique: Earth ReinforcementGround Improvement Technique: Earth Reinforcement
Ground Improvement Technique: Earth Reinforcement
 
Integrated Test Rig For HTFE-25 - Neometrix
Integrated Test Rig For HTFE-25 - NeometrixIntegrated Test Rig For HTFE-25 - Neometrix
Integrated Test Rig For HTFE-25 - Neometrix
 
Standard vs Custom Battery Packs - Decoding the Power Play
Standard vs Custom Battery Packs - Decoding the Power PlayStandard vs Custom Battery Packs - Decoding the Power Play
Standard vs Custom Battery Packs - Decoding the Power Play
 
S1S2 B.Arch MGU - HOA1&2 Module 3 -Temple Architecture of Kerala.pptx
S1S2 B.Arch MGU - HOA1&2 Module 3 -Temple Architecture of Kerala.pptxS1S2 B.Arch MGU - HOA1&2 Module 3 -Temple Architecture of Kerala.pptx
S1S2 B.Arch MGU - HOA1&2 Module 3 -Temple Architecture of Kerala.pptx
 
Cara Menggugurkan Sperma Yang Masuk Rahim Biyar Tidak Hamil
Cara Menggugurkan Sperma Yang Masuk Rahim Biyar Tidak HamilCara Menggugurkan Sperma Yang Masuk Rahim Biyar Tidak Hamil
Cara Menggugurkan Sperma Yang Masuk Rahim Biyar Tidak Hamil
 
Introduction to Serverless with AWS Lambda
Introduction to Serverless with AWS LambdaIntroduction to Serverless with AWS Lambda
Introduction to Serverless with AWS Lambda
 
UNIT 4 PTRP final Convergence in probability.pptx
UNIT 4 PTRP final Convergence in probability.pptxUNIT 4 PTRP final Convergence in probability.pptx
UNIT 4 PTRP final Convergence in probability.pptx
 
Memory Interfacing of 8086 with DMA 8257
Memory Interfacing of 8086 with DMA 8257Memory Interfacing of 8086 with DMA 8257
Memory Interfacing of 8086 with DMA 8257
 
Convergence of Robotics and Gen AI offers excellent opportunities for Entrepr...
Convergence of Robotics and Gen AI offers excellent opportunities for Entrepr...Convergence of Robotics and Gen AI offers excellent opportunities for Entrepr...
Convergence of Robotics and Gen AI offers excellent opportunities for Entrepr...
 
Digital Communication Essentials: DPCM, DM, and ADM .pptx
Digital Communication Essentials: DPCM, DM, and ADM .pptxDigital Communication Essentials: DPCM, DM, and ADM .pptx
Digital Communication Essentials: DPCM, DM, and ADM .pptx
 
Hospital management system project report.pdf
Hospital management system project report.pdfHospital management system project report.pdf
Hospital management system project report.pdf
 
Hostel management system project report..pdf
Hostel management system project report..pdfHostel management system project report..pdf
Hostel management system project report..pdf
 
Computer Networks Basics of Network Devices
Computer Networks  Basics of Network DevicesComputer Networks  Basics of Network Devices
Computer Networks Basics of Network Devices
 
👉 Yavatmal Call Girls Service Just Call 🍑👄6378878445 🍑👄 Top Class Call Girl S...
👉 Yavatmal Call Girls Service Just Call 🍑👄6378878445 🍑👄 Top Class Call Girl S...👉 Yavatmal Call Girls Service Just Call 🍑👄6378878445 🍑👄 Top Class Call Girl S...
👉 Yavatmal Call Girls Service Just Call 🍑👄6378878445 🍑👄 Top Class Call Girl S...
 
Introduction to Data Visualization,Matplotlib.pdf
Introduction to Data Visualization,Matplotlib.pdfIntroduction to Data Visualization,Matplotlib.pdf
Introduction to Data Visualization,Matplotlib.pdf
 
HOA1&2 - Module 3 - PREHISTORCI ARCHITECTURE OF KERALA.pptx
HOA1&2 - Module 3 - PREHISTORCI ARCHITECTURE OF KERALA.pptxHOA1&2 - Module 3 - PREHISTORCI ARCHITECTURE OF KERALA.pptx
HOA1&2 - Module 3 - PREHISTORCI ARCHITECTURE OF KERALA.pptx
 
Kuwait City MTP kit ((+919101817206)) Buy Abortion Pills Kuwait
Kuwait City MTP kit ((+919101817206)) Buy Abortion Pills KuwaitKuwait City MTP kit ((+919101817206)) Buy Abortion Pills Kuwait
Kuwait City MTP kit ((+919101817206)) Buy Abortion Pills Kuwait
 
PE 459 LECTURE 2- natural gas basic concepts and properties
PE 459 LECTURE 2- natural gas basic concepts and propertiesPE 459 LECTURE 2- natural gas basic concepts and properties
PE 459 LECTURE 2- natural gas basic concepts and properties
 
COST-EFFETIVE and Energy Efficient BUILDINGS ptx
COST-EFFETIVE  and Energy Efficient BUILDINGS ptxCOST-EFFETIVE  and Energy Efficient BUILDINGS ptx
COST-EFFETIVE and Energy Efficient BUILDINGS ptx
 
scipt v1.pptxcxxxxxxxxxxxxxxxxxxxxxxxxxxxxxxxxxxxxxxxxxxxxxxxxxxxxxxxxxxxxxxx...
scipt v1.pptxcxxxxxxxxxxxxxxxxxxxxxxxxxxxxxxxxxxxxxxxxxxxxxxxxxxxxxxxxxxxxxxx...scipt v1.pptxcxxxxxxxxxxxxxxxxxxxxxxxxxxxxxxxxxxxxxxxxxxxxxxxxxxxxxxxxxxxxxxx...
scipt v1.pptxcxxxxxxxxxxxxxxxxxxxxxxxxxxxxxxxxxxxxxxxxxxxxxxxxxxxxxxxxxxxxxxx...
 

Unit 5.pdf

  • 1. SOFTWARE PROJECT MANAGEMENT (Elective - 2) Page 1 of 12 Unit V: Project Monitoring & Control , Resource Allocation Creating a framework for monitoring & control, Progress monitoring, Cost monitoring, Earned value Analysis, Defects Tracking, Issues Tracking, Status reports, Types of Resources, Identifying resource requirements, Resource Creating a framework for Monitoring & Control: ✓ Exercising control over a project and ensuring that targets are met is a matter of regular monitoring, finding out what is happening, and comparing it with current targets. ✓ If there is a mismatch between the planned outcomes and the actual ones then either replanning is needed to bring the project back on target or the target will have to be revised. ✓ The above Figure illustrates a model of the project control cycle and shows how, once the initial project plan has been published, project control is a continual process of monitoring progress against that plan and, where necessary, revising the plan to take account of deviations. ✓ It also illustrates the important steps that must be taken after completion of the project so that the experienced gained in any one project can feed into the planning stages of future projects. thus allowing us to learn from past mistakes
  • 2. SOFTWARE PROJECT MANAGEMENT (Elective - 2) Page 2 of 12 Responsibility: • Project steering committee • Project board • Reporting formal or informal ▪ The overall responsibility for ensuring satisfactory progress on a project is often the role of the project steering committee or Project Board. ▪ Day-to-day responsibility will rest with the project manager and, in all but the smallest of projects, aspects of this can be delegated to team leaders. ▪ The above Figure illustrates the typical reporting structure found with medium and The concept of a reporting large projects. ▪ With small projects (employing around half a dozen or fewer staff) individual team members usually report directly to the project manager ▪ Reporting may be oral or written, formal or informal, or regular or ad hoc and some examples of each type are given in Table. Report Type Examples Comment Oral formal regular weekly or monthly progress meetings while reports may be oral formal written minutes should be kept Oral formal ad hoc end-of-stage review meetings while largely oral, likely to receive and generate written reports Written formal regular Job sheets, progress reports normally weekly using forms Written formal ad hoc exception reports, change reports often provides early warning; must be backed up by formal reporting Oral informal ad hoc canteen discussion, social interaction Assessing progress: Progress assessment will normally be made on the basis of information collected and collated at regular intervals or when specific events occur. Wherever possible, this information will be objective and tangible - whether or not a particular report has been delivered, for example. However, such end-of-activity deliverables might not occur sufficiently frequently throughout the life of the project. Here progress assessment will have to rely on the judgment of the team members who are carrying out the project activities.
  • 3. SOFTWARE PROJECT MANAGEMENT (Elective - 2) Page 3 of 12 Setting checkpoints: It is essential to set a series of checkpoints in the initial activity plan. Checkpoints may be: ▪ Regular (Monthly, for example) ▪ Tied to specific events such as the production of a report or other deliverable. It is always important to have visible milestones in the life cycle where various stakeholders meet, face to face, to discuss progress and plans. The purpose of these events is not only to demonstrate how well a project is performing but also to achieve the following: • Synchronize stakeholder expectations and achieve concurrence on three evolving perspectives: the requirements, the design, and the plan • Synchronize related artifacts into a consistent and balanced state • Identify the important risks, issues, and out-of-tolerance conditions Key Points ▲ Three sequences of project checkpoints are used to synchronize stakeholder expectations throughout the life cycle: major milestones, minor milestones, and status assessments. ▲ The most important major milestone is usually the event that transitions the project from the elaboration phase into the construction phase. ▲ The format and content of minor milestones are highly dependent on the project and the organizational culture. ▲ Periodic status assessments are crucial for focusing continuous attention on the evolving health of the project and its dynamic priorities. Taking snap-shots: The frequency with which the a manager needs to receive information about progress will depend upon the size and degree of risk of the project or that part of the project under their control. Team leaders, for example, need to assess progress daily (particularly when employing inexperienced staff) whereas project managers may find weekly or monthly reporting appropriate. In general, the higher the level, the less frequent and less detailed the reporting needs to be. There are, however, strong arguments in favour of formal weekly collection of information from staff carrying out activities. Collecting data at the end of each week ensures that information is provided while memories are still relatively fresh and provides a mechanism for individuals to review and reflect upon their progress during the past few days. Progress Monitoring: Having collected data about project progress, a manager needs some way of presenting that data to greatest effect. In this section, we look at some methods of presenting a picture of the project and its future. Some of these methods (such as Gantt charts) provide a static picture, a single snap-shot, whereas others (such as time-line charts) try to show how the project has progressed and changed through time. The Gantt chart: Definition: A Gantt chart is a useful graphical tool which shows activities or tasks performed against time. It is also known as visual presentation of a project where the activities are broken down and displayed on a chart which makes it is easy to understand and interpret. • A Gantt chart is a popular tool in project management. It basically drills down activities which need to be done by a fixed time period. It is commonly used for tracking project schedules. • A Gantt chart is a popular tool in project management. It basically drills down activities which need to be done by a fixed time period. It is commonly used for tracking project schedules. • On the chart, tasks are shown on the vertical axis while the scheduled time-spend is laid out on the horizontal axis. Each task is represented by a bar that shows the time required for the project. • The bar then represents or shows percentage of tasks that have been completed. It also shows dependencies, which simply means the interlinkages between various activities in the project.
  • 4. SOFTWARE PROJECT MANAGEMENT (Elective - 2) Page 4 of 12 It is One of the simplest and oldest techniques for tracking project progress is the Gantt chart. This is essentially an activity bar chart indicating scheduled activity dates. Reported progress is recorded on the chart (normally by shading activity bars) and a 'today cursor' provides an immediate visual indication of which activities are ahead or behind schedule. This shows an example of Gantt chart as at the end of Tuesday of week 17. Code & test module D has been completed ahead of schedule and code & test module A appears also to be ahead of schedule. The coding and testing of the other two modules are behind schedule. The slip chart: A slip chart is a very similar alternative favoured by some project managers who believe it provides a more striking visual indication of those activities that are not progressing to schedule - the more the slip line bends, the greater the variation from the plan. Additional slip lines are added at intervals and, as they build up, the project manager will gain an idea as to whether the project is improving (subsequent slip lines bend less) or not. A very jagged slip line indicates a need for rescheduling.
  • 5. SOFTWARE PROJECT MANAGEMENT (Elective - 2) Page 5 of 12 Ball charts A somewhat more striking way of showing whether or not targets have been met is to use a ball chart as in Figure. In this version of the ball chart, the circles indicate start and completion points for activities. The circles initially contain the original scheduled dates. Whenever revisions are produced these are added as second dates in the appropriate circle until an activity is actually started or completed when the relevant date replaces the revised estimate (in bold italic). Circles will therefore contain only two dates, the original and most recent target dates, or the original and actual dates. Where the actual start or finish date for an activity is later than the target date, the circle is coloured red (dark grey in Figure 9.7) - where an actual date is on time or earlier than the target then the circle is coloured green (light grey in Figure 9.7). Such charts are frequently placed in a prominent position and the colour coded balls provide a constant reminder to the project team. Where more than one team is working in close proximity, such a highly visible record of achievement can encourage competitiveness between teams. The timeline chart: A timeline chart is an effective way to visualize a process using chronological order Since details are displayed graphically, important points in time can be easy seen and understood. Often used for managing a project’s schedule, timeline charts function as a sort of calendar of events within a specific period of time. Why make Timeline Charts? Staying on track can be a struggle. By incorporating a timeline chart into the project, it becomes much easier to see what needs to be done, how long it will take, and what the next steps are. Since each steps is documented along an easy to follow timescale, there’s no misunderstanding of when goals should be met and how many hours a project should take. One disadvantage of the charts described so far is that they do not show clearly the slippage of the project completion date through the life of the project. Knowing the current state of a project helps in revising plans to bring it back on target, but analyzing and understanding trends helps to avoid slippage in future projects.
  • 6. SOFTWARE PROJECT MANAGEMENT (Elective - 2) Page 6 of 12 The timeline chart is a method of recording and displaying the way in which targets have changed throughout the duration of the project. Planned time is plotted along the horizontal axis and elapsed time down the vertical axis. The lines meandering down the chart represent scheduled activity completion dates - at the start of the project analyze existing system is scheduled to be completed by the Tuesday of week 3, obtainuser requirements by Thursday of week 5, issue tender, the final activity, by Tuesday of week 9, and so on. At the end of the first week Project Manager reviews these target dates and leaves them as they are - lines are therefore drawn vertically downwards from the target dates to the end of week one on the actual time axis. Cost monitoring: Expenditure monitoring is an important component of project control. Not only in itself, but also because it provides an indication of the effort that has gone into (or at least been charged to) a project. A project might be on time but only because more money has been spent on activities than originally budgeted. A cumulative expenditure chart such as that shown in Figure provides a simple method of comparing actual and planned expenditure. By itself it is not particularly meaningful - for example, illustrate a project that is running late or one that is on time but has shown substantial costs savings! We need to take account of the current status of the project activities before attempting to interpret the meaning of recorded expenditure. Cost charts become much more useful if we add projected future costs calculated by adding the estimated costs of uncompleted work to the costs already incurred. Where a computer-based planning tool is used, revision of cost schedules is generally provided automatically once actual expenditure has been recorded Earne d value Analy sis: Earned Value Analysis has gained popularity in recent years and may be seen as a refinement of the cost monitoring discussed in the previous section. Earned Value Analysis is based on assigning a 'value' to each task or work package (as identified in the WBS) based on the original expenditure forecasts. The assigned value is the original budgeted cost for the item and is known as the baseline budget or budgeted cost of work scheduled (BCWS). A task that has not started is assigned the value zero and when it has been completed, it, and hence the project, is credited with the value of the task. The total value credited to a project at any point is known as the earned value or budgeted cost of work performed (BCWP) and this can be represented as a value or as a percentage of the BCWS. Where tasks have been started but are not yet complete, some consistent method of assigning an earned value must be applied. Common methods in software projects are: • The 0/100 technique: Where a task is assigned a value of zero until such time that it is completed when it is given a value of 100% of the budgeted value; • The 50/50 technique: Where a task is assigned a value of 50% of its value as soon as it is started and then given a value of 100% once it is complete; • The milestone technique: Where a task is given a value based on the achievement of milestones that have been assigned values as part of the original budget plan. Of these, we prefer the 0/100 technique. The 50/50 technique can give a false sense of security by
  • 7. SOFTWARE PROJECT MANAGEMENT (Elective - 2) Page 7 of 12 over-valuing the reporting of activity starts. The milestone technique might be appropriate for activities with a long duration estimate but, in such cases, it is better to break that activity into a number of smaller ones. The baseline budget: The first stage in setting up an earned value analysis is to create the baseline budget. The baseline budget is based on the project plan and shows the forecast growth in earned value through time. Earned value may be measured in monetary values but, in the case of staff-intensive projects such as software development, it is common to measure earned value in person-hours or workdays. Task Budgeted workdays Scheduled completion Cumulative workdays % cumulative earned Specify overall system 34 34 34 14.5 Specify module A 20 54 84 35.44 Check specifications 2 56 86 36.28 Design module A 7 63 97 40.93 Monitoring earned value: Having created the baseline budget, the next task is to monitor earned value as the project progresses. This is done by monitoring the completion of tasks (or activity starts and milestone achievements in the case of the other crediting techniques). As well as recording BCWP, the actual cost of each task can be collected as actual cost of work performed, ACWP. This is shown in Figure, which, in this case, records the values as percentages of the total budgeted cost. Budget variance: This can be calculated as ACWP - BCWS and indicates the degree to which actual costs differ from those planned. Schedule variance: The schedule variance is measured in cost terms as BCWP -BCWS and indicates the degree to which the value of completed work differs from that planned. Cost variance: This is calculated as BCWP - ACWP and indicates the difference between the budgeted cost and the actual cost of completed work. It is also an indicator of the accuracy of the original cost estimates. Performance ratios: Two ratios are commonly tracked: the cost performance index (CPI = BCWP/ACWP) and the schedule performance index (SPI = BCWP/ BCWS). They can be thought of as a 'value-for-money* indices. A value greater than one indicates that work is being completed better than planned whereas a value of less than one means that work is costing more than and/or proceeding more slowly than planned. Defects Tracking: -- Tracking Defects is a key point in project tracking. -- Once information about a defect is entered in this system, it remains open until it has been fixed. -- The defect is marked as “Closed” when its removal has been verified. In this way is defect is logged and tracked to closure. -- Sometimes project managers track the state of a defect by recording the date of submission and the date of closure for each defect. -- At the end of the project ideally no open defects should remain. -- At any time, the project manager can check the overall rate of defect injection and defect closure.
  • 8. SOFTWARE PROJECT MANAGEMENT (Elective - 2) Page 8 of 12 Issues Tracking: -- Inevitably, many small jobs or clarifications come up during a project. These problems are called as Issues. -- Managing issues is an important task for any project manager because they potentially delay a project. -- Because any team member can raise an issue, the list of issues can be very large. -- Formal methods are therefore useful for tracking them. For this purpose project's usually open an issue log. --In this issue log, issues are recorded as they arise, along with related information. -- When issues are closed they are marked as closed. -- For this issue log project managers can use a spreadsheet, document or use the defect tracking system. Status reports: -- Status reports are the main mechanism for regularly communicating the state of the project to senior management and the customer. -- The parties who recieve the status reports are specified in the project management plan. -- Typically, status reports are generated weekly and contains these items: - Customer complaints - Milestones achieved this week - Milestones missed this week and reasons for them - Milestones planned for the next week - Issues requiring clarification or attention - Estimated work versus available time by milestones. - Escalation
  • 9. SOFTWARE PROJECT MANAGEMENT (Elective - 2) Page 9 of 12 Types of Resources: A resource is any item or person required for the execution of the project. This covers many things - from paper clips to key personnel - and it is unlikely that we would wish to itemize every resource required, let alone draw up a schedule for their use! Stationery and other standard office supplies, for example, need not normally be the concern of the project manager - ensuring there is always an adequate supply is the role of the office manager. The project manager must concentrate on those resources where there is a possibility that, without planning, they might not be sufficiently available when required. Some resources, such as a project manager, will be required for the duration of the project whereas others, such as a specific software developer, might be required for a single activity. The former, while vital to the success of the project, does not require the same level of scheduling as the latter. Individual programmers, for example, might be committed to working on a number of projects and it will be important to book their time well in advance. In general, resources will fall into one of seven categories. Labour: The main items in this category will be members of the development project team such as the project manager, systems analysts and software developers. liqually important will be the quality assurance team and other support staff and any employees of the client organization who might be required to undertake or participate in specific activities. Equipment: Obvious items will include workstations and other computing and office equipment. We must not forget that staff also need basic equipment such as desks and chairs. Materials: Materials are items that are consumed, rather than equipment that is used. They are of little consequence in most software projects but can be important for some - software that is to be widely distributed might, for example, require supplies of floppy disks to be specially obtained. Space: For projects that are undertaken w ith existing staff, space is normally readily available. If any additional staff (recruited or contracted) should be needed then office space will need to be found. Services: Some projects will require procurement of specialist services -development of a wide area distributed system, for example, requires scheduling of telecommunications services. Time is the resource that is being offset against the other primary The cost of money as a resources - project time-scales can sometimes be reduced by increasing other resource is a factor taken resources and will almost certainly be extended if they arc unexpectedly into account in DCF reduced. evaluation. Money: Money is a secondary resource - it is used to buy other resources and will be consumed as other resources are used. It is similar to other resources in that it is available at a cost - in this case interest charges. Identifying resource requirements: The first step in producing a resource allocation plan is to list the resources that will be required along with the expected level of demand. This will normally be done by considering each activity in turn and identifying the resources required. It is likely, however, that there will also be resources required that are not activity specific but are part of the project's infrastructure (such as the project manager) or required to support other resources (office space, for example, might be required to house contract software developers).
  • 10. SOFTWARE PROJECT MANAGEMENT (Elective - 2) Page 10 of 12 Resource Scheduling: over the duration of the project. -- Having produce d the resource require ments list, the next stage is to map this onto the activity plan to assess the distribut ion of resource s required -- This is best done by representing the activity plan as a bar chart and using this to produce a resource histogram for each resource.
  • 11. SOFTWARE PROJECT MANAGEMENT (Elective - 2) Page 11 of 12 -- Changing the level of resources on a project over time, particularly personnel, generally adds to the cost of a project. Recruiting staff has costs and even where staff are transferred internally,time will be needed for familiarization w ith the new project environment. -- The resource histogram in Figure poses particular problems in that it calls for two analyst- designers to be idle for eleven days, one for six days and one for two days between the specification and design stage. -- White rectangles indicate when an activity is scheduled and shaded rectangles the total floatt. Resource Smoothing: “A technique that adjusts the activities of a schedule model such that the requirements for resources on the project do not exceed certain predefined resource limits.” In practice, resources have to be allocated to a project on an activity-by-activity basis and finding the 'best' allocation can be time consuming and difficult. As soon as a member of the project team is allocated to an activity that activity acquires a scheduled start and finish date and the team member becomes unavailable for other activities for that period. Thus, allocating a resource to one activity limits the flexibility for resource allocation and scheduling of other activities. It is therefore helpful to prioritize activities so that resources can be allocated to competing
  • 12. SOFTWARE PROJECT MANAGEMENT (Elective - 2) Page 12 of 12 activities in some rational order. The priority must always be to allocate resources to critical path activities and then to those activities that are most likely to affect others. In that way, lower priority activities are made to fit around the more critical, already scheduled activities. Of the various ways of prioritizing activities, two are described below. --Total float priority: Activities are ordered according to their total float, those with the smallest total float having the highest priority. In the simplest application of this method, activities are allocated resources in ascending order of total float. However, as scheduling proceeds, activities will be delayed (if resources are not available at their earliest start dates) and total floats will be reduced. It is therefore desirable to recalculate floats (and hence reorder the list) each time an activity is delayed. -- Ordered list priority: With this method, activities that can proceed at the same time are ordered according to a set of simple criteria. An example of this is Burman's priority list, which takes into account activity duration as well as total float: 1. shortest critical activity; 2. critical activities; 3. shortest non-critical activity; 4. non-critical activity with least float; 5. non-critical activities.