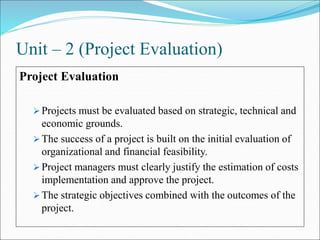
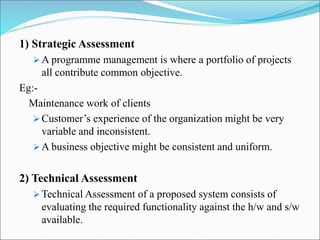
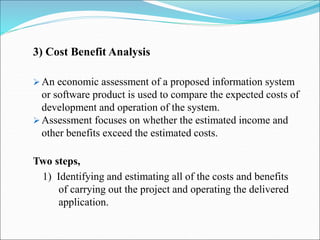
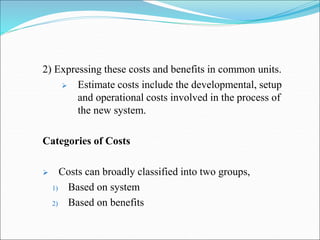
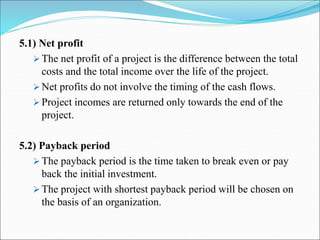
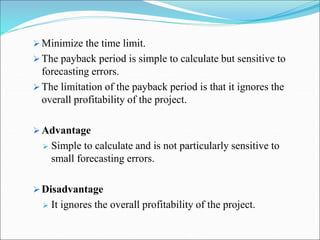
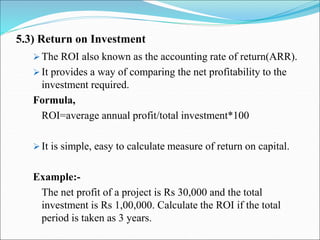
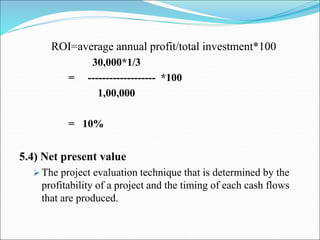
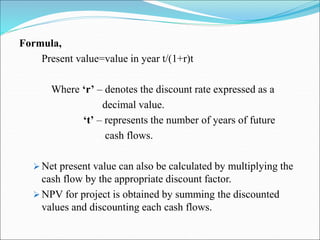
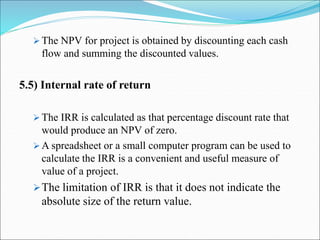
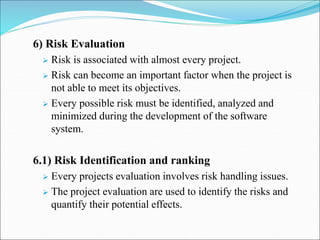
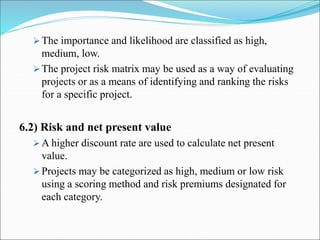
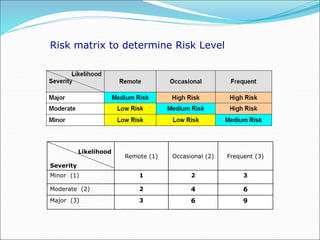
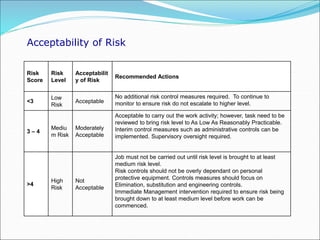
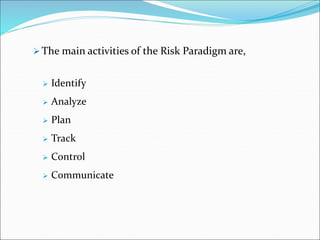
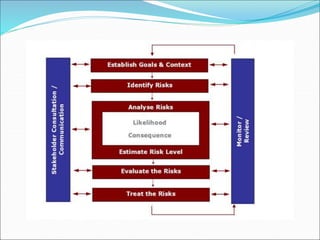
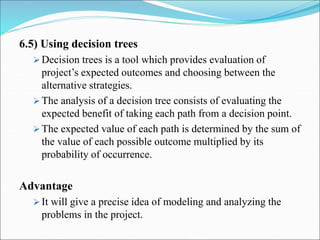
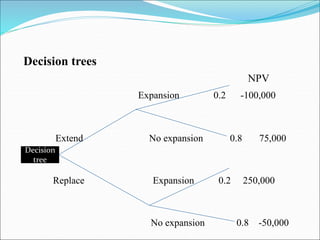
Unit – II Presentation
Unit – 2 (Project Evaluation)
Project Evaluation
 Projects must be evaluated based on strategic, technical and
economic grounds.
 The success of a project is built on the initial evaluation of
organizational and financial feasibility.
 Project managers must clearly justify the estimation of costs
implementation and approve the project.
 The strategic objectives combined with the outcomes of the
project.
1) Strategic Assessment
 A programme management is where a portfolio of projects
all contribute common objective.
Eg:-
Maintenance work of clients
 Customer’s experience of the organization might be very
variable and inconsistent.
 A business objective might be consistent and uniform.
2) Technical Assessment
 Technical Assessment of a proposed system consists of
evaluating the required functionality against the h/w and s/w
available.
A uniform and consistent hardware/software infrastructure
is likely to place limitations on the nature of technical
solutions.
A uniform and consistent infrastructure must be defined by
the organizational policy so that there are no limitations
raised.
3) Cost Benefit Analysis
 An economic assessment of a proposed information system
or software product is used to compare the expected costs of
development and operation of the system.
 Assessment focuses on whether the estimated income and
other benefits exceed the estimated costs.
Two steps,
1) Identifying and estimating all of the costs and benefits
of carrying out the project and operating the delivered
application.
2) Expressing these costs and benefits in common units.
 Estimate costs include the developmental, setup
and operational costs involved in the process of
the new system.
Categories of Costs
 Costs can broadly classified into two groups,
1) Based on system
2) Based on benefits
 Many costs are easy to identify and measure in monetary
terms.
 Costs categories are,
 Development costs
 Setup costs
 Operational costs
Benefits that are obtained when installing a new system
can be classified as,
 Quantified and valued benefits
 Quantified but not valued benefits
 Identified but not easily valued.
4) Cash Flow Forecasting
Estimating the overall costs and benefits of a project is the
forecasting.
A cash flow forecast will indicate when expenditure and
income will take place.
Typical Product Life Cycle Cash Flow
Expenditures occur by means of staff wages during the
development stages of the project.
At the same instance, unless income is received, expenses
cannot be deferred.
Typical product life cycle cash flow
Income
Expenditure Time
 Accurate cash flow forecasting is not easy.
 When estimating future cash flows, it is usual to ignore the
effects of inflation.
 Forecasts of inflation rates tend to be uncertain.
 If expenditure is increased due to inflation it is likely that
income will increase proportionately.
5) Cost Benefit Evaluation Techniques
Cost-benefit analysis is a set of practical procedures for guiding
public expenditure decisions.
Project evaluation usually requires comparing costs and
benefits from different time periods.
Cash flow forecasting can be compared for different projects
based on same general methods defined,
 Net profit
 Payback period
 Return on Investment
 Net Present Value
 Internal Rate of return
5.1) Net profit
 The net profit of a project is the difference between the total
costs and the total income over the life of the project.
 Net profits do not involve the timing of the cash flows.
 Project incomes are returned only towards the end of the
project.
5.2) Payback period
 The payback period is the time taken to break even or pay
back the initial investment.
 The project with shortest payback period will be chosen on
the basis of an organization.
 Minimize the time limit.
 The payback period is simple to calculate but sensitive to
forecasting errors.
 The limitation of the payback period is that it ignores the
overall profitability of the project.
 Advantage
 Simple to calculate and is not particularly sensitive to
small forecasting errors.
 Disadvantage
 It ignores the overall profitability of the project.
5.3) Return on Investment
 The ROI also known as the accounting rate of return(ARR).
 It provides a way of comparing the net profitability to the
investment required.
Formula,
ROI=average annual profit/total investment*100
 It is simple, easy to calculate measure of return on capital.
Example:-
The net profit of a project is Rs 30,000 and the total
investment is Rs 1,00,000. Calculate the ROI if the total
period is taken as 3 years.
ROI=average annual profit/total investment*100
30,000*1/3
= ------------------- *100
1,00,000
= 10%
5.4) Net present value
 The project evaluation technique that is determined by the
profitability of a project and the timing of each cash flows
that are produced.
Formula,
Present value=value in year t/(1+r)t
Where ‘r’ – denotes the discount rate expressed as a
decimal value.
‘t’ – represents the number of years of future
cash flows.
 Net present value can also be calculated by multiplying the
cash flow by the appropriate discount factor.
 NPV for project is obtained by summing the discounted
values and discounting each cash flows.
 The NPV for project is obtained by discounting each cash
flow and summing the discounted values.
5.5) Internal rate of return
 The IRR is calculated as that percentage discount rate that
would produce an NPV of zero.
 A spreadsheet or a small computer program can be used to
calculate the IRR is a convenient and useful measure of
value of a project.
The limitation of IRR is that it does not indicate the
absolute size of the return value.
6) Risk Evaluation
 Risk is associated with almost every project.
 Risk can become an important factor when the project is
not able to meet its objectives.
 Every possible risk must be identified, analyzed and
minimized during the development of the software
system.
6.1) Risk Identification and ranking
 Every projects evaluation involves risk handling issues.
 The project evaluation are used to identify the risks and
quantify their potential effects.
 The importance and likelihood are classified as high,
medium, low.
 The project risk matrix may be used as a way of evaluating
projects or as a means of identifying and ranking the risks
for a specific project.
6.2) Risk and net present value
 A higher discount rate are used to calculate net present
value.
 Projects may be categorized as high, medium or low risk
using a scoring method and risk premiums designated for
each category.
Risk matrix to determine Risk Level
Likelihood
Severity
Remote (1) Occasional (2) Frequent (3)
Minor (1) 1 2 3
Moderate (2) 2 4 6
Major (3) 3 6 9
Acceptability of Risk
Risk
Score
Risk
Level
Acceptabilit
y of Risk
Recommended Actions
<3
Low
Risk
Acceptable
No additional risk control measures required. To continue to
monitor to ensure risk do not escalate to higher level.
3 – 4
Mediu
m Risk
Moderately
Acceptable
Acceptable to carry out the work activity; however, task need to be
reviewed to bring risk level to As Low As Reasonably Practicable.
Interim control measures such as administrative controls can be
implemented. Supervisory oversight required.
>4
High
Risk
Not
Acceptable
Job must not be carried out until risk level is brought to at least
medium risk level.
Risk controls should not be overly dependant on personal
protective equipment. Controls measures should focus on
Elimination, substitution and engineering controls.
Immediate Management intervention required to ensure risk being
brought down to at least medium level before work can be
commenced.
6.3) Cost benefit analysis
 The evaluation of risk are considered based on the possible
outcome and estimate its probability.
 The value of the project is then obtained by summing the
cost or benefit for each possible outcome weighted by its
corresponding probability.
 It is used in evaluation of large projects.
 It is most appropriate to evaluate a portfolio of projects to
determine the overall profitability.
6.4) Risk profile analysis
 The construction of risk profiles uses the sensitivity
analysis.
 It evaluate the sensitivity of the project to each factor.
 Sensitivity analysis vary each factor one at a time.
 Sensitivity analysis identifies the factors that yields a
success to the project and decide about whether to carry on
with the project or lay off.
 The simulation tool is used to find out the number of
possible chances of specific project.
 The main activities of the Risk Paradigm are,
 Identify
 Analyze
 Plan
 Track
 Control
 Communicate
6.5) Using decision trees
 Decision trees is a tool which provides evaluation of
project’s expected outcomes and choosing between the
alternative strategies.
 The analysis of a decision tree consists of evaluating the
expected benefit of taking each path from a decision point.
 The expected value of each path is determined by the sum of
the value of each possible outcome multiplied by its
probability of occurrence.
Advantage
 It will give a precise idea of modeling and analyzing the
problems in the project.
Decision trees
NPV
Expansion 0.2 -100,000
Extend No expansion 0.8 75,000
Replace Expansion 0.2 250,000
No expansion 0.8 -50,000
Decision
tree

software-project-management-unit-2.ppt

  • 1.
    Unit – IIPresentation
  • 2.
    Unit – 2(Project Evaluation) Project Evaluation  Projects must be evaluated based on strategic, technical and economic grounds.  The success of a project is built on the initial evaluation of organizational and financial feasibility.  Project managers must clearly justify the estimation of costs implementation and approve the project.  The strategic objectives combined with the outcomes of the project.
  • 3.
    1) Strategic Assessment A programme management is where a portfolio of projects all contribute common objective. Eg:- Maintenance work of clients  Customer’s experience of the organization might be very variable and inconsistent.  A business objective might be consistent and uniform. 2) Technical Assessment  Technical Assessment of a proposed system consists of evaluating the required functionality against the h/w and s/w available.
  • 4.
    A uniform andconsistent hardware/software infrastructure is likely to place limitations on the nature of technical solutions. A uniform and consistent infrastructure must be defined by the organizational policy so that there are no limitations raised.
  • 5.
    3) Cost BenefitAnalysis  An economic assessment of a proposed information system or software product is used to compare the expected costs of development and operation of the system.  Assessment focuses on whether the estimated income and other benefits exceed the estimated costs. Two steps, 1) Identifying and estimating all of the costs and benefits of carrying out the project and operating the delivered application.
  • 6.
    2) Expressing thesecosts and benefits in common units.  Estimate costs include the developmental, setup and operational costs involved in the process of the new system. Categories of Costs  Costs can broadly classified into two groups, 1) Based on system 2) Based on benefits
  • 7.
     Many costsare easy to identify and measure in monetary terms.  Costs categories are,  Development costs  Setup costs  Operational costs Benefits that are obtained when installing a new system can be classified as,  Quantified and valued benefits  Quantified but not valued benefits  Identified but not easily valued.
  • 8.
    4) Cash FlowForecasting Estimating the overall costs and benefits of a project is the forecasting. A cash flow forecast will indicate when expenditure and income will take place. Typical Product Life Cycle Cash Flow Expenditures occur by means of staff wages during the development stages of the project. At the same instance, unless income is received, expenses cannot be deferred.
  • 9.
    Typical product lifecycle cash flow Income Expenditure Time  Accurate cash flow forecasting is not easy.  When estimating future cash flows, it is usual to ignore the effects of inflation.  Forecasts of inflation rates tend to be uncertain.  If expenditure is increased due to inflation it is likely that income will increase proportionately.
  • 10.
    5) Cost BenefitEvaluation Techniques Cost-benefit analysis is a set of practical procedures for guiding public expenditure decisions. Project evaluation usually requires comparing costs and benefits from different time periods. Cash flow forecasting can be compared for different projects based on same general methods defined,  Net profit  Payback period  Return on Investment  Net Present Value  Internal Rate of return
  • 11.
    5.1) Net profit The net profit of a project is the difference between the total costs and the total income over the life of the project.  Net profits do not involve the timing of the cash flows.  Project incomes are returned only towards the end of the project. 5.2) Payback period  The payback period is the time taken to break even or pay back the initial investment.  The project with shortest payback period will be chosen on the basis of an organization.
  • 12.
     Minimize thetime limit.  The payback period is simple to calculate but sensitive to forecasting errors.  The limitation of the payback period is that it ignores the overall profitability of the project.  Advantage  Simple to calculate and is not particularly sensitive to small forecasting errors.  Disadvantage  It ignores the overall profitability of the project.
  • 13.
    5.3) Return onInvestment  The ROI also known as the accounting rate of return(ARR).  It provides a way of comparing the net profitability to the investment required. Formula, ROI=average annual profit/total investment*100  It is simple, easy to calculate measure of return on capital. Example:- The net profit of a project is Rs 30,000 and the total investment is Rs 1,00,000. Calculate the ROI if the total period is taken as 3 years.
  • 14.
    ROI=average annual profit/totalinvestment*100 30,000*1/3 = ------------------- *100 1,00,000 = 10% 5.4) Net present value  The project evaluation technique that is determined by the profitability of a project and the timing of each cash flows that are produced.
  • 15.
    Formula, Present value=value inyear t/(1+r)t Where ‘r’ – denotes the discount rate expressed as a decimal value. ‘t’ – represents the number of years of future cash flows.  Net present value can also be calculated by multiplying the cash flow by the appropriate discount factor.  NPV for project is obtained by summing the discounted values and discounting each cash flows.
  • 16.
     The NPVfor project is obtained by discounting each cash flow and summing the discounted values. 5.5) Internal rate of return  The IRR is calculated as that percentage discount rate that would produce an NPV of zero.  A spreadsheet or a small computer program can be used to calculate the IRR is a convenient and useful measure of value of a project. The limitation of IRR is that it does not indicate the absolute size of the return value.
  • 17.
    6) Risk Evaluation Risk is associated with almost every project.  Risk can become an important factor when the project is not able to meet its objectives.  Every possible risk must be identified, analyzed and minimized during the development of the software system. 6.1) Risk Identification and ranking  Every projects evaluation involves risk handling issues.  The project evaluation are used to identify the risks and quantify their potential effects.
  • 18.
     The importanceand likelihood are classified as high, medium, low.  The project risk matrix may be used as a way of evaluating projects or as a means of identifying and ranking the risks for a specific project. 6.2) Risk and net present value  A higher discount rate are used to calculate net present value.  Projects may be categorized as high, medium or low risk using a scoring method and risk premiums designated for each category.
  • 19.
    Risk matrix todetermine Risk Level Likelihood Severity Remote (1) Occasional (2) Frequent (3) Minor (1) 1 2 3 Moderate (2) 2 4 6 Major (3) 3 6 9
  • 20.
    Acceptability of Risk Risk Score Risk Level Acceptabilit yof Risk Recommended Actions <3 Low Risk Acceptable No additional risk control measures required. To continue to monitor to ensure risk do not escalate to higher level. 3 – 4 Mediu m Risk Moderately Acceptable Acceptable to carry out the work activity; however, task need to be reviewed to bring risk level to As Low As Reasonably Practicable. Interim control measures such as administrative controls can be implemented. Supervisory oversight required. >4 High Risk Not Acceptable Job must not be carried out until risk level is brought to at least medium risk level. Risk controls should not be overly dependant on personal protective equipment. Controls measures should focus on Elimination, substitution and engineering controls. Immediate Management intervention required to ensure risk being brought down to at least medium level before work can be commenced.
  • 21.
    6.3) Cost benefitanalysis  The evaluation of risk are considered based on the possible outcome and estimate its probability.  The value of the project is then obtained by summing the cost or benefit for each possible outcome weighted by its corresponding probability.  It is used in evaluation of large projects.  It is most appropriate to evaluate a portfolio of projects to determine the overall profitability. 6.4) Risk profile analysis  The construction of risk profiles uses the sensitivity analysis.
  • 23.
     It evaluatethe sensitivity of the project to each factor.  Sensitivity analysis vary each factor one at a time.  Sensitivity analysis identifies the factors that yields a success to the project and decide about whether to carry on with the project or lay off.  The simulation tool is used to find out the number of possible chances of specific project.
  • 24.
     The mainactivities of the Risk Paradigm are,  Identify  Analyze  Plan  Track  Control  Communicate
  • 26.
    6.5) Using decisiontrees  Decision trees is a tool which provides evaluation of project’s expected outcomes and choosing between the alternative strategies.  The analysis of a decision tree consists of evaluating the expected benefit of taking each path from a decision point.  The expected value of each path is determined by the sum of the value of each possible outcome multiplied by its probability of occurrence. Advantage  It will give a precise idea of modeling and analyzing the problems in the project.
  • 27.
    Decision trees NPV Expansion 0.2-100,000 Extend No expansion 0.8 75,000 Replace Expansion 0.2 250,000 No expansion 0.8 -50,000 Decision tree