Download as PDF, PPTX


![Automatic Model Selection Criteria
from sklearn.cross_validation import KFold
kfolds = KFold(n=len(X), n_folds=12)
scores = [
model.fit(
X[train], y[train]
).score(
X[test], y[test]
)
for train, test in kfolds
]
F1
R2](https://image.slidesharecdn.com/ddrlspring2017-visualizingmodelselectionwithscikit-yellowbrick-170324200737/75/Visualizing-Model-Selection-with-Scikit-Yellowbrick-An-Introduction-to-Developing-Visualizers-9-2048.jpg)
![Try Them All!
from sklearn.svm import SVC
from sklearn.neighbors import KNeighborsClassifier
from sklearn.ensemble import RandomForestClassifier
from sklearn.ensemble import AdaBoostClassifier
from sklearn.naive_bayes import GaussianNB
from sklearn import cross_validation as cv
classifiers = [
KNeighborsClassifier(5),
SVC(kernel="linear", C=0.025),
RandomForestClassifier(max_depth=5),
AdaBoostClassifier(),
GaussianNB(),
]
kfold = cv.KFold(len(X), n_folds=12)
max([
cv.cross_val_score(model, X, y, cv=kfold).mean
for model in classifiers
])](https://image.slidesharecdn.com/ddrlspring2017-visualizingmodelselectionwithscikit-yellowbrick-170324200737/75/Visualizing-Model-Selection-with-Scikit-Yellowbrick-An-Introduction-to-Developing-Visualizers-10-2048.jpg)
![Search Hyperparameter Space
from sklearn.feature_extraction.text import *
from sklearn.linear_model import SGDClassifier
from sklearn.grid_search import GridSearchCV
from sklearn.pipeline import Pipeline
pipeline = Pipeline([
('vect', CountVectorizer()),
('tfidf', TfidfTransformer()),
('model', SGDClassifier()),
])
parameters = {
'vect__max_df': (0.5, 0.75, 1.0),
'vect__max_features': (None, 5000, 10000),
'tfidf__use_idf': (True, False),
'tfidf__norm': ('l1', 'l2'),
'model__alpha': (0.00001, 0.000001),
'model__penalty': ('l2', 'elasticnet'),
}
search = GridSearchCV(pipeline, parameters)
search.fit(X, y)](https://image.slidesharecdn.com/ddrlspring2017-visualizingmodelselectionwithscikit-yellowbrick-170324200737/75/Visualizing-Model-Selection-with-Scikit-Yellowbrick-An-Introduction-to-Developing-Visualizers-11-2048.jpg)


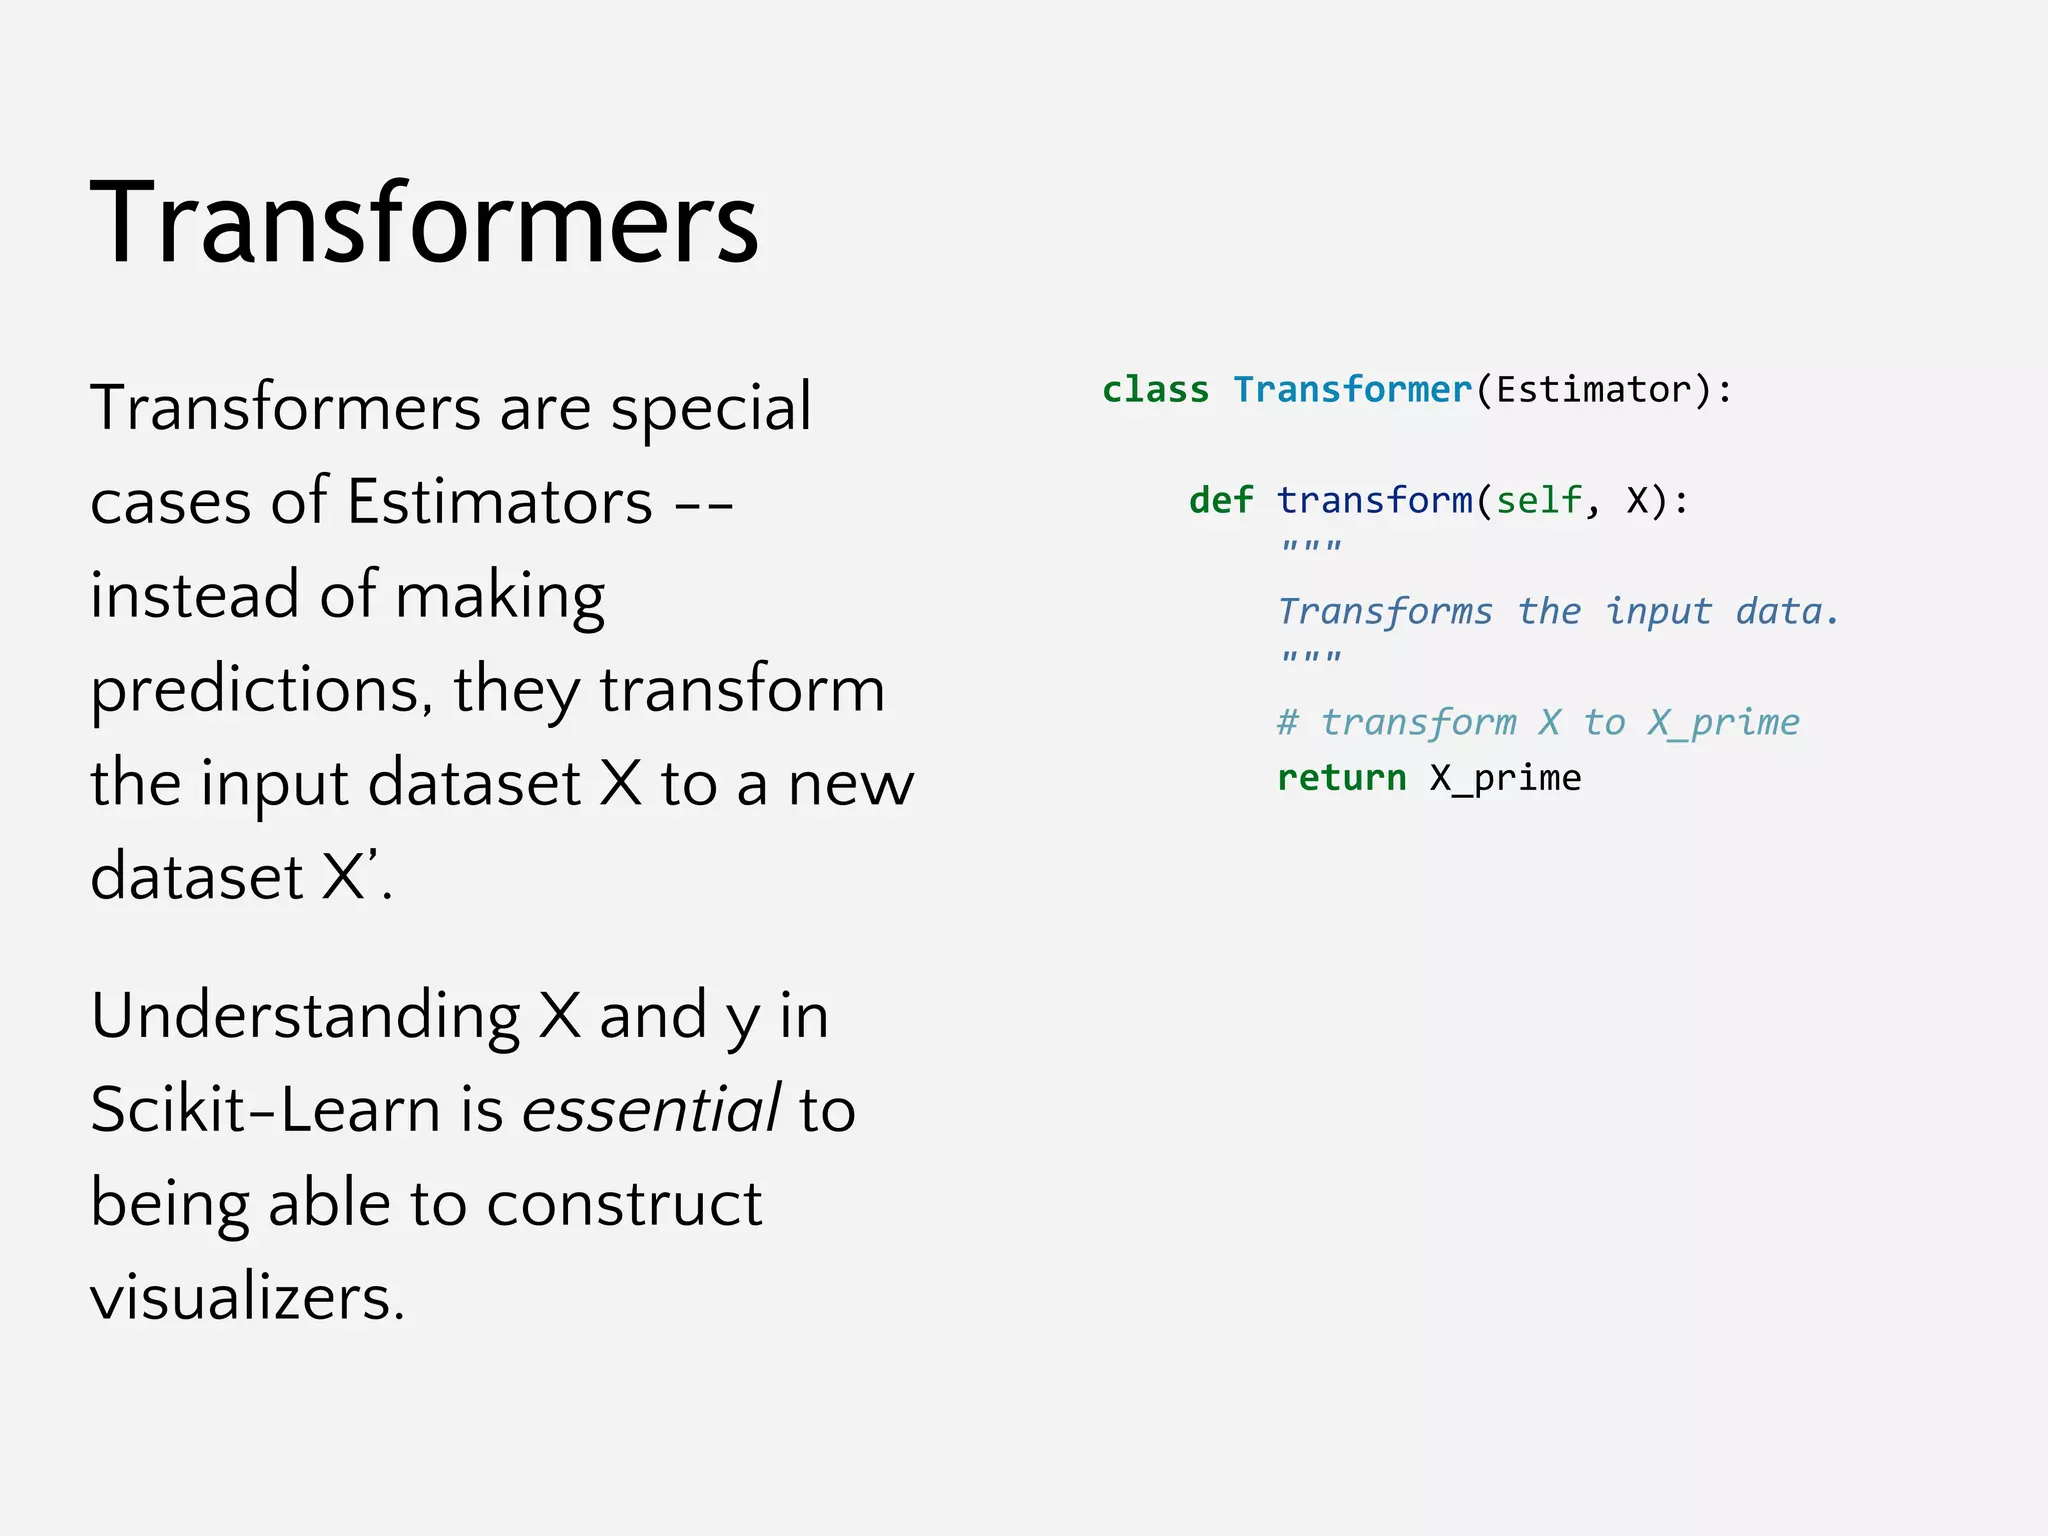
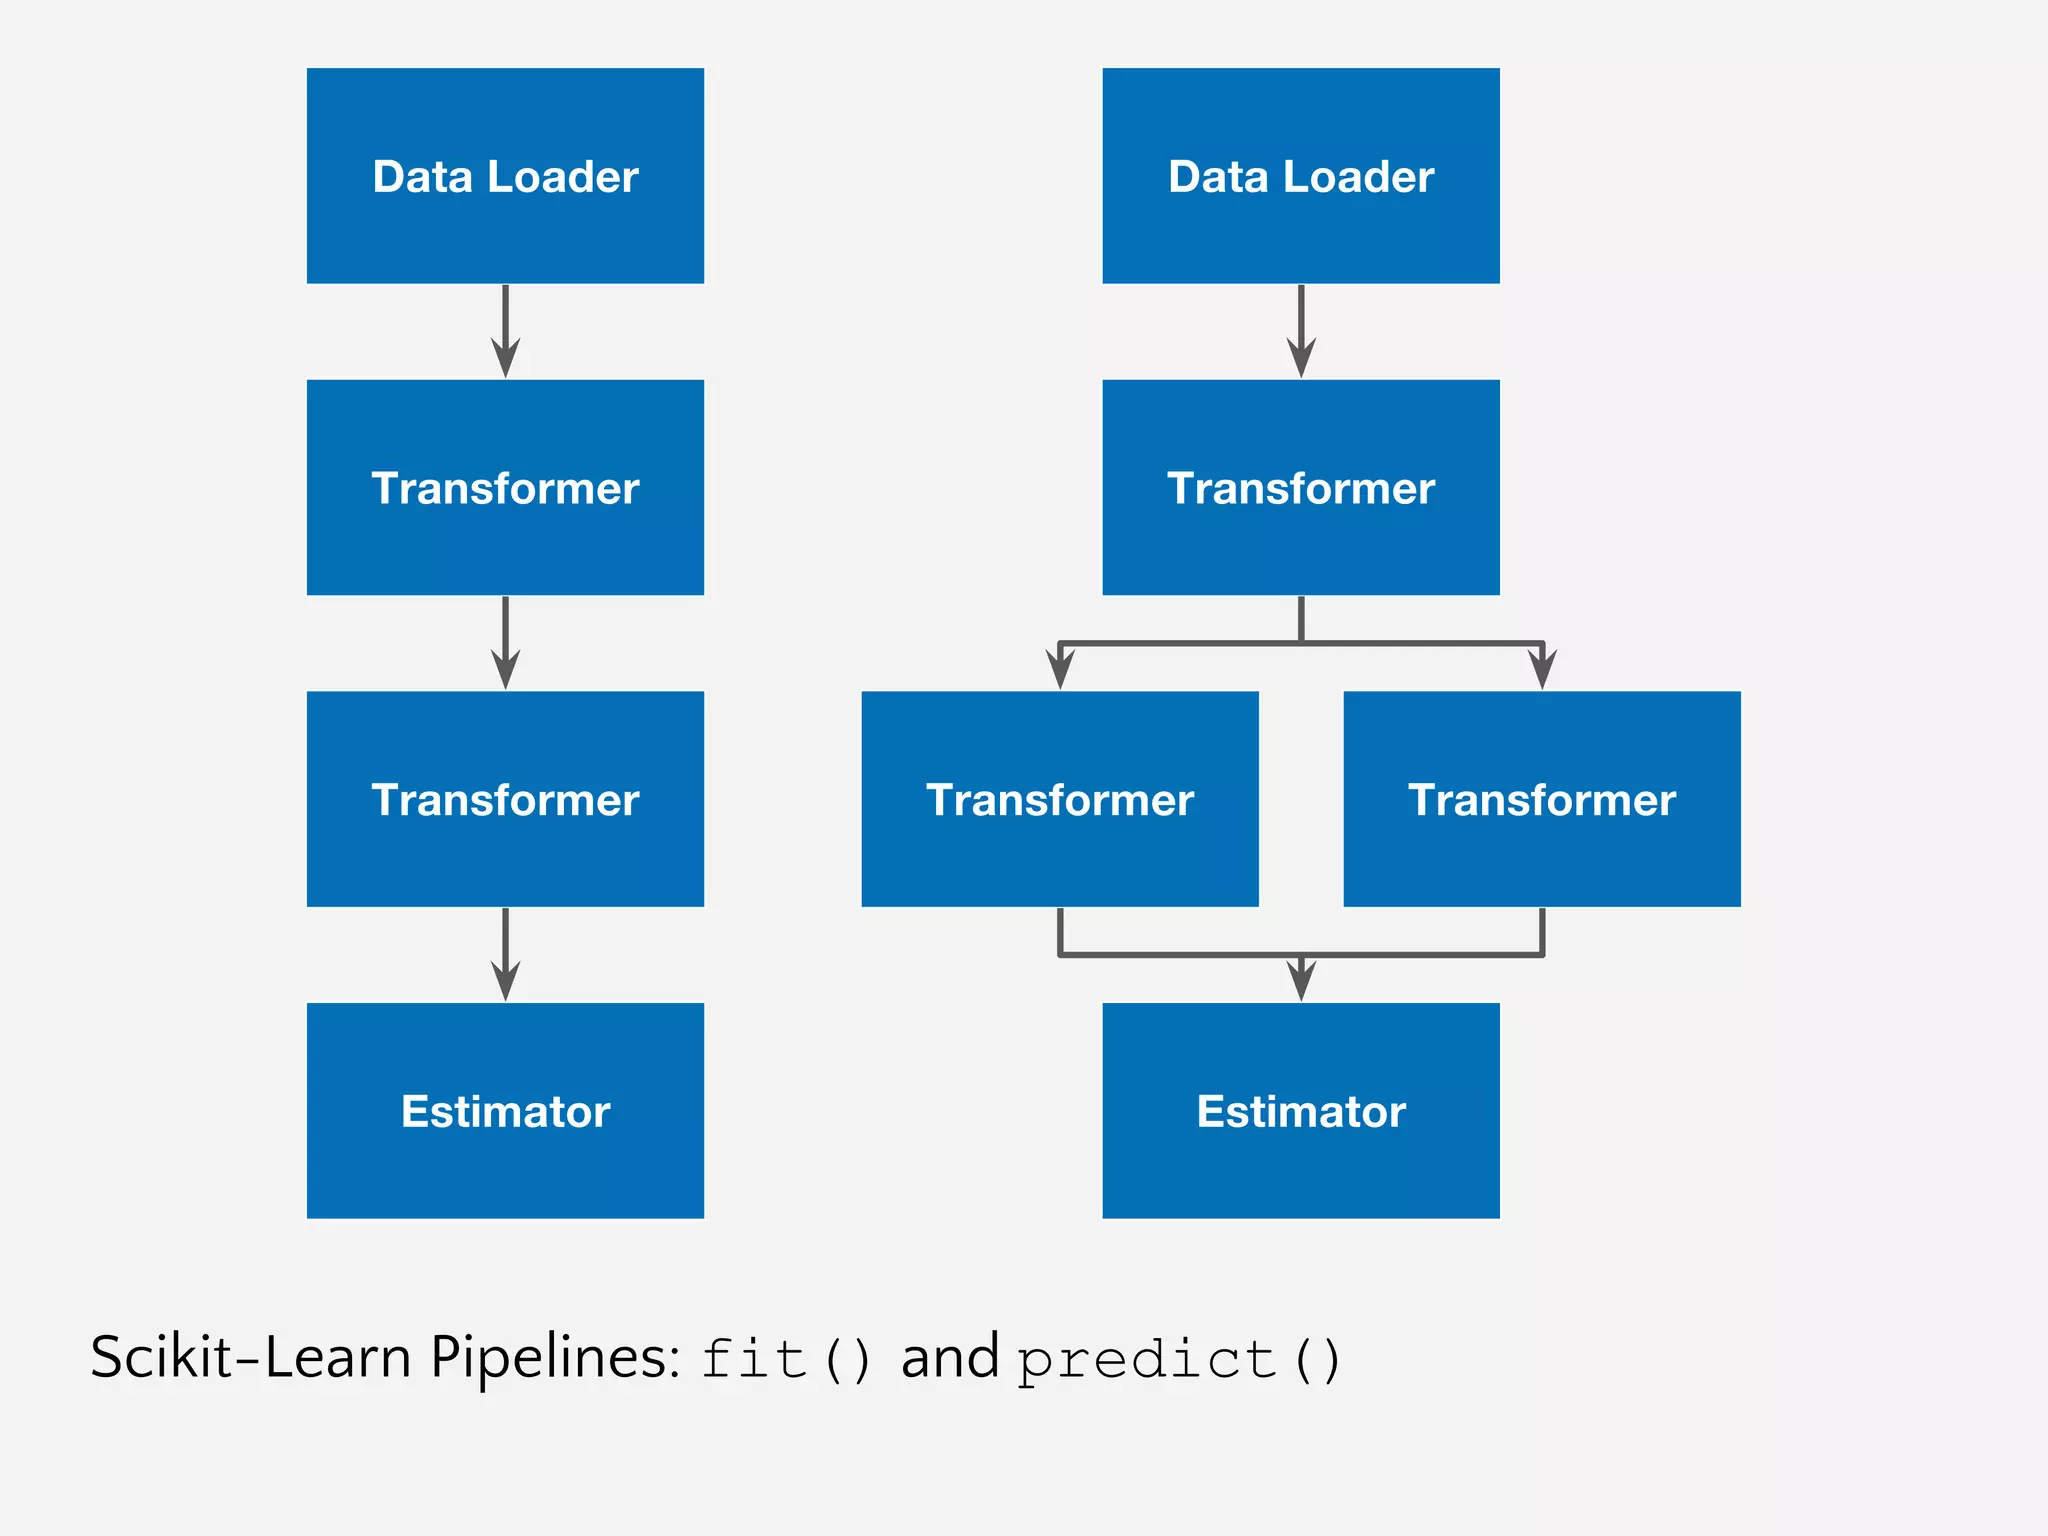
![The purpose of the pipeline is
to assemble several steps that
can be cross-validated and
operationalized together.
Sequentially applies a list of
transforms and a final estimator.
Intermediate steps of the pipeline
must be ‘transforms’, that is, they
must implement fit() and
transform() methods. The final
estimator only needs to implement
fit().
Pipelines
class Pipeline(Transformer):
@property
def named_steps(self):
"""
Sequence of estimators
"""
return self.steps
@property
def _final_estimator(self):
"""
Terminating estimator
"""
return self.steps[-1]](https://image.slidesharecdn.com/ddrlspring2017-visualizingmodelselectionwithscikit-yellowbrick-170324200737/75/Visualizing-Model-Selection-with-Scikit-Yellowbrick-An-Introduction-to-Developing-Visualizers-21-2048.jpg)


![Git/Branch Management
All work happens in develop.
Select a card from “ready”, move to “in-progress”.
Create a branch called “feature-[feature name]”, work & commit into that branch:
$ git checkout -b feature-myfeature develop
Once you are done working (and tested) merge into develop.:
$ git checkout develop
$ git merge --no-ff feature-myfeature
$ git branch -d feature-myfeature
$ git push origin develop
Repeat.
Once a milestone is completed, it is pushed to master and released.](https://image.slidesharecdn.com/ddrlspring2017-visualizingmodelselectionwithscikit-yellowbrick-170324200737/75/Visualizing-Model-Selection-with-Scikit-Yellowbrick-An-Introduction-to-Developing-Visualizers-56-2048.jpg)


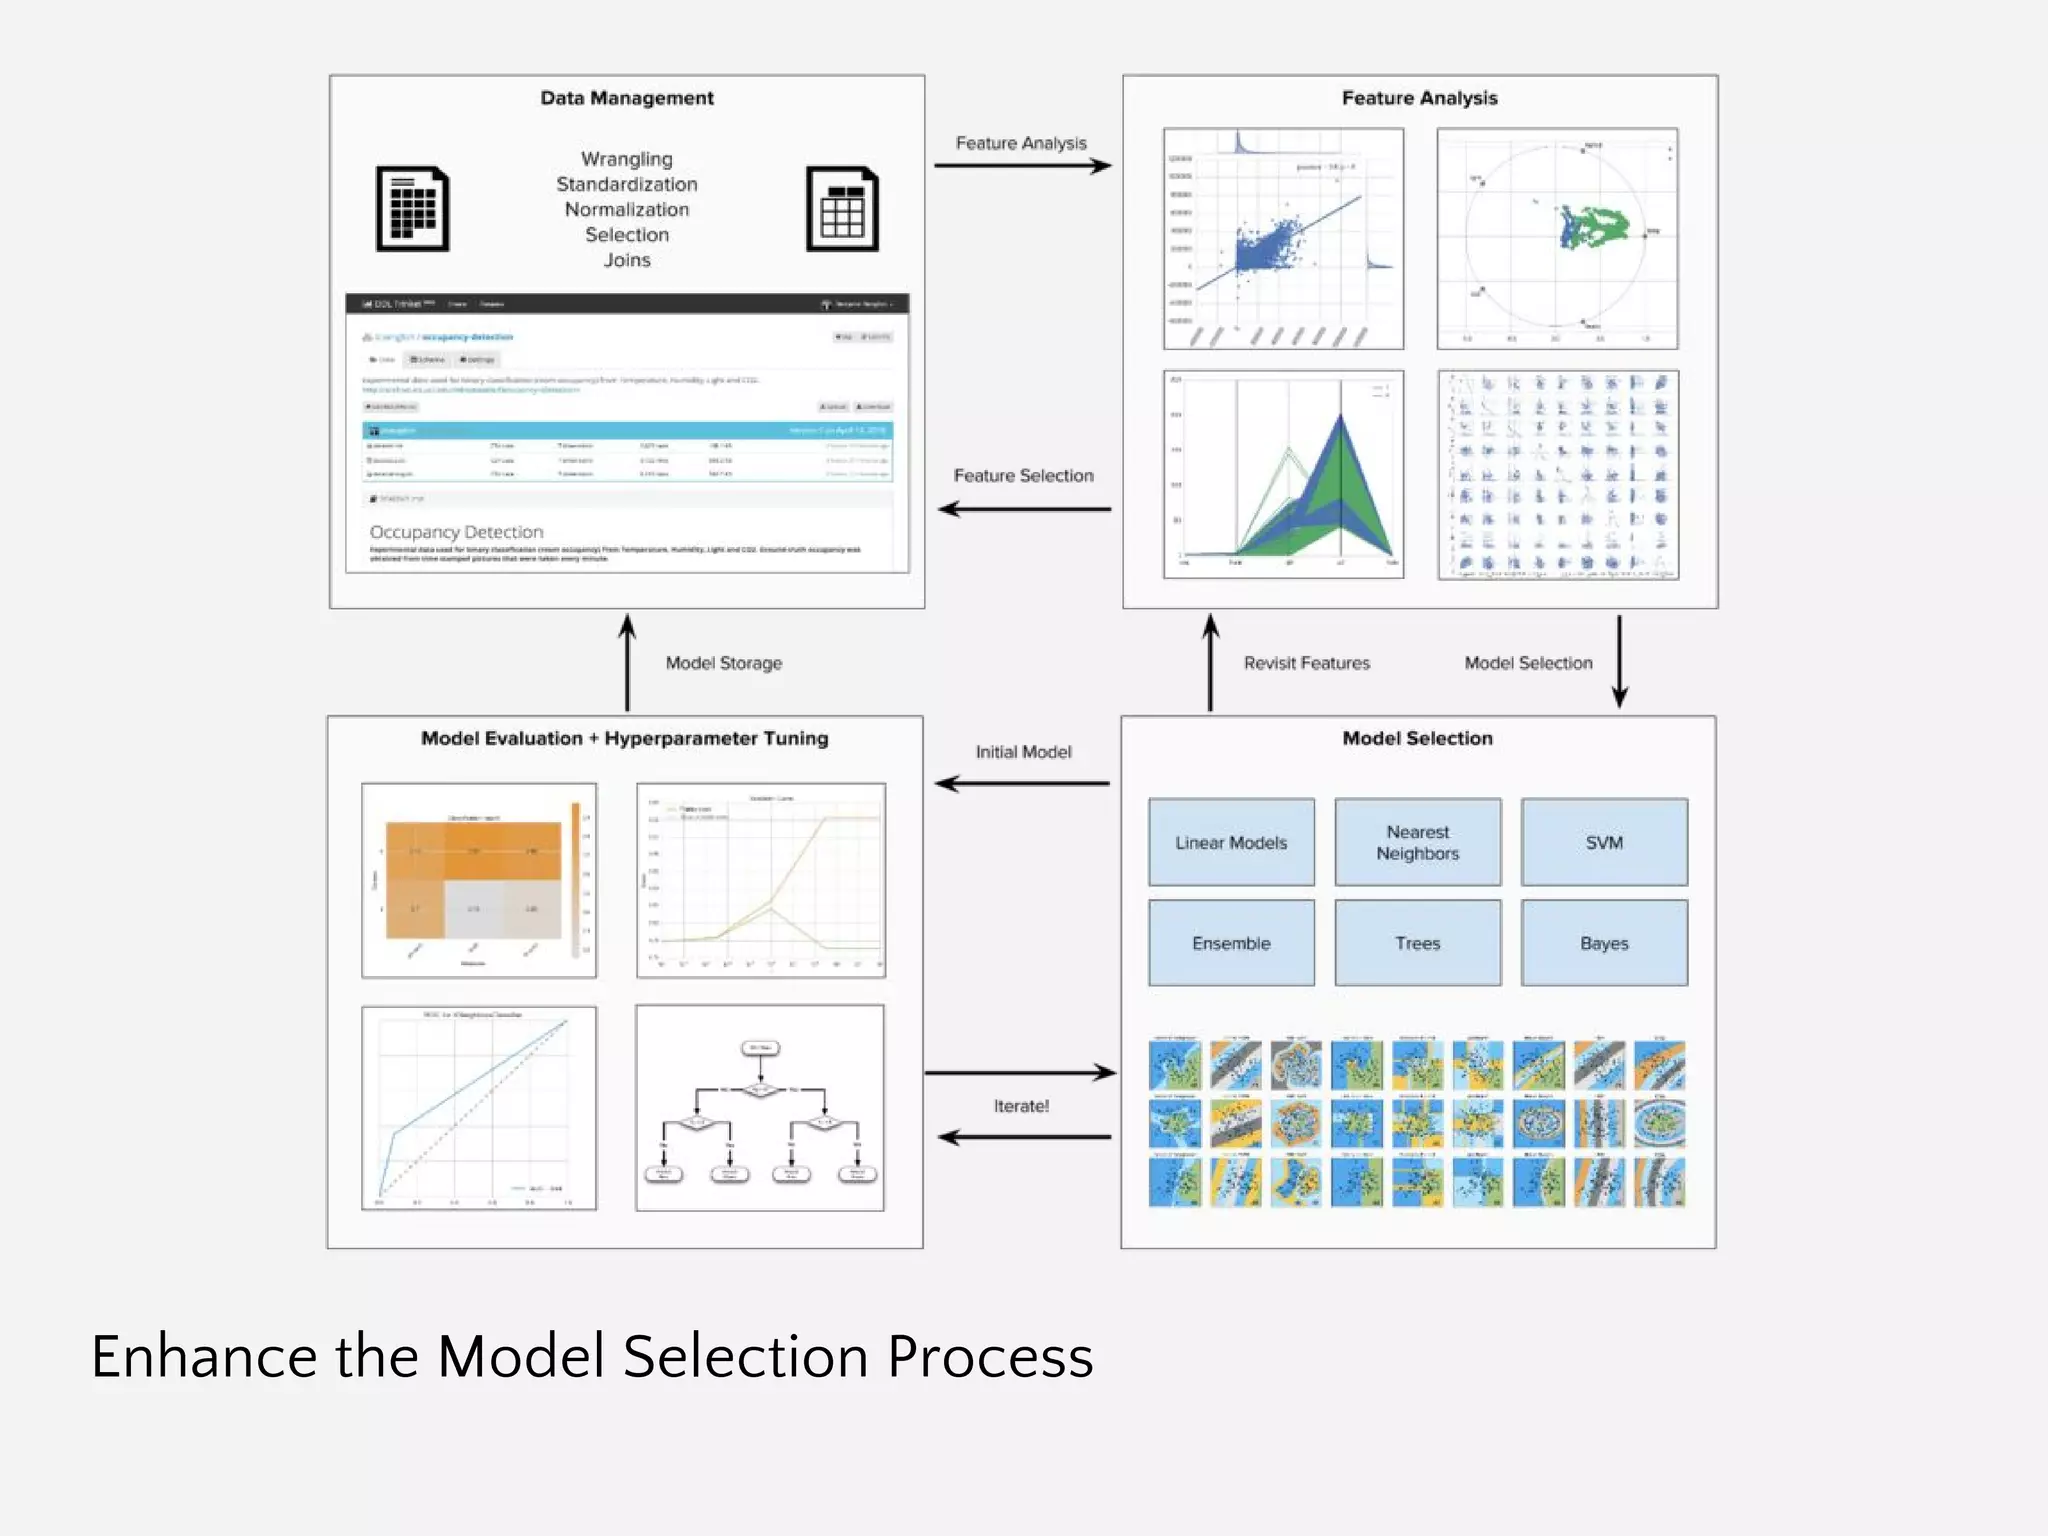
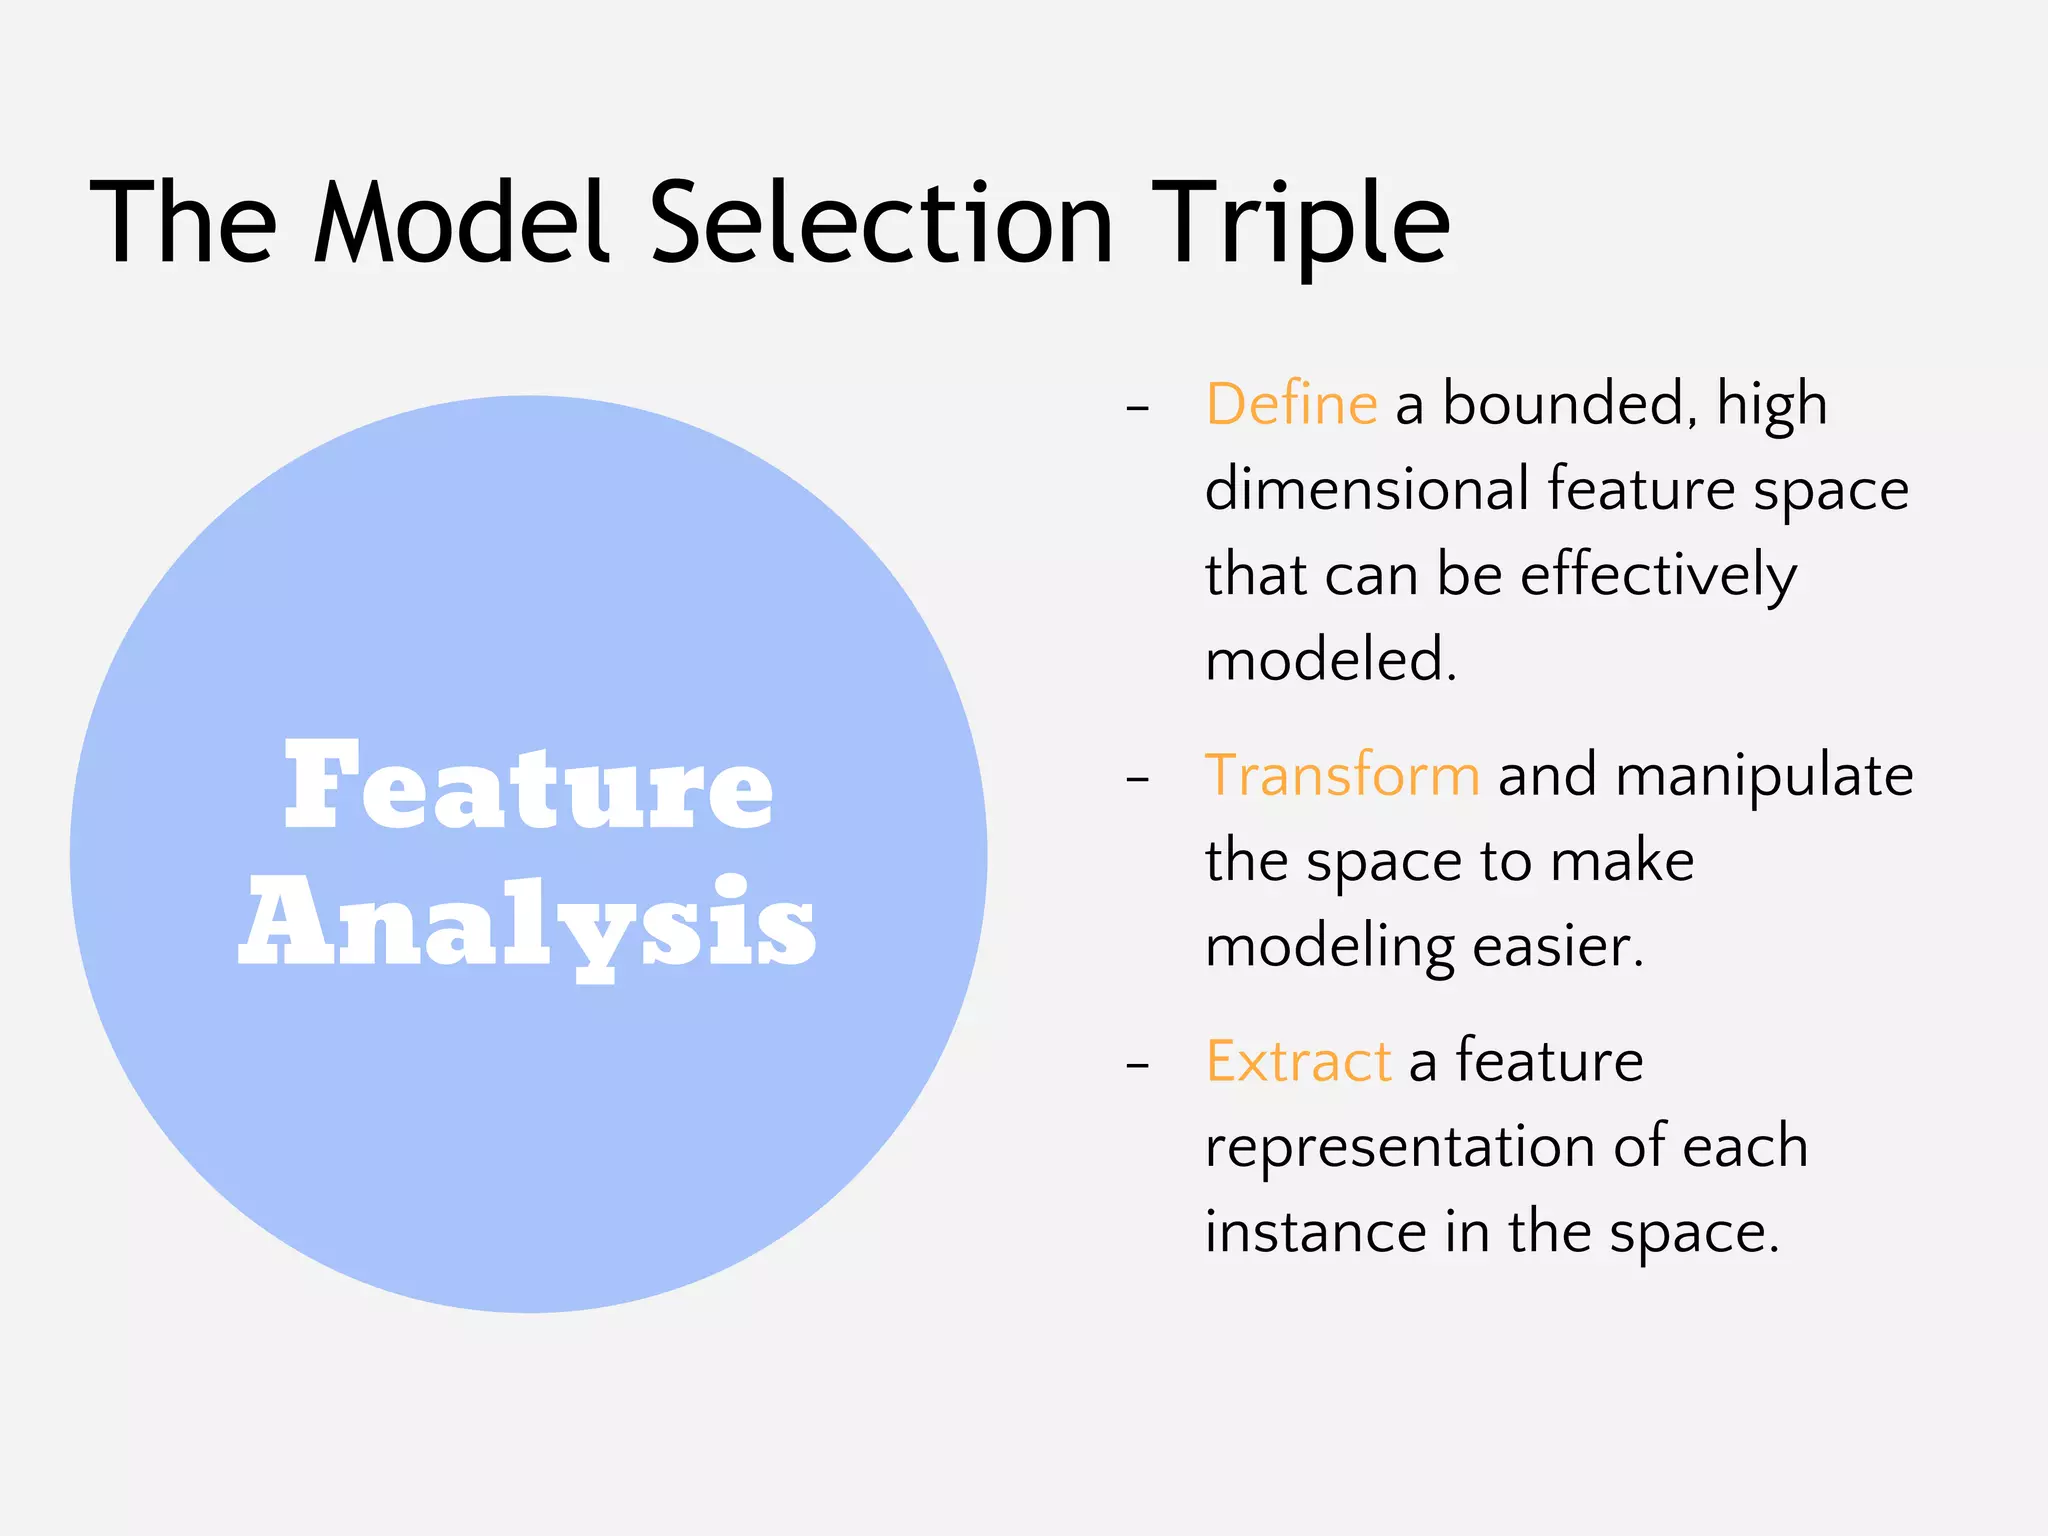
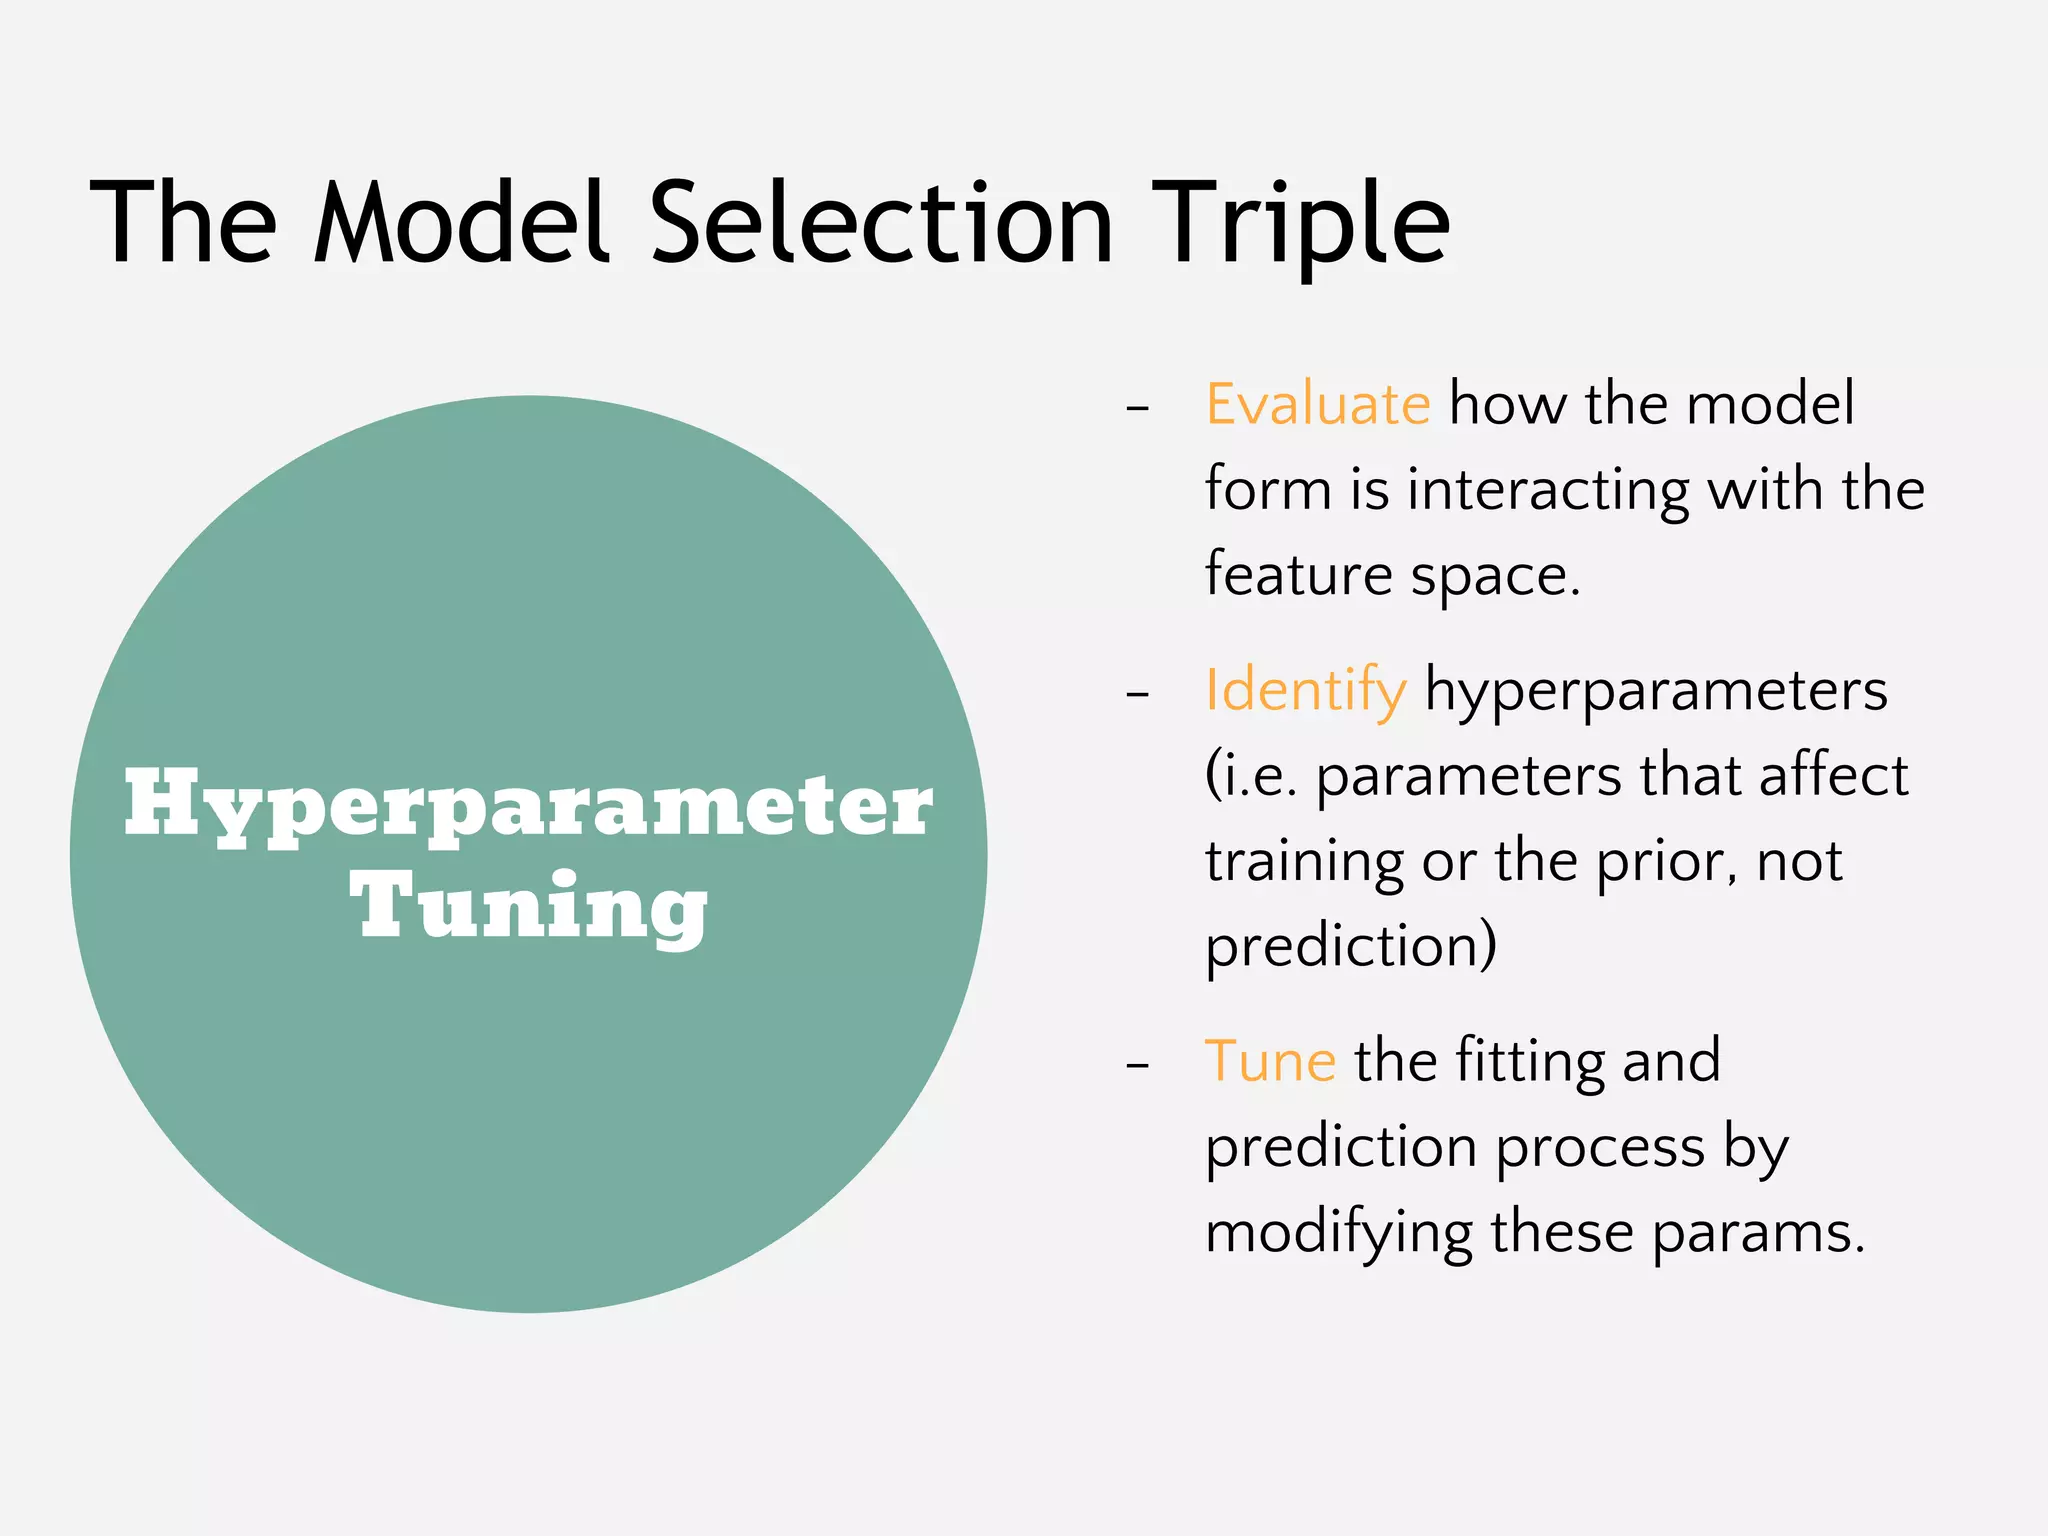
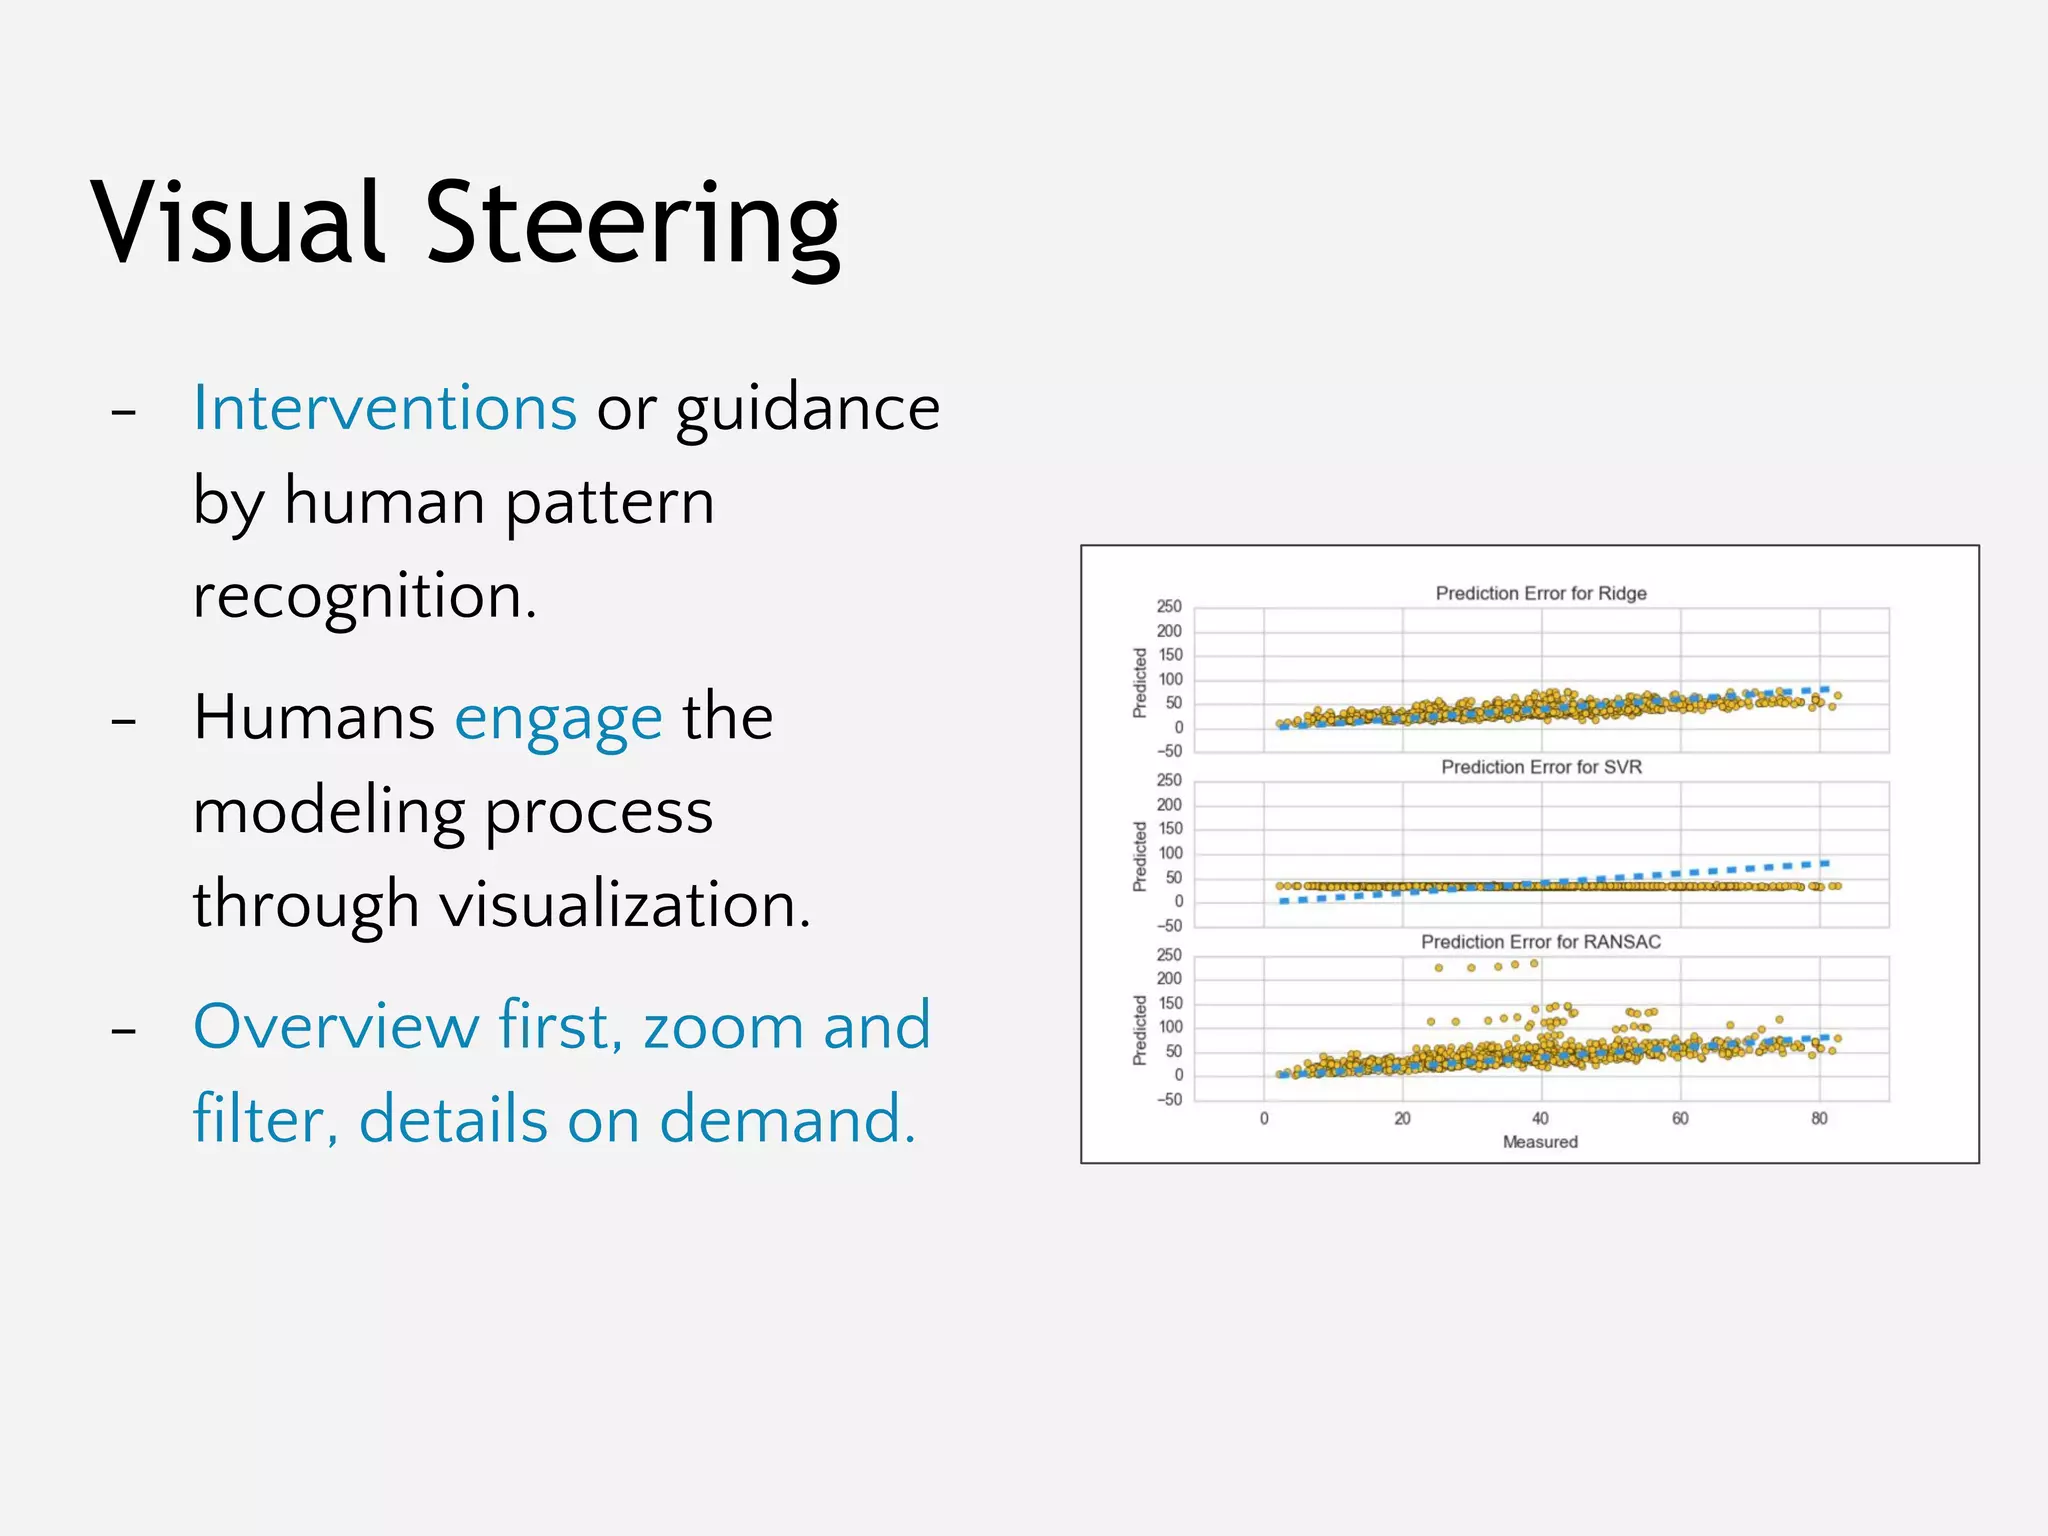
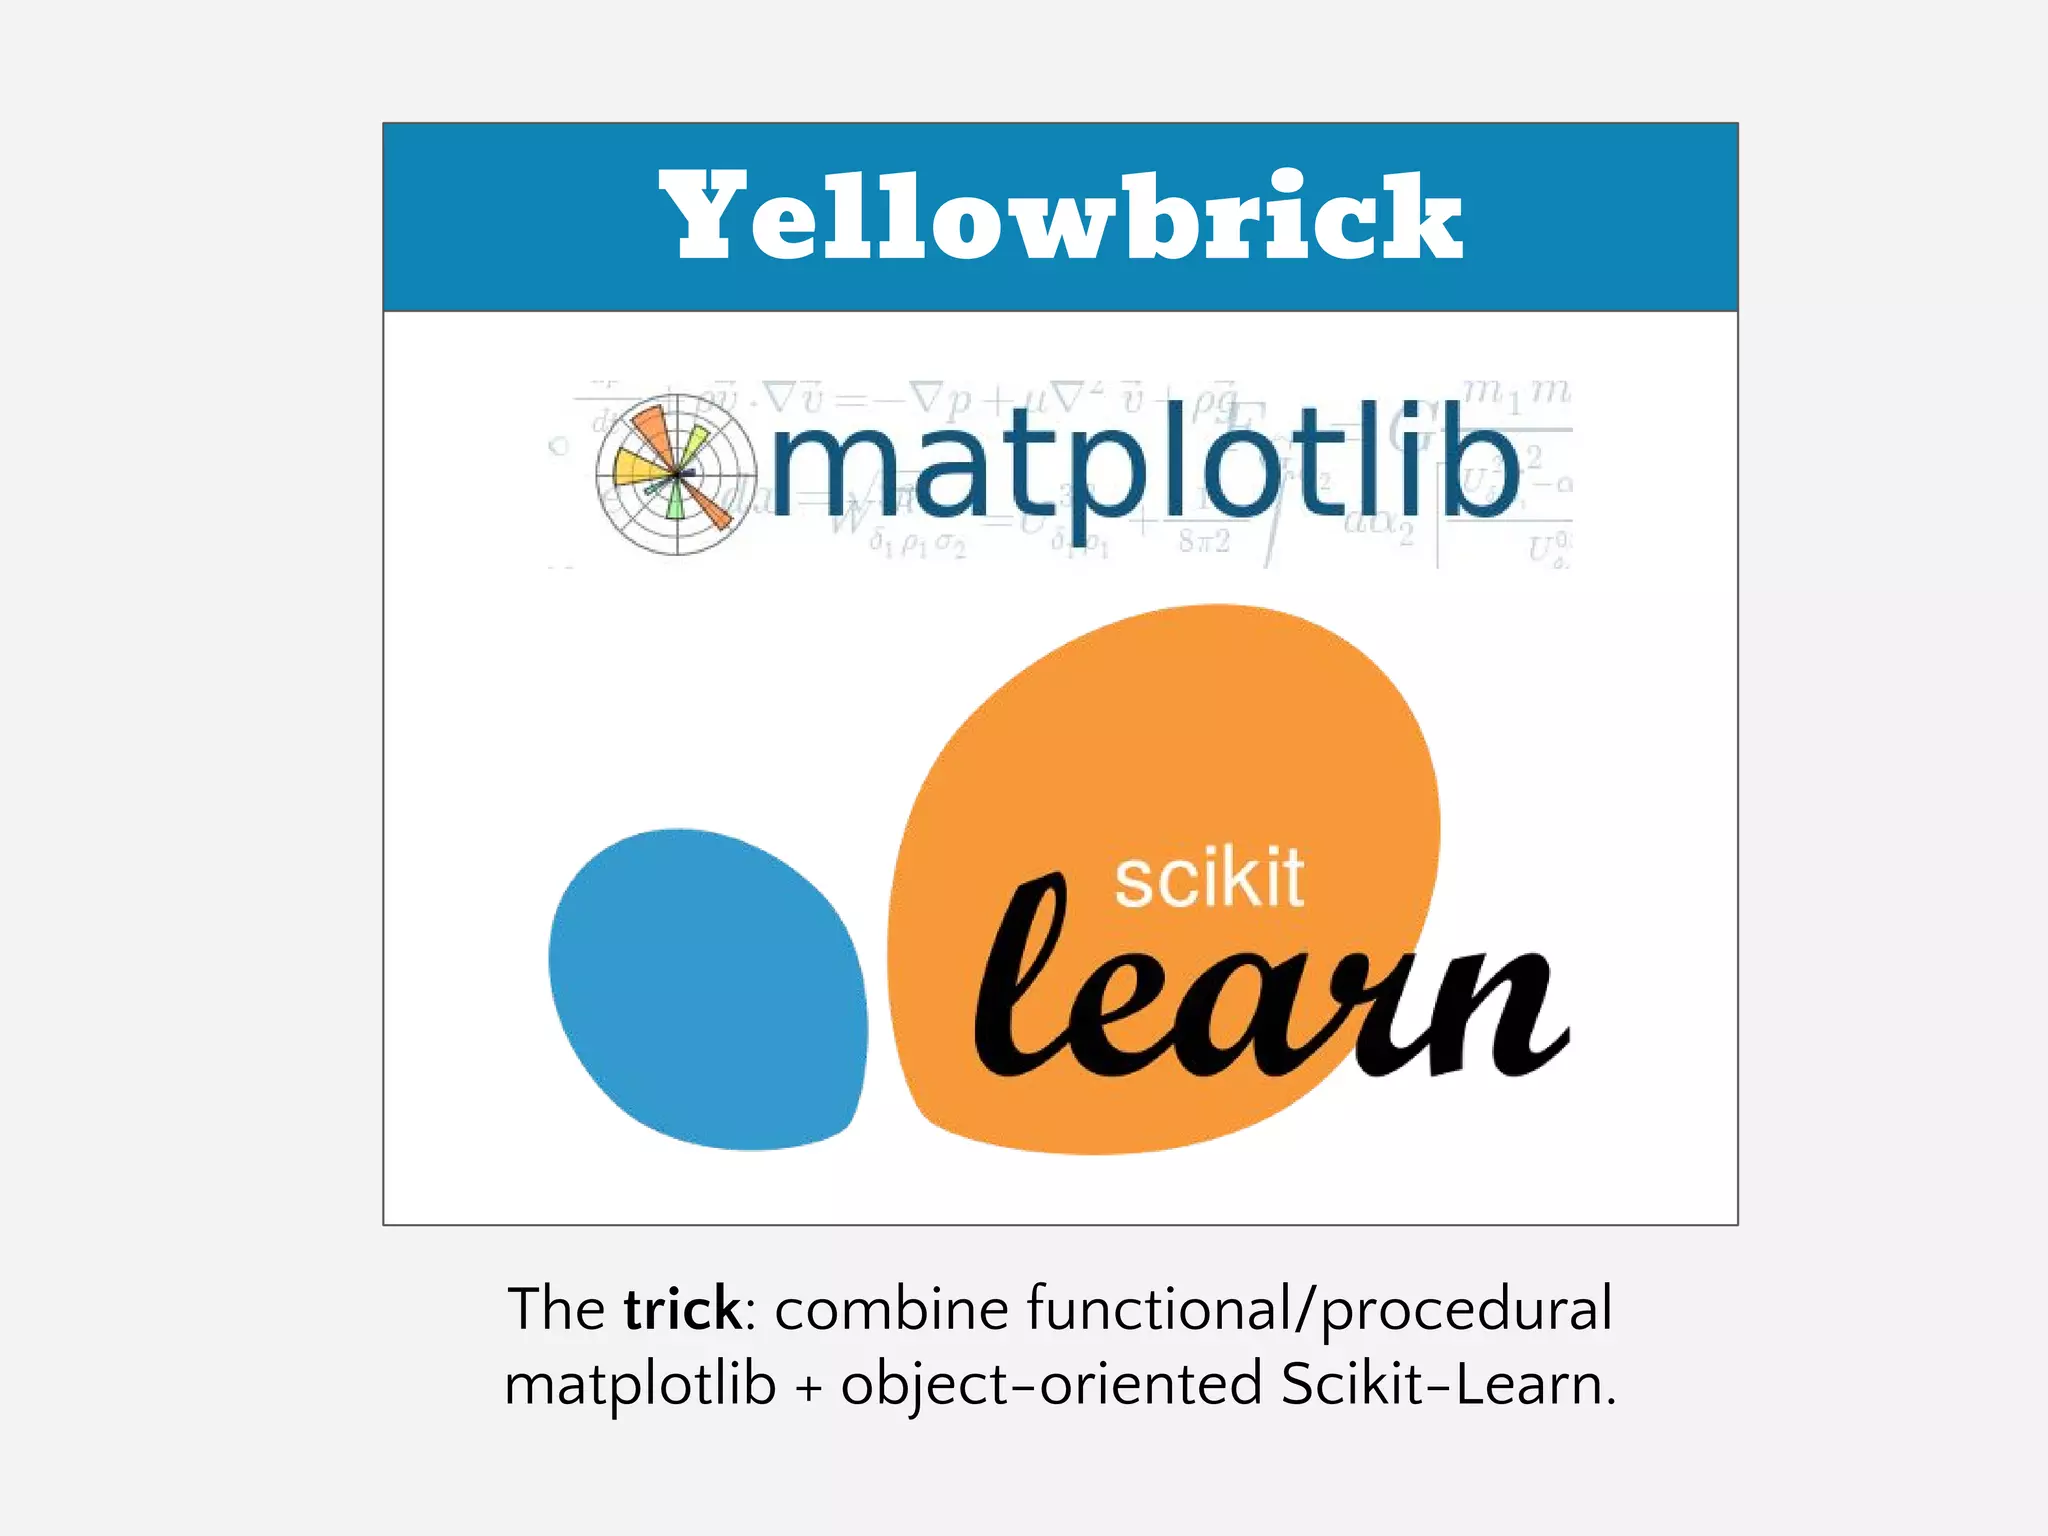
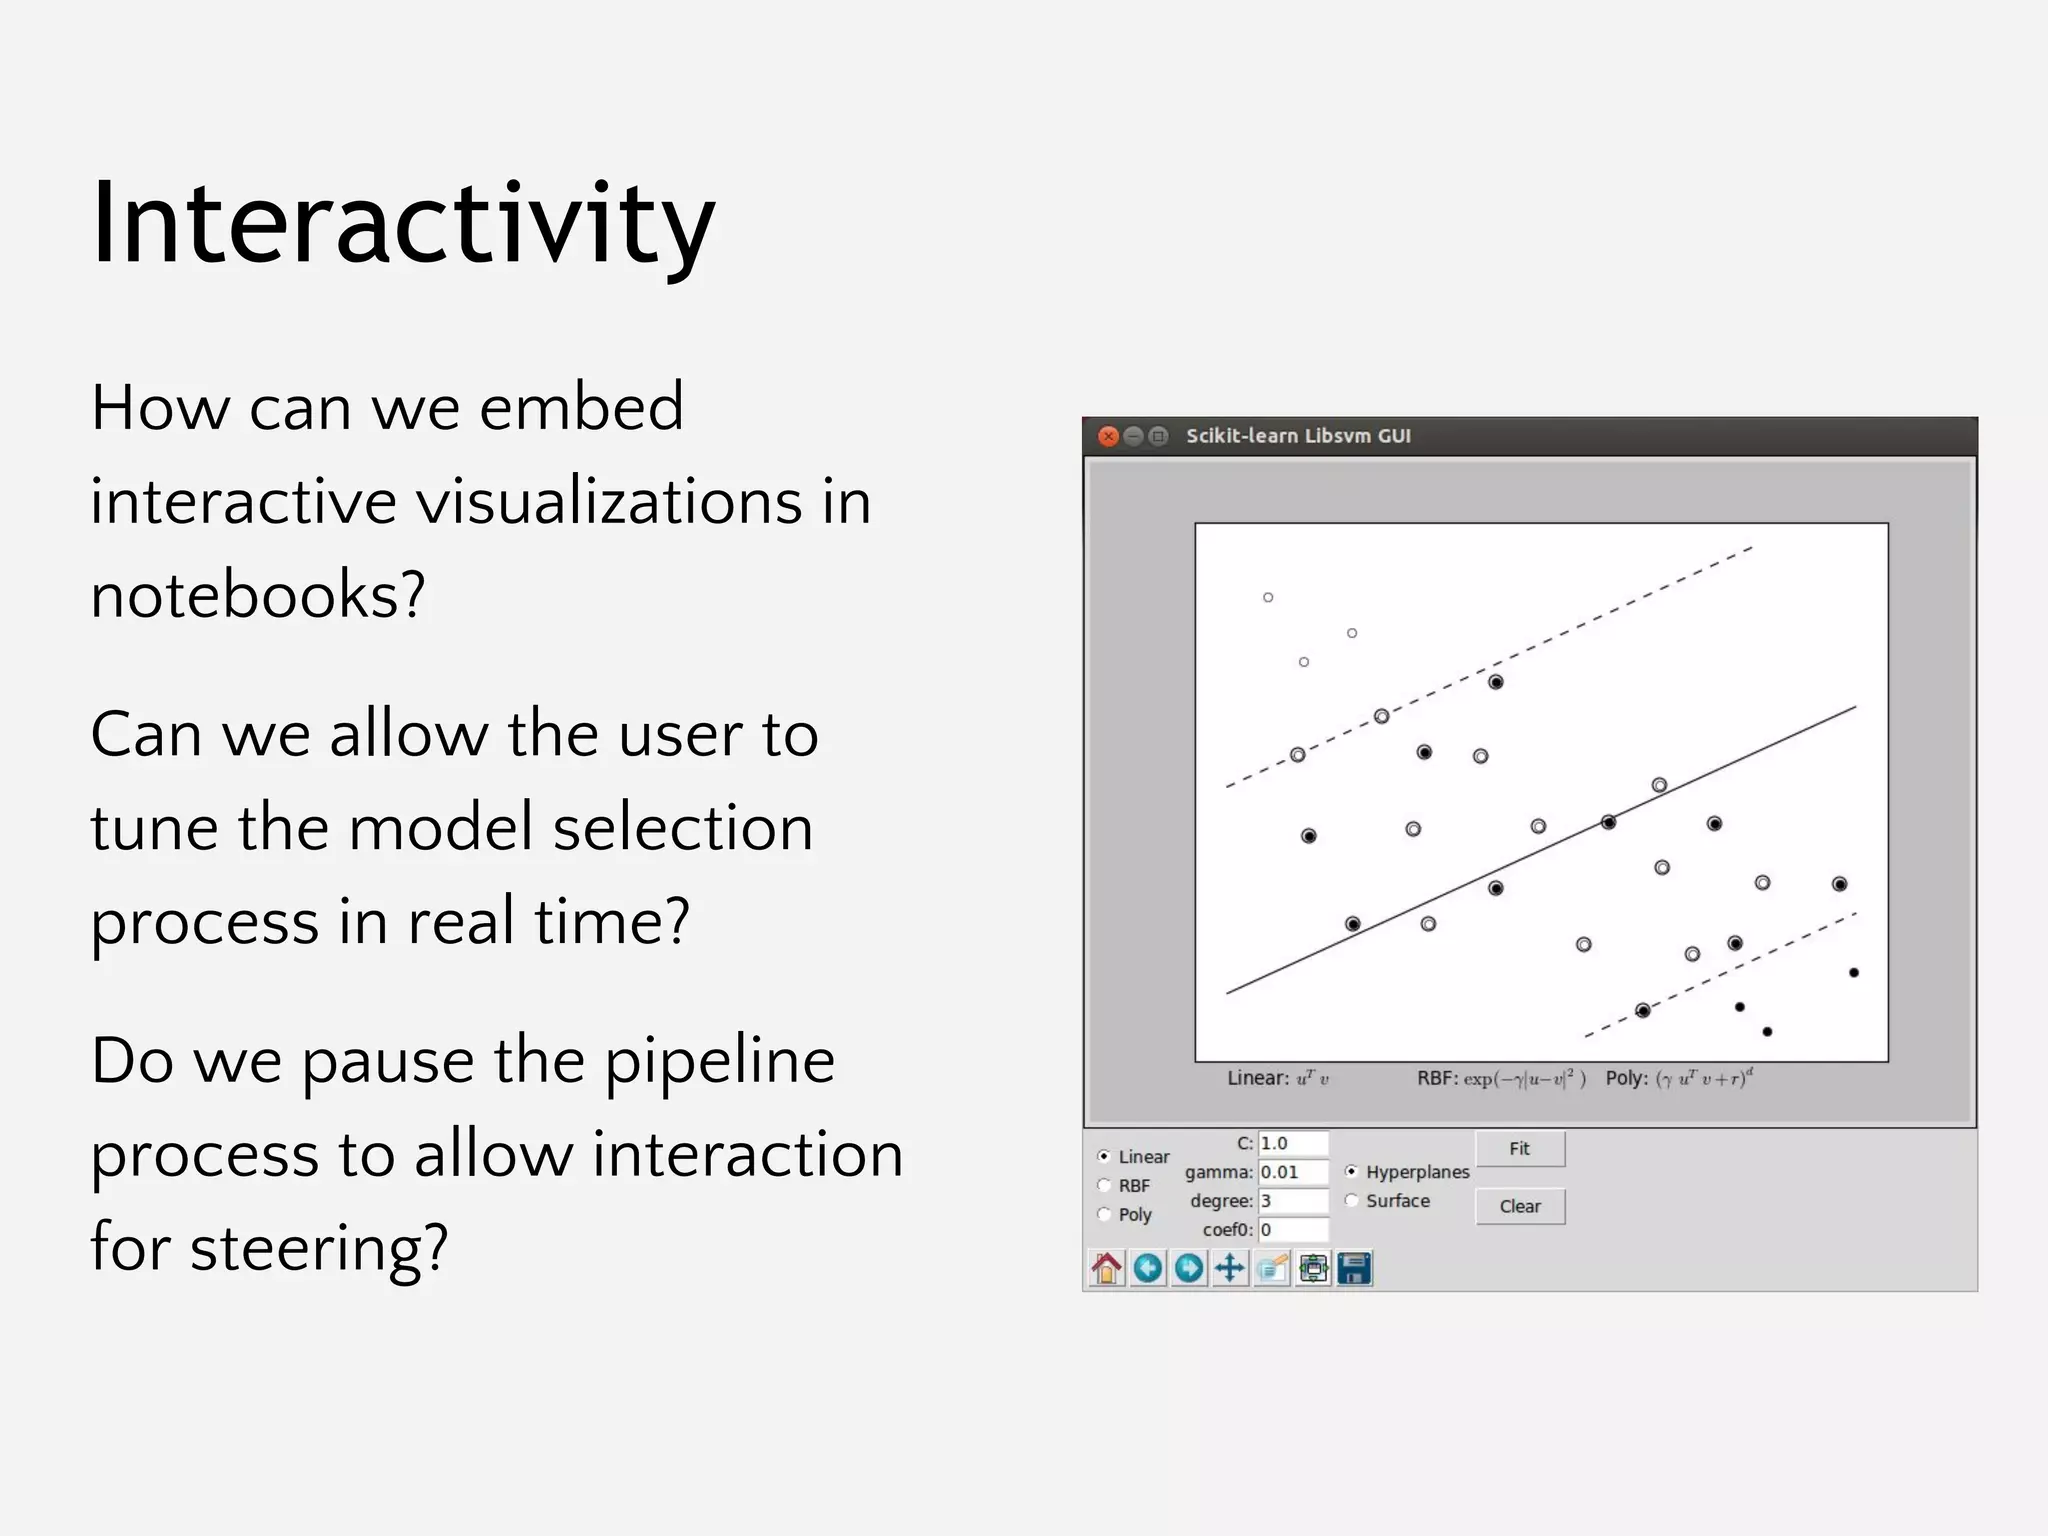
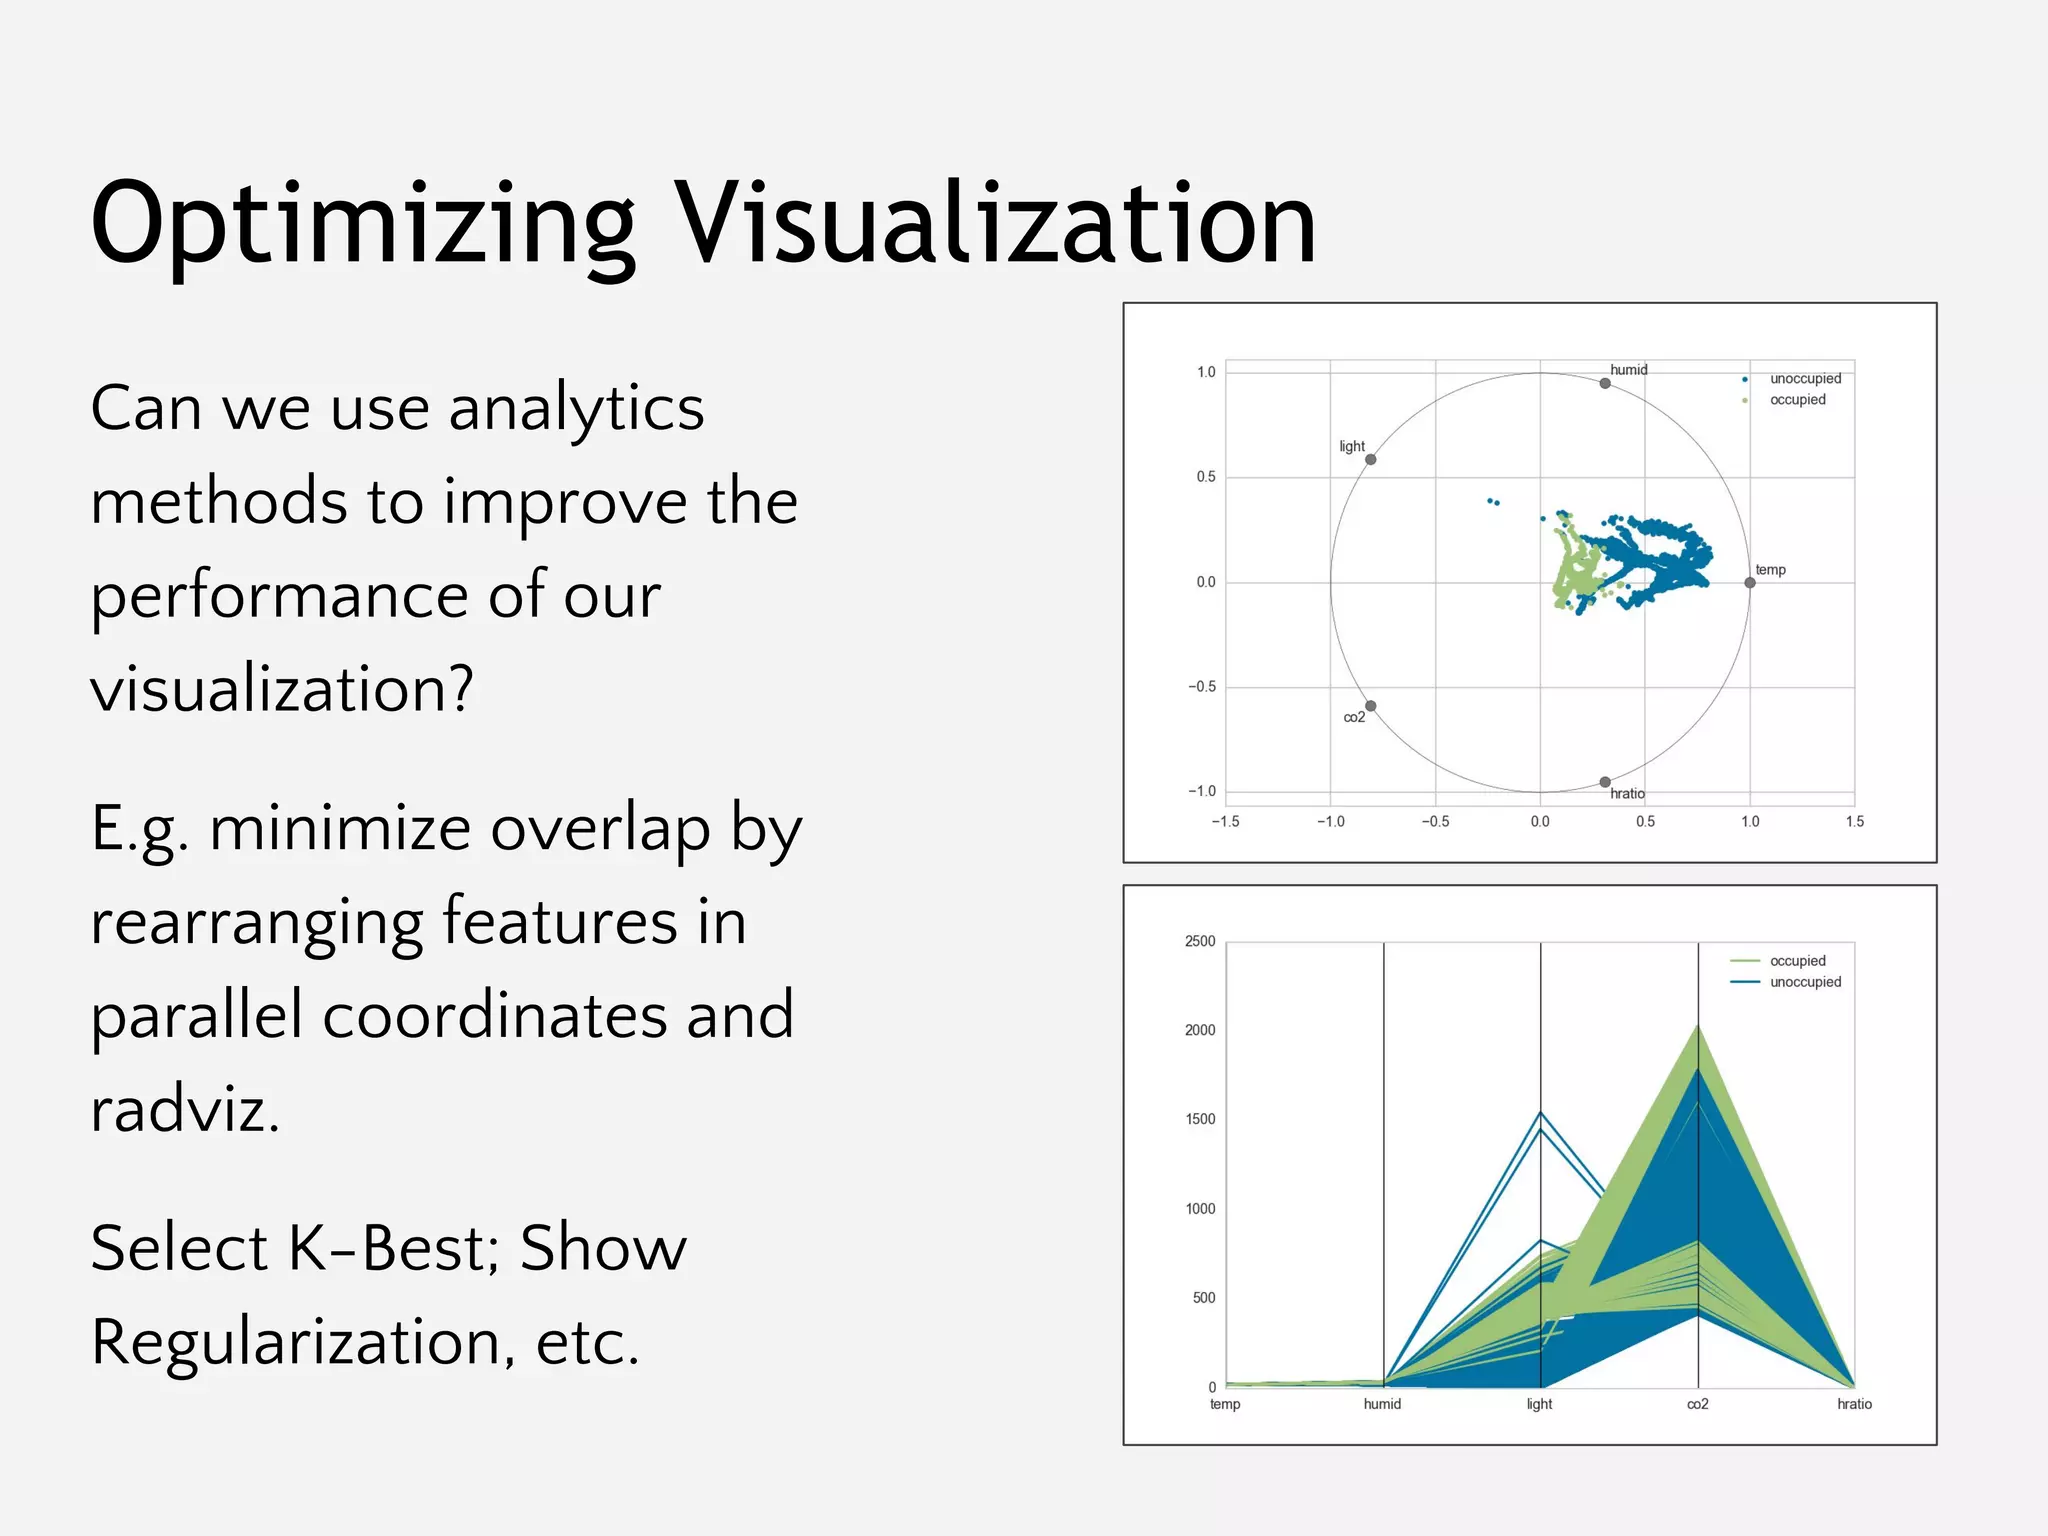
The document provides an overview of Yellowbrick, a machine learning visualization library designed to enhance model selection and visualization processes in Python. It discusses key components such as feature analysis, algorithm selection, hyperparameter tuning, and the use of visual steering for improved modeling outcomes. Additionally, it explains how Yellowbrick integrates with the scikit-learn API to create visualizers and pipelines that facilitate data analysis and model evaluation.