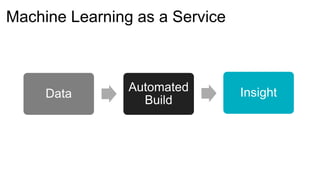
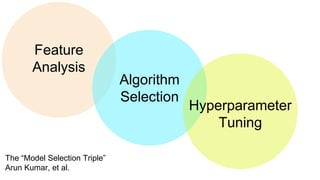
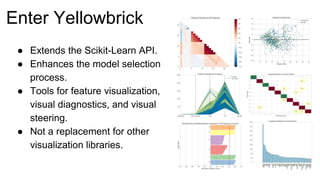
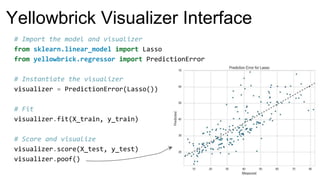
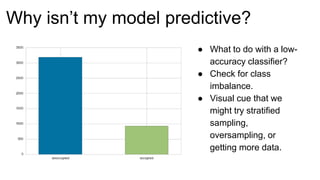
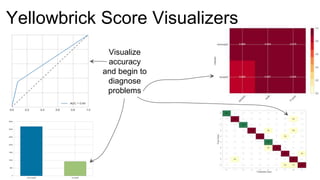
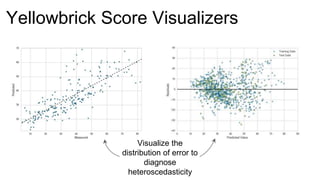
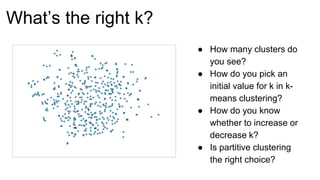
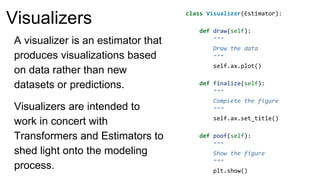
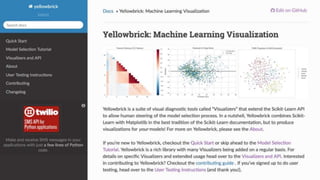
The document introduces Yellowbrick, a visual API designed to enhance the machine learning process by extending the Scikit-learn framework. It includes tools for feature visualization, model diagnostics, and hyperparameter tuning to improve the model selection process and address common issues like class imbalance and error distribution. Through visualizers, users can analyze model performance and feature importance, making it easier to create effective machine learning models.


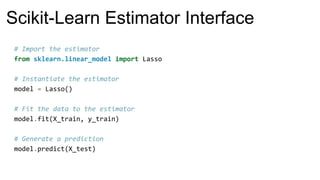
![from sklearn.svm import SVC
from sklearn.naive_bayes import GaussianNB
from sklearn.ensemble import AdaBoostClassifier
from sklearn.neighbors import KNeighborsClassifier
from sklearn.ensemble import RandomForestClassifier
from sklearn import model_selection as ms
classifiers = [
KNeighborsClassifier(5),
SVC(kernel="linear", C=0.025),
RandomForestClassifier(max_depth=5),
AdaBoostClassifier(),
GaussianNB(),
]
kfold = ms.KFold(len(X), n_folds=12)
max([
ms.cross_val_score(model, X, y, cv=kfold).mean
for model in classifiers
])
Try them all!](https://image.slidesharecdn.com/escapingtheblackbox-171202044545/85/Escaping-the-Black-Box-5-320.jpg)