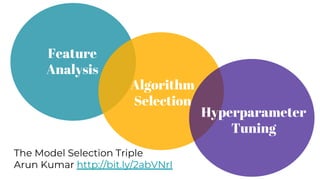
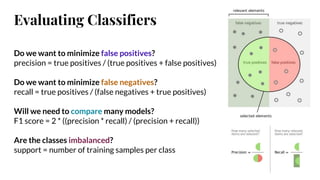
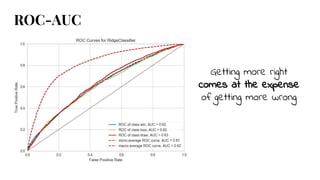
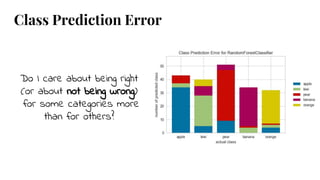
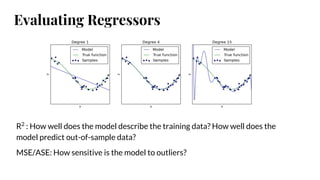
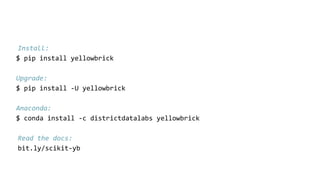
Steering Model
Selection with
Visual Diagnostics
Women in Analytics 2019
Dr. Rebecca Bilbro
Head of Data Science, ICX Media
Co-creator, Scikit-Yellowbrick
Author, Applied Text Analysis with Python
@rebeccabilbro
The machine learning problem:
Given a set of n data samples,
each represented by >1 number,
create a model that is able to predict
properties of as-yet unseen samples.
Ask me for my strong
opinions about Random
Forests.
The Model Selection Triple
Arun Kumar http://bit.ly/2abVNrI
Feature
Analysis
Algorithm
Selection
Hyperparameter
Tuning
Yellowbrick
Feature Analysis
a.k.a. finding the smallest possible set
of features that result in the most
predictive model.
1. Look for separability
Features pull instances towards
their position on the circle in
proportion to their normalized
numerical value for that
instance.
Radial Visualization
Parallel Coordinates
Features represented as
vertical lines.
Points represented as
connected line segments.
Look for single-colored chords.
2. Look for correlation
Feature Importance Plot
Visualize the relative
importance of each feature
to the model.
Identify weak features or
combinations of features
that are candidates for
removal.
Rank2D
Visualize pairwise relationships
as a heatmap.
Pearson shows us strong
correlations, potential
collinearity. Covariance helps us
understand the sequence of
relationships.
3. Look at the distribution
PCA Projection Plots
Decompose high dimensional
data into two or three
dimensions.
Visualize projected data along
axes of principle variation.
Manifolds
Embed instances into
two dimensions
Look for latent (esp.
non-linear) structures in
the data, noise,
separability.
Visualize document
distribution, top tokens &
part-of-speech tags
Also for text!
Model Selection
Evaluation
1. Decide what matters
Evaluating Classifiers
Do we want to minimize false positives?
precision = true positives / (true positives + false positives)
Do we want to minimize false negatives?
recall = true positives / (false negatives + true positives)
Will we need to compare many models?
F1 score = 2 * ((precision * recall) / (precision + recall))
Are the classes imbalanced?
support = number of training samples per class
Getting more right
comes at the expense
of getting more wrong
ROC-AUC
Class Prediction Error
Do I care about being right
(or about not being wrong)
for some categories more
than for others?
Evaluating Regressors
R2
: How well does the model describe the training data? How well does the
model predict out-of-sample data?
MSE/ASE: How sensitive is the model to outliers?
Prediction Error Plots
Visualize prediction errors as a
scatterplot of the predicted &
actual values.
Visualize the line of best fit &
compare t0 the 45º line.
Plotting Residuals
Are residuals random?
We should not be able to
predict error!
Visualize train and test
data with different
colors.
2. Try them all
3. Think horses
What to do with a
low-accuracy classifier?
Check for class imbalance.
Try stratified sampling,
oversampling, or need
more data?
Class Balance
Cross Validation Scores
Real world data are
distributed unevenly
Models are likely to
perform better on
some sections of data
than others.
Hyperparameter
Tuning
1. Use the defaults
Hyperparameters
● When we call fit() on an estimator, it learns the parameters of the algorithm
that make it fit the data best.
● However, some parameters are not directly learned within an estimator.
E.g.
○ depth of a decision tree
○ alpha for regularization
○ kernel for support vector machines
○ number of clusters for centroidal clustering
● These parameters are often referred to as hyperparameters.
2. Gridsearch
Hyperparameter space is large and
gridsearch is slow if you don’t already
know what you’re looking for.
3. Visual gridsearch
higher silhouette scores
mean denser, more
separate clusters
The elbow
shows the
best value
of k…
Or suggests
a different
algorithm
K-selection with Yellowbrick
Should I use Lasso,
Ridge, or ElasticNet? Is
regularlization even
working?
More alpha => less
complexity
Reduced bias, but
increased variance
Alpha selection with Yellowbrick
Using Yellowbrick
Install:
$ pip install yellowbrick
Upgrade:
$ pip install -U yellowbrick
Anaconda:
$ conda install -c districtdatalabs yellowbrick
Read the docs:
bit.ly/scikit-yb
Contributing
Yellowbrick is an open source project supported by a
community who will gratefully and humbly accept any
contributions you might make to the project.
We want to be the best first place to contribute.
Please star Yellowbrick on GitHub!
bit.ly/yb-repo
@rebeccabilbro

Steering Model Selection with Visual Diagnostics: Women in Analytics 2019