Download as ODP, PPTX

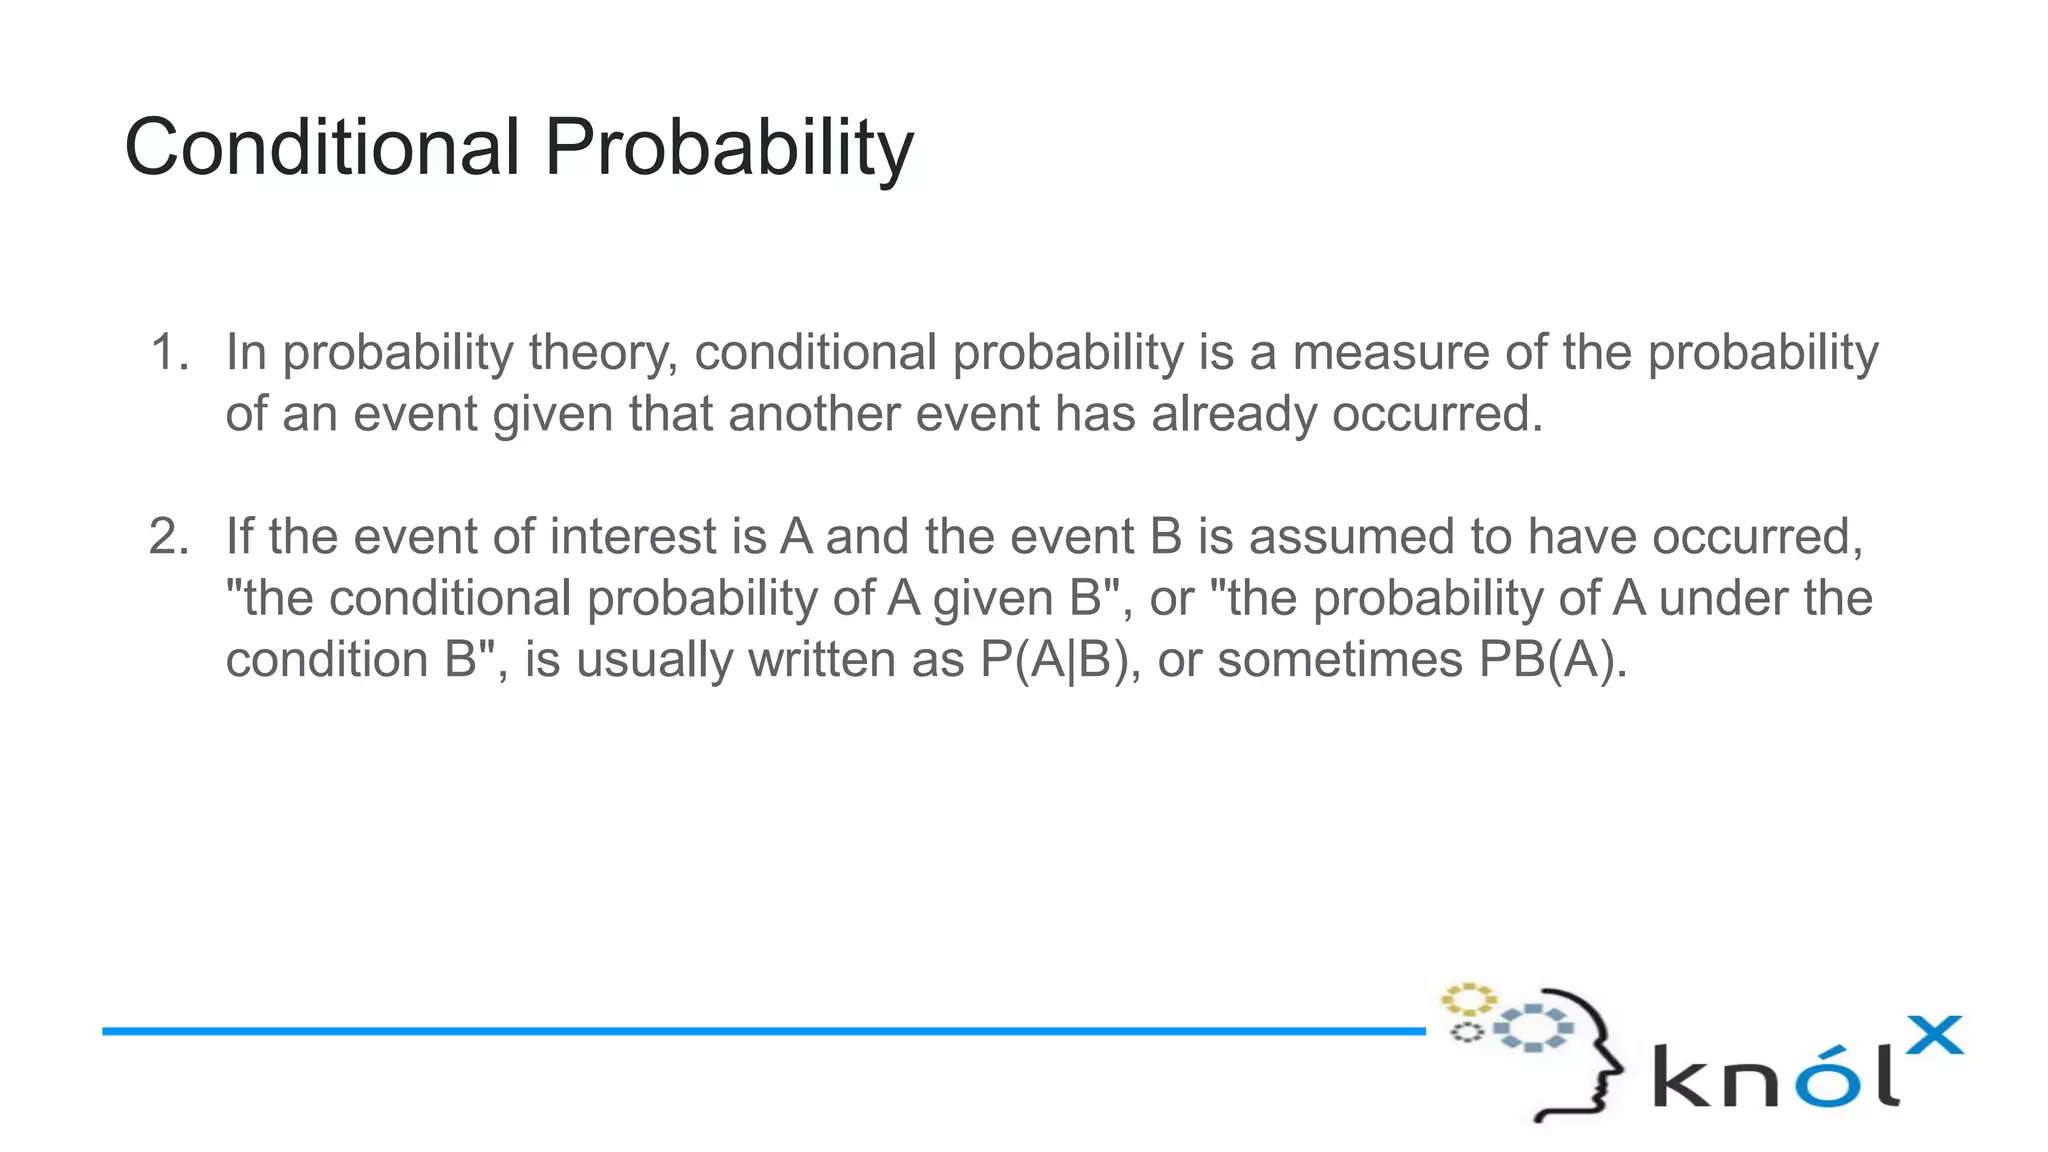


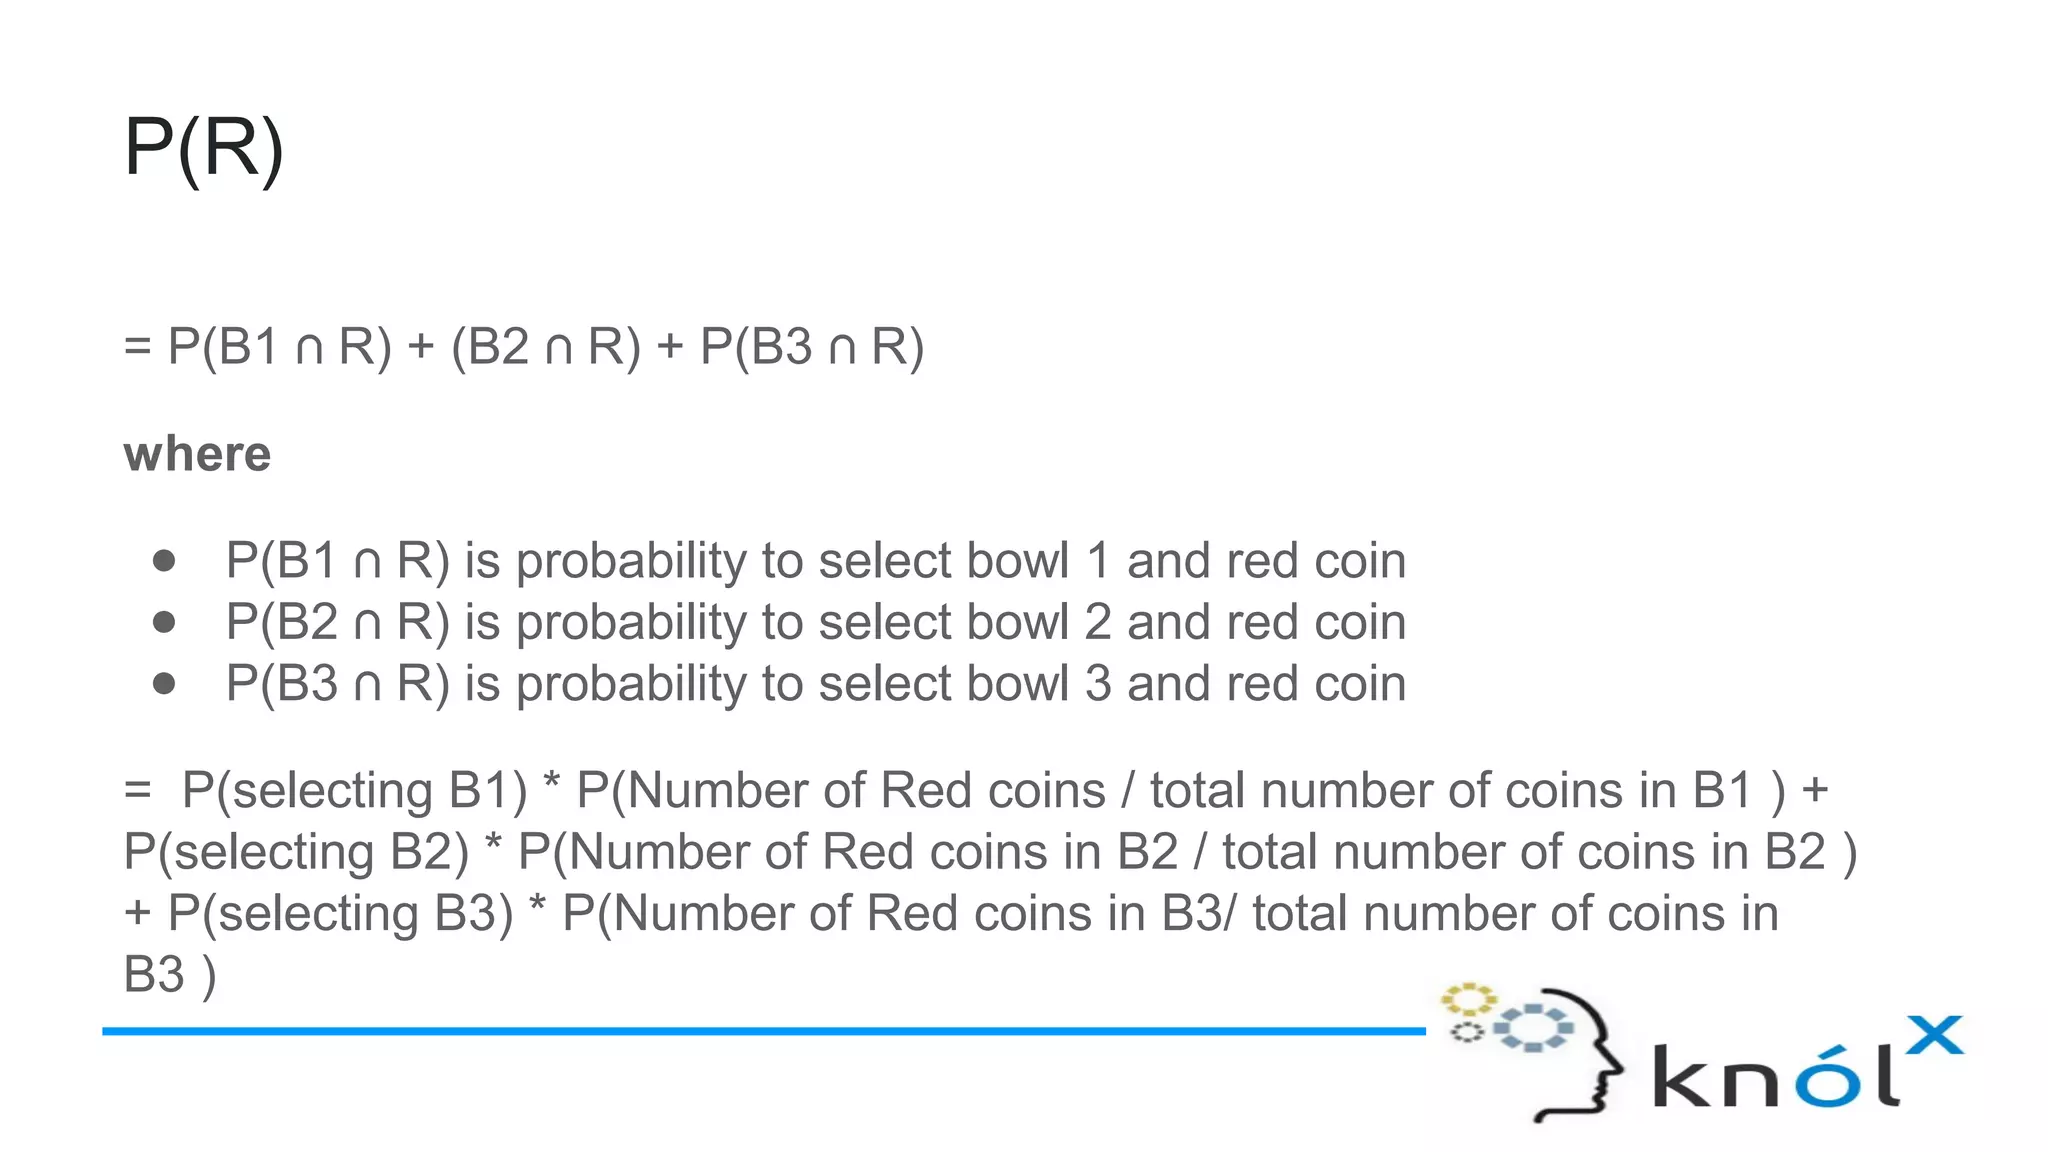

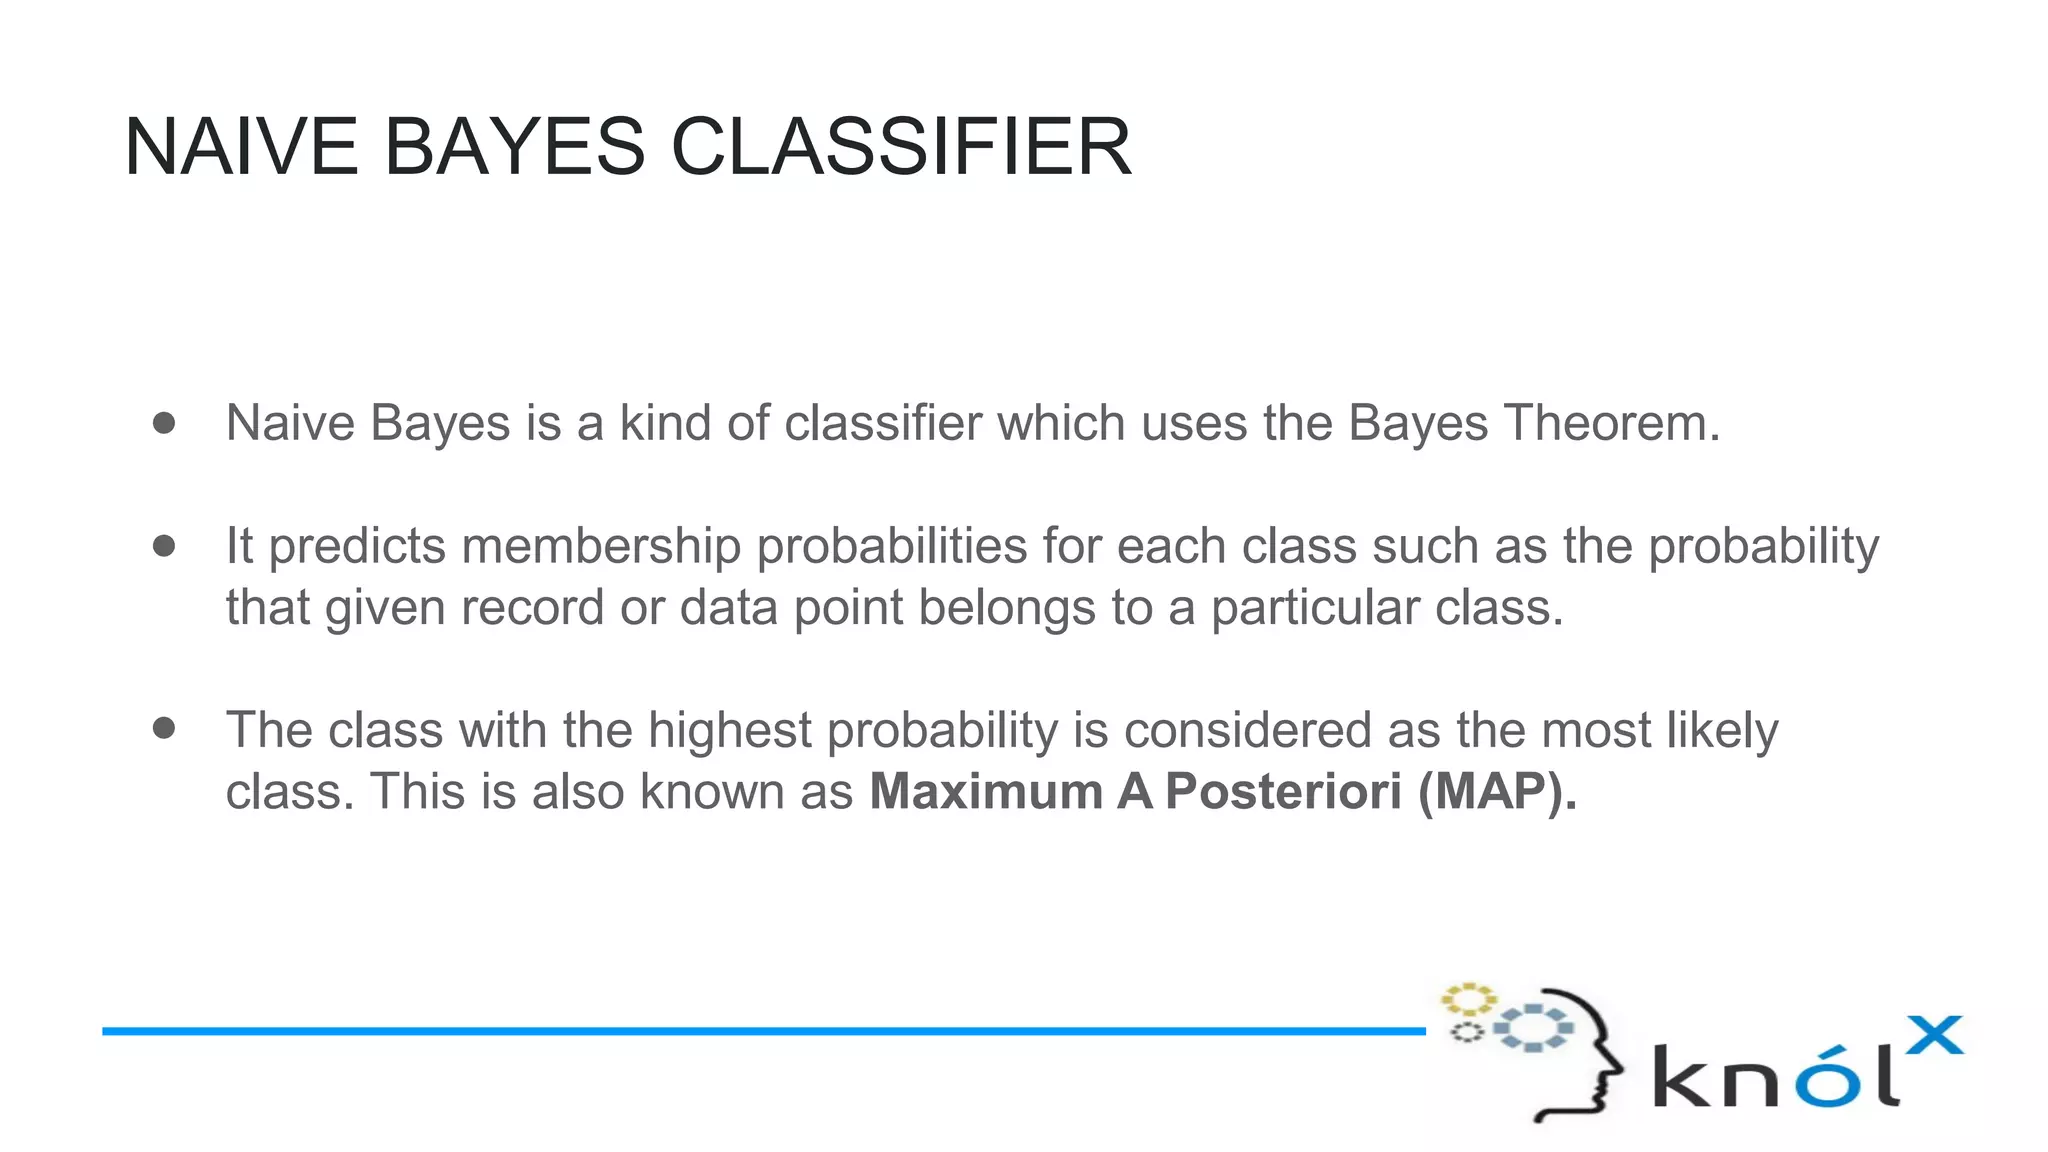

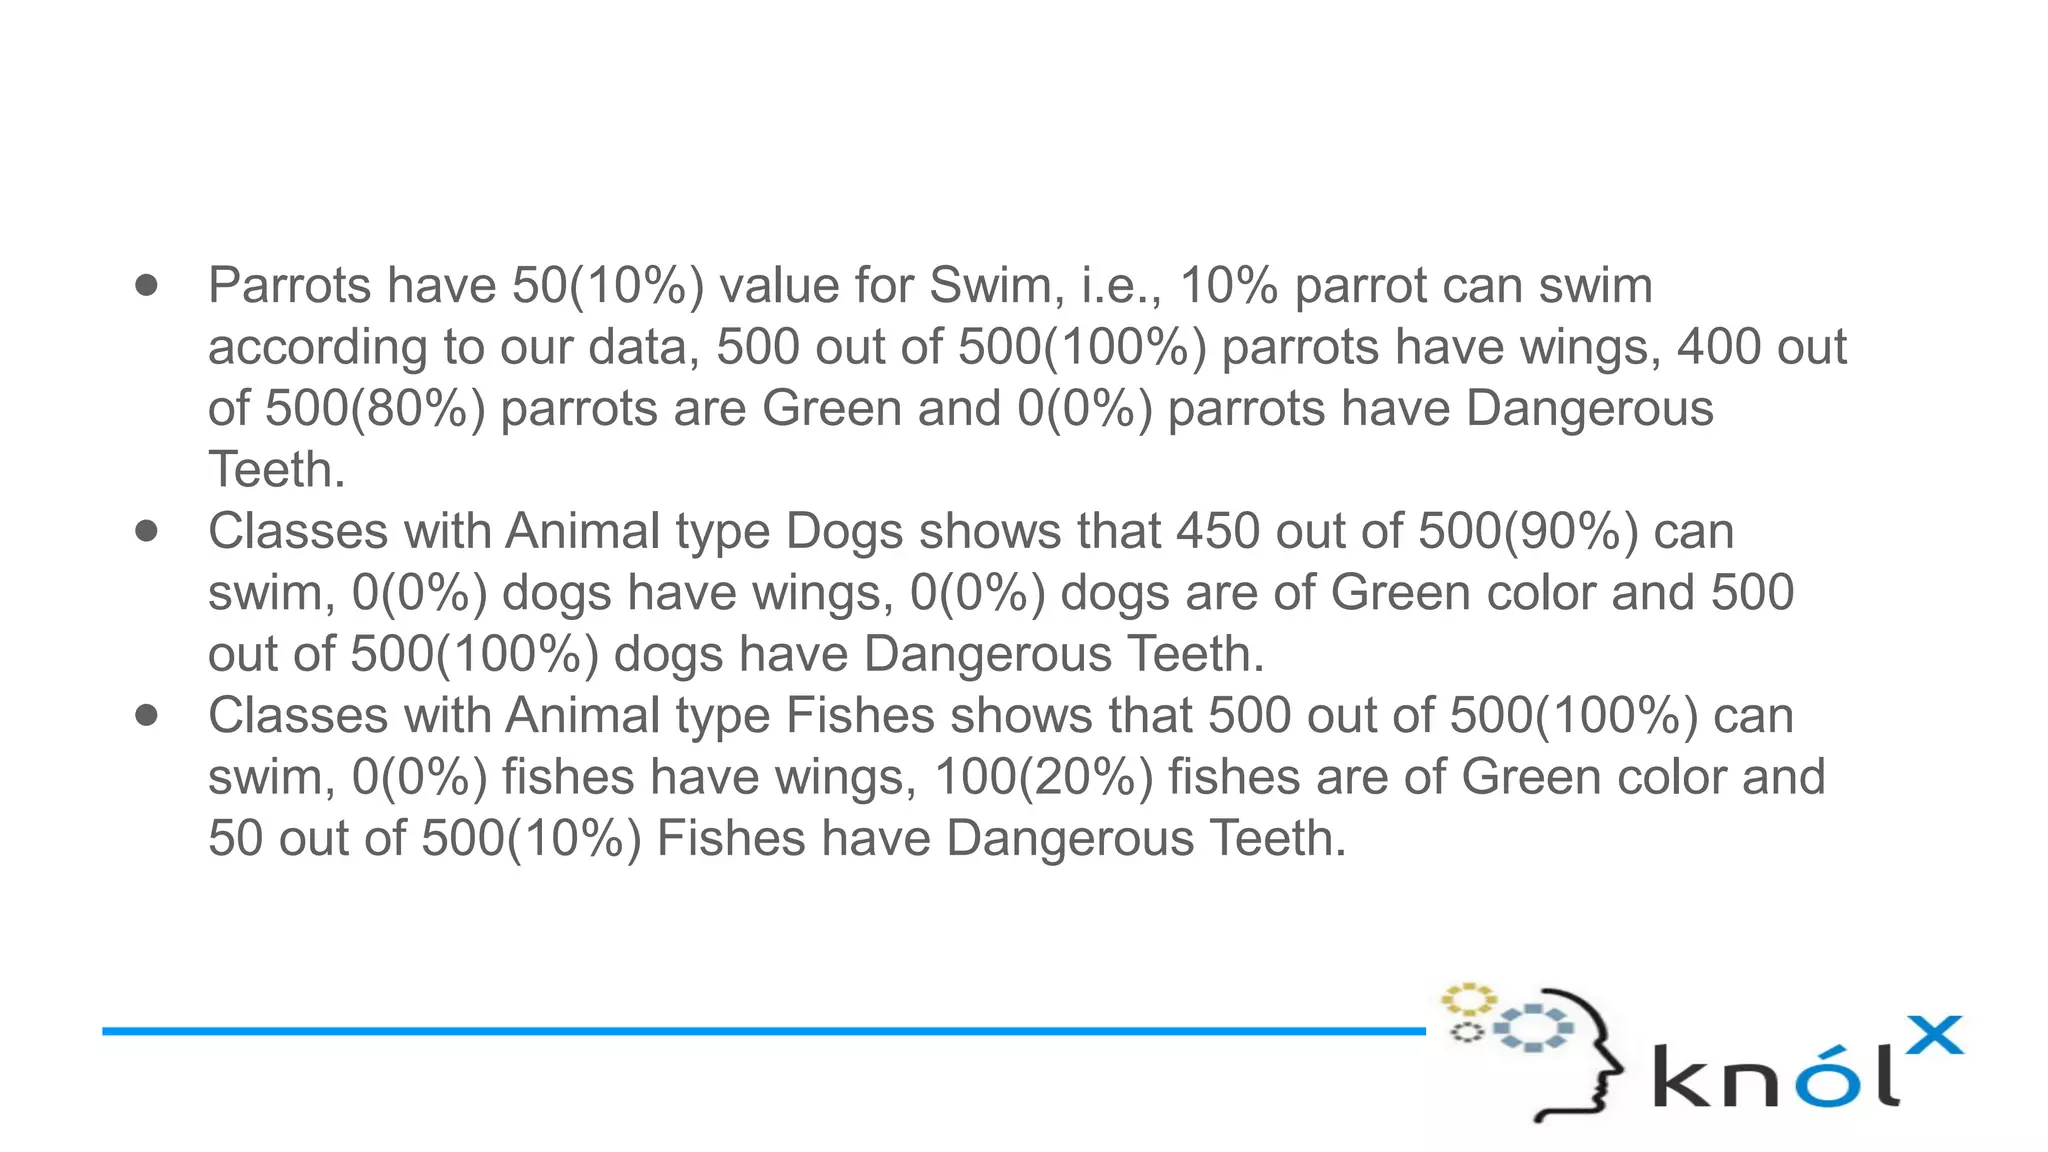
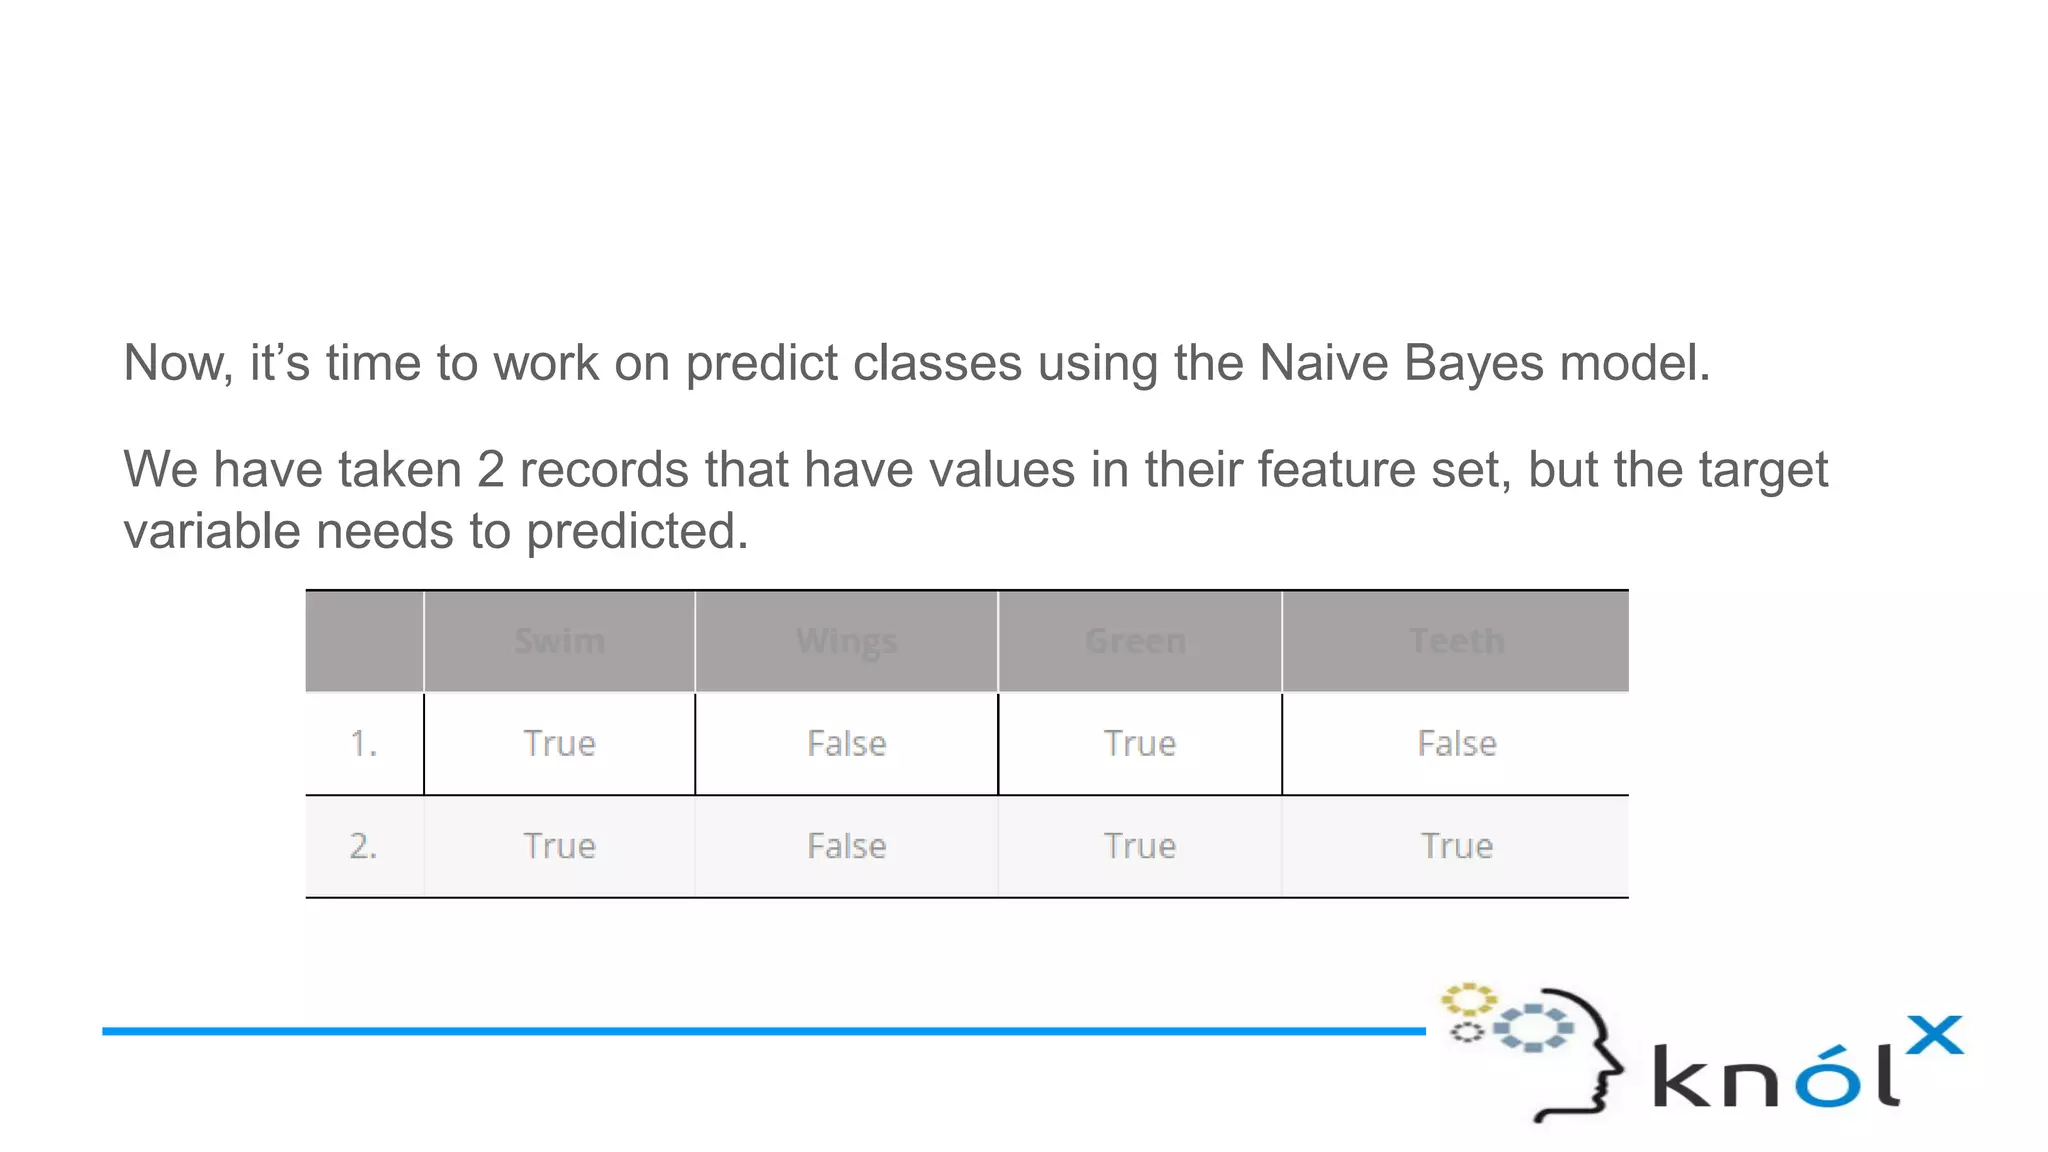
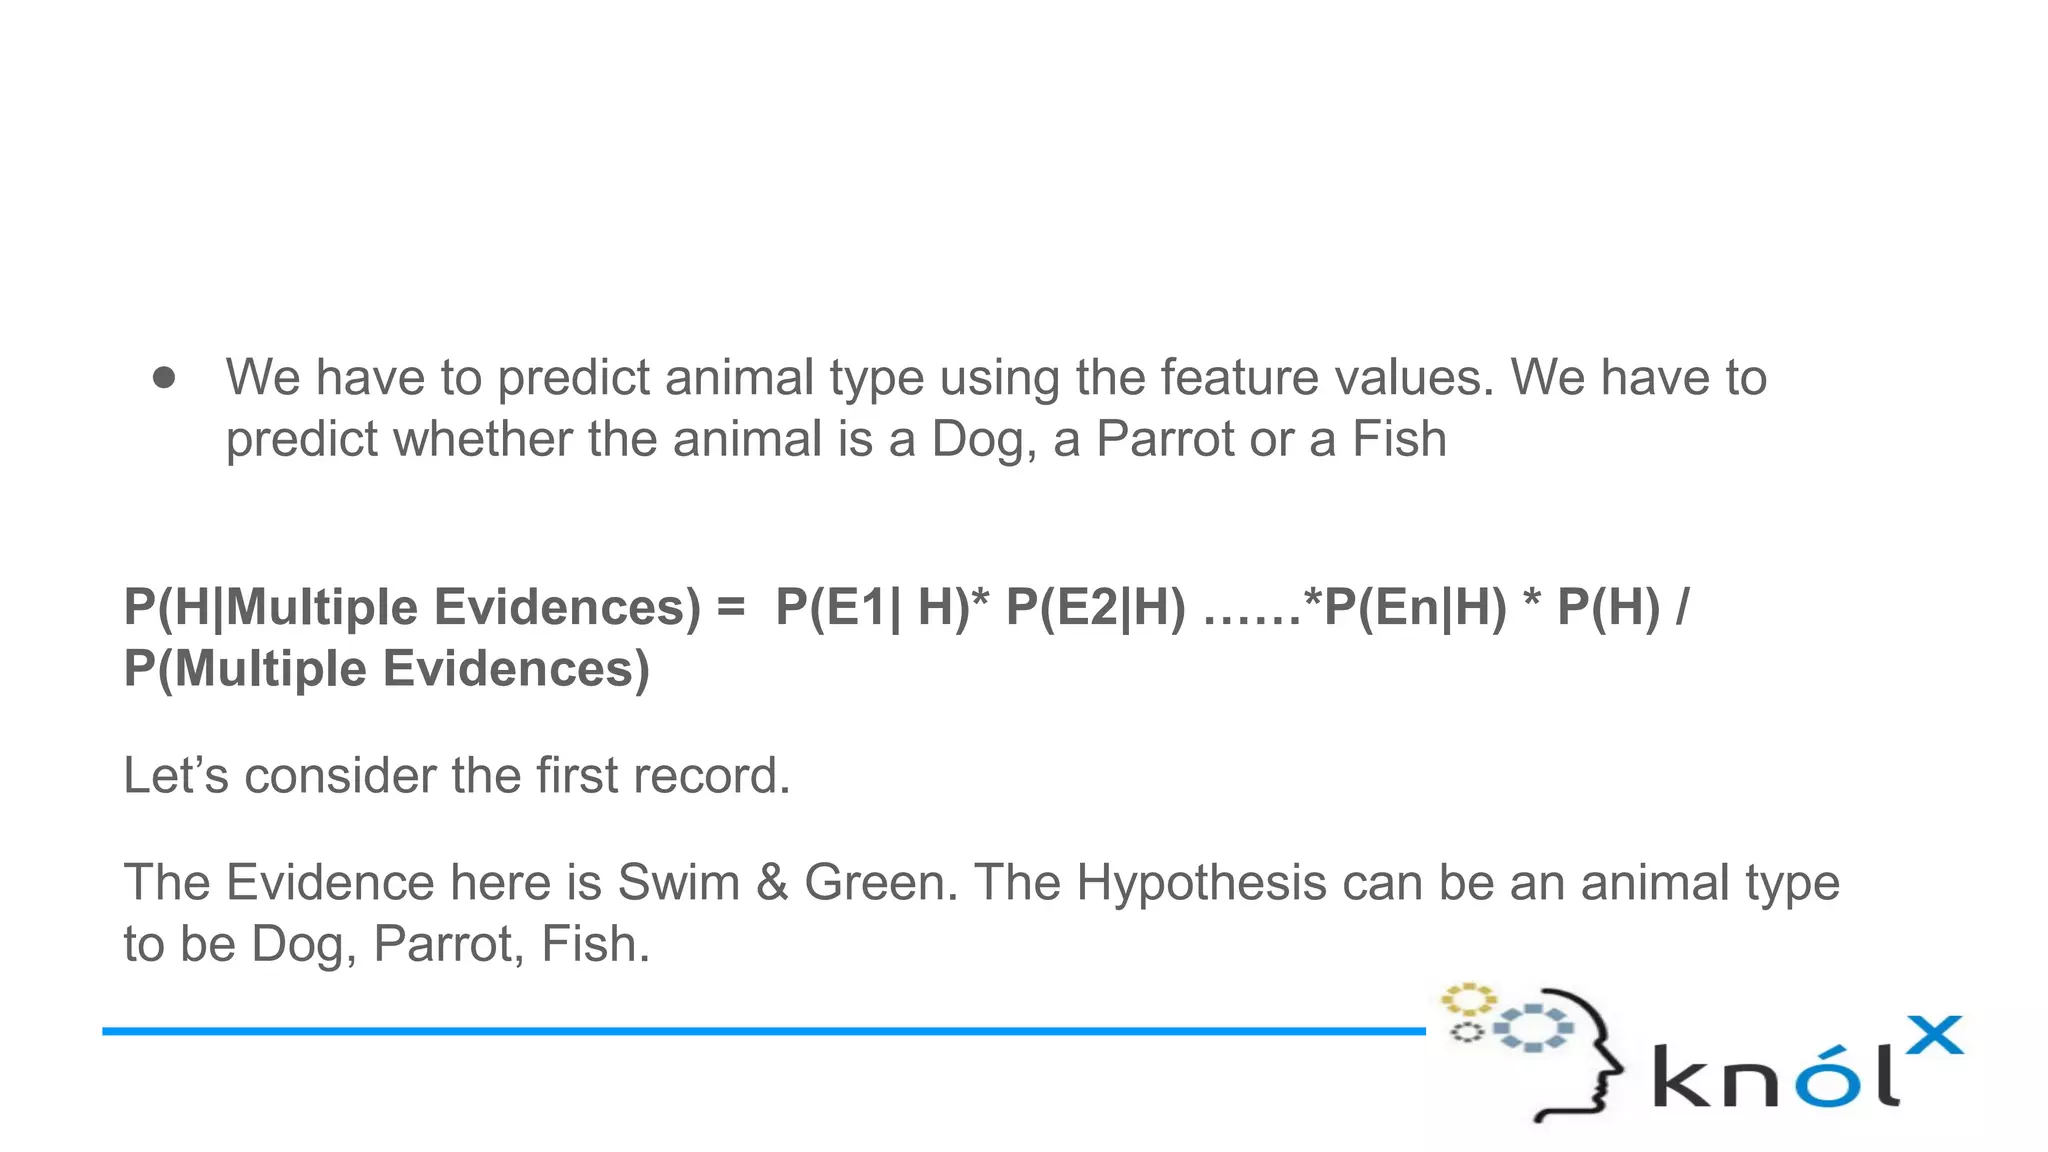
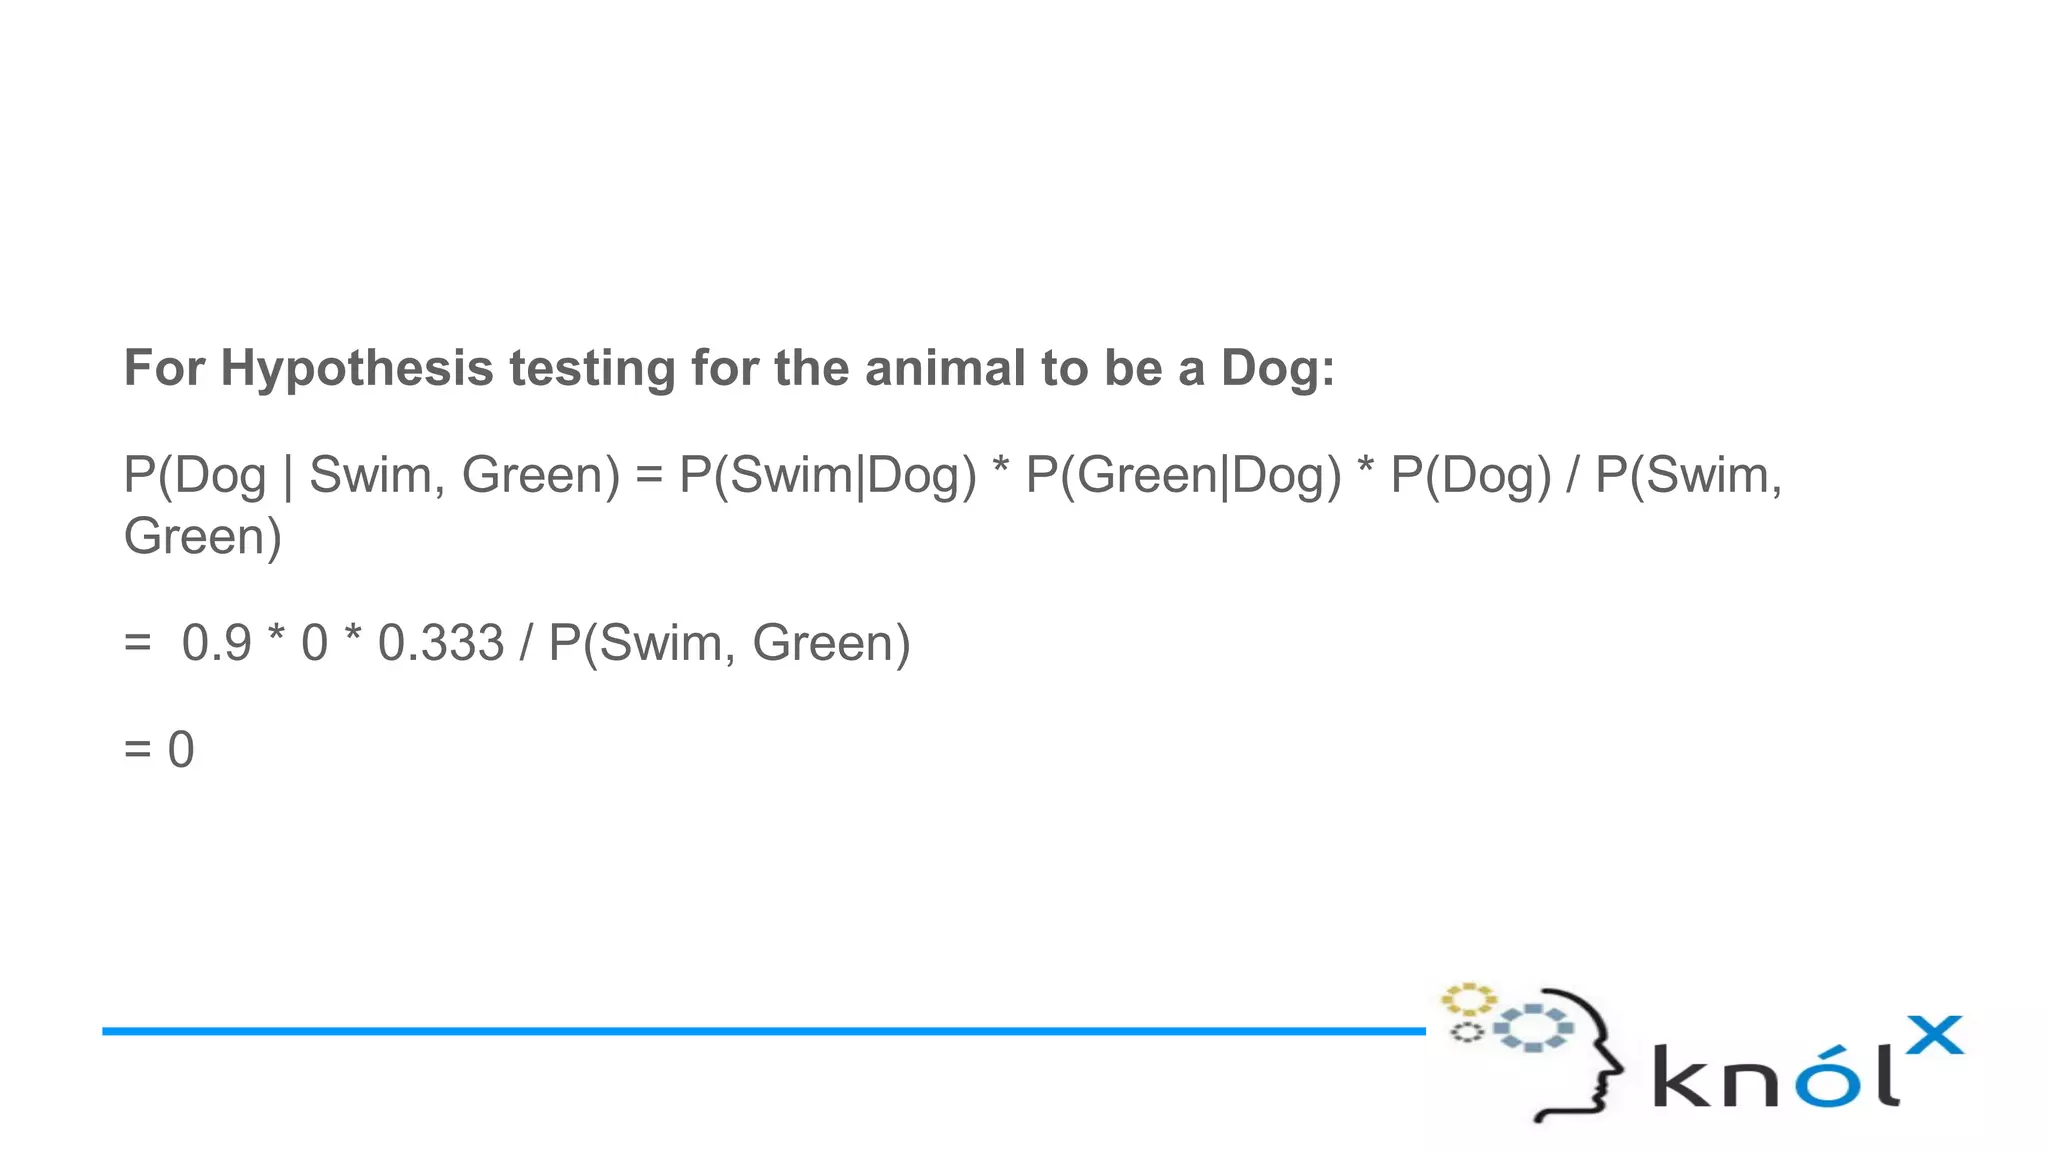
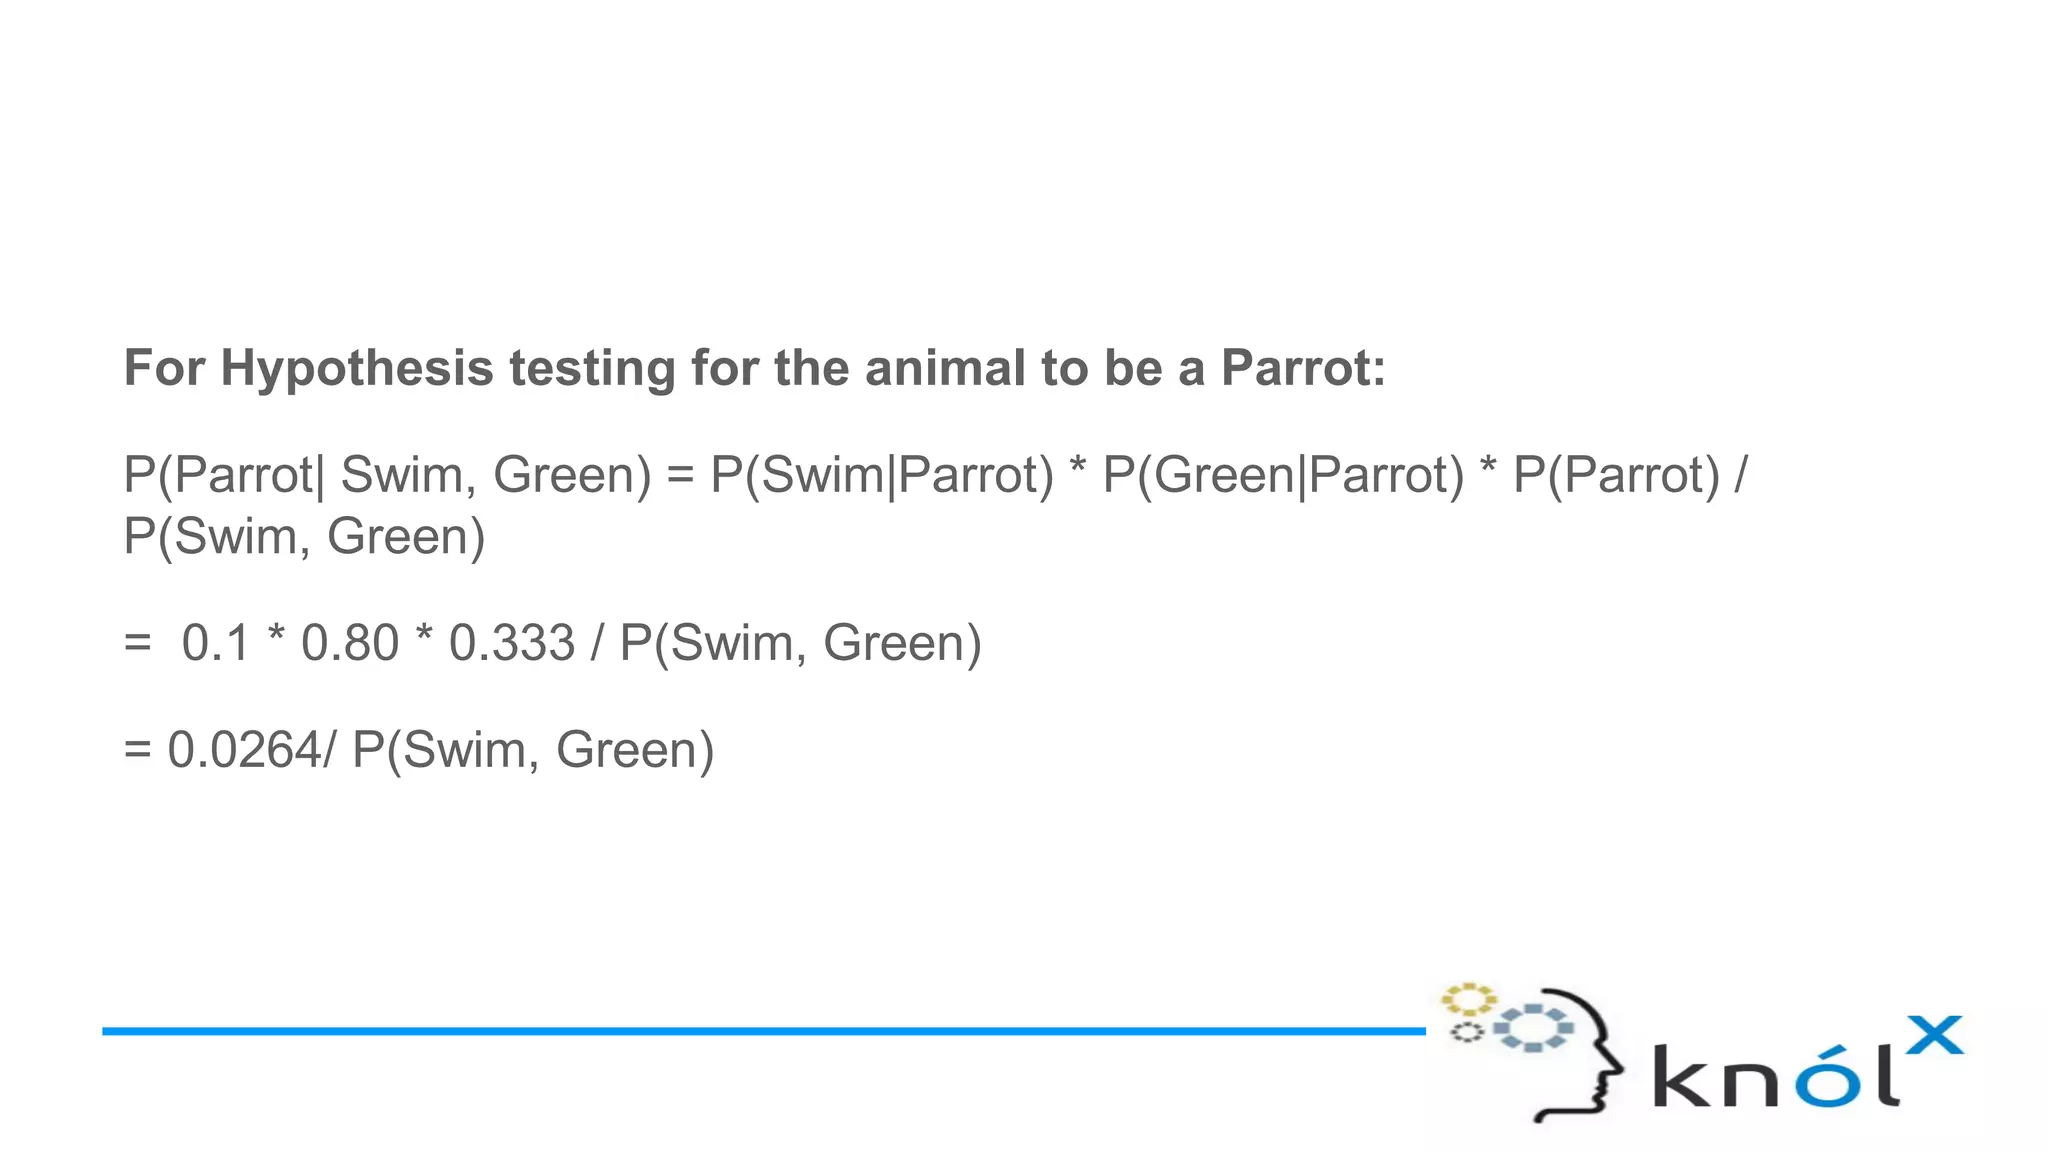
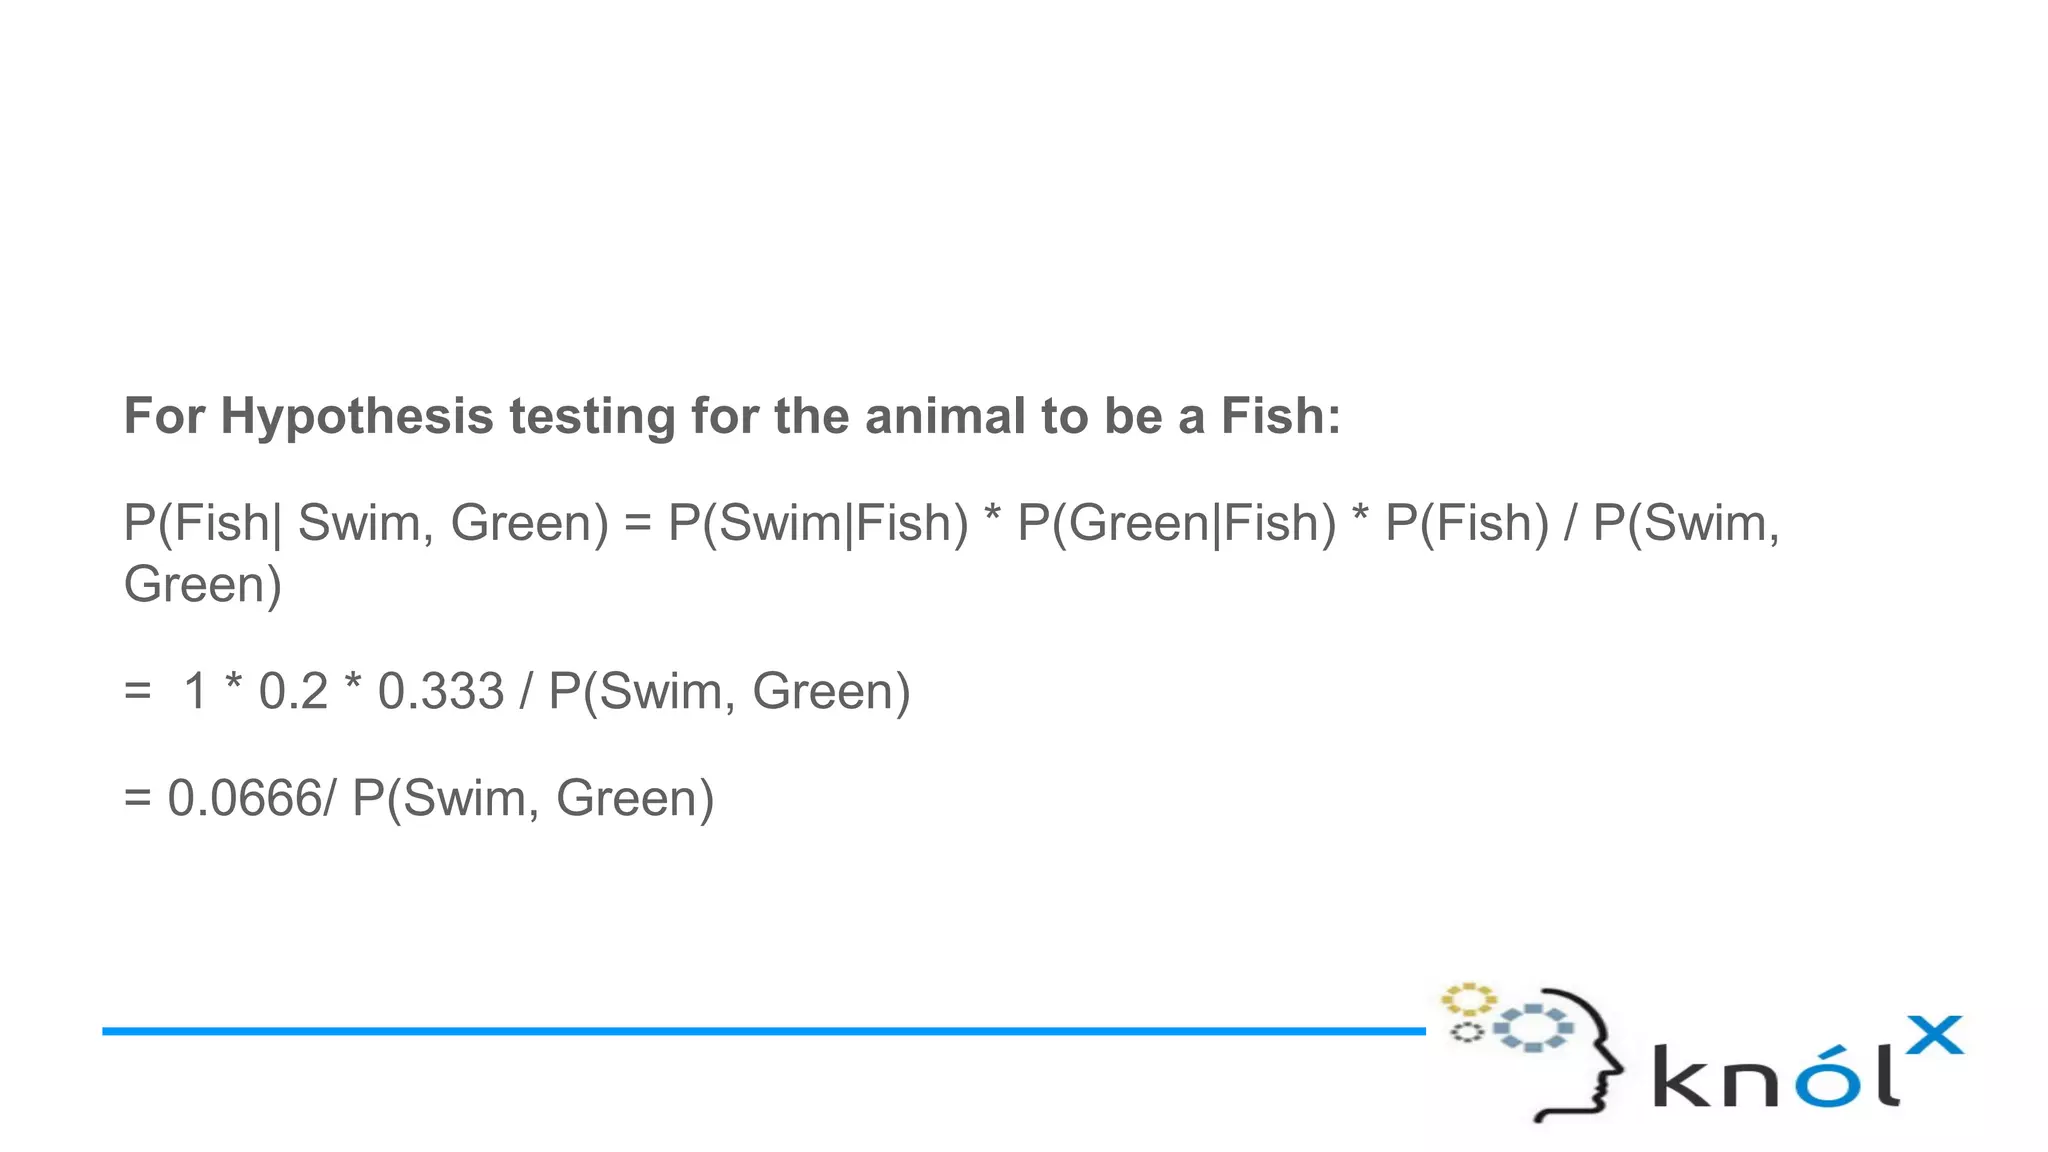
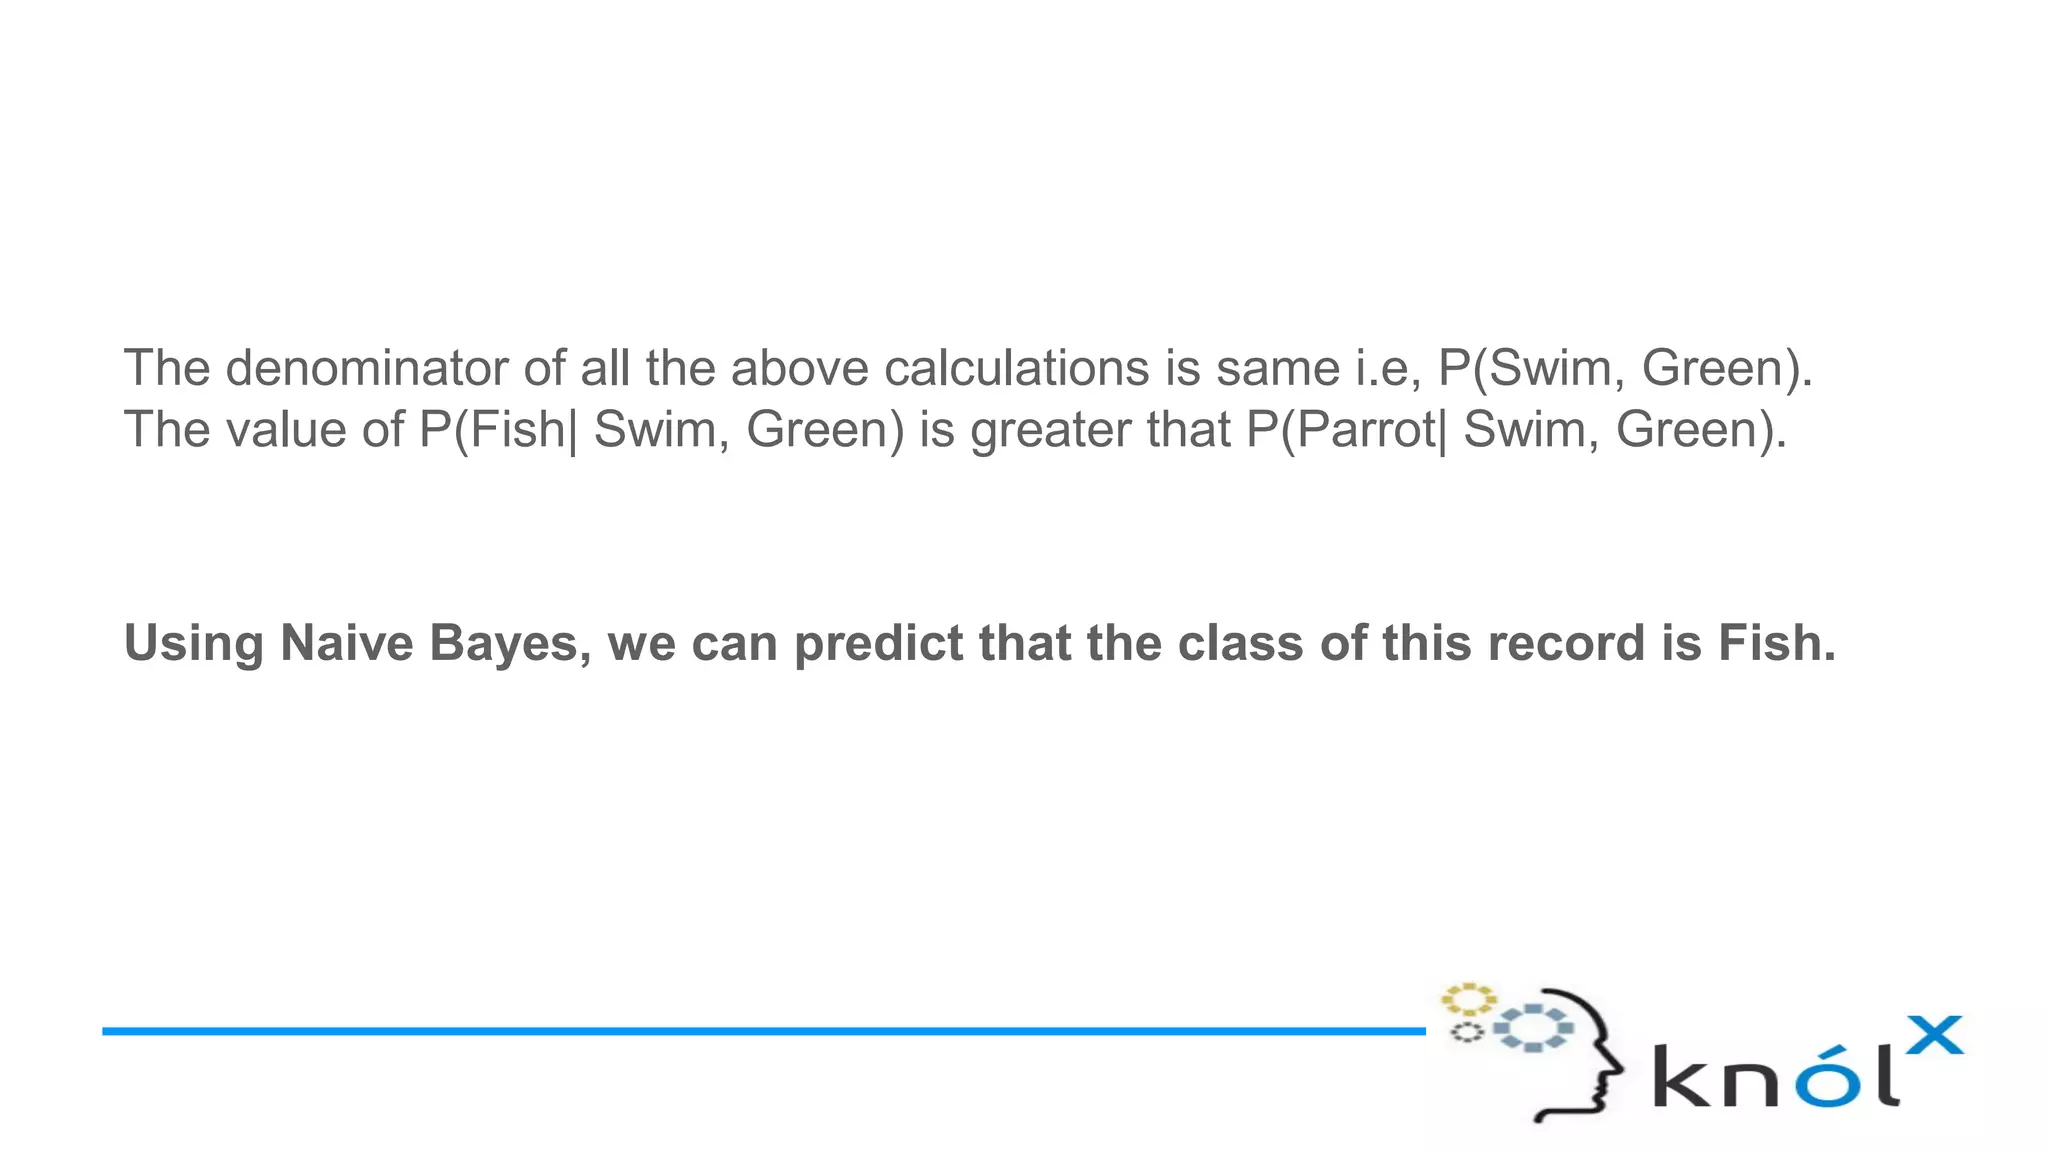
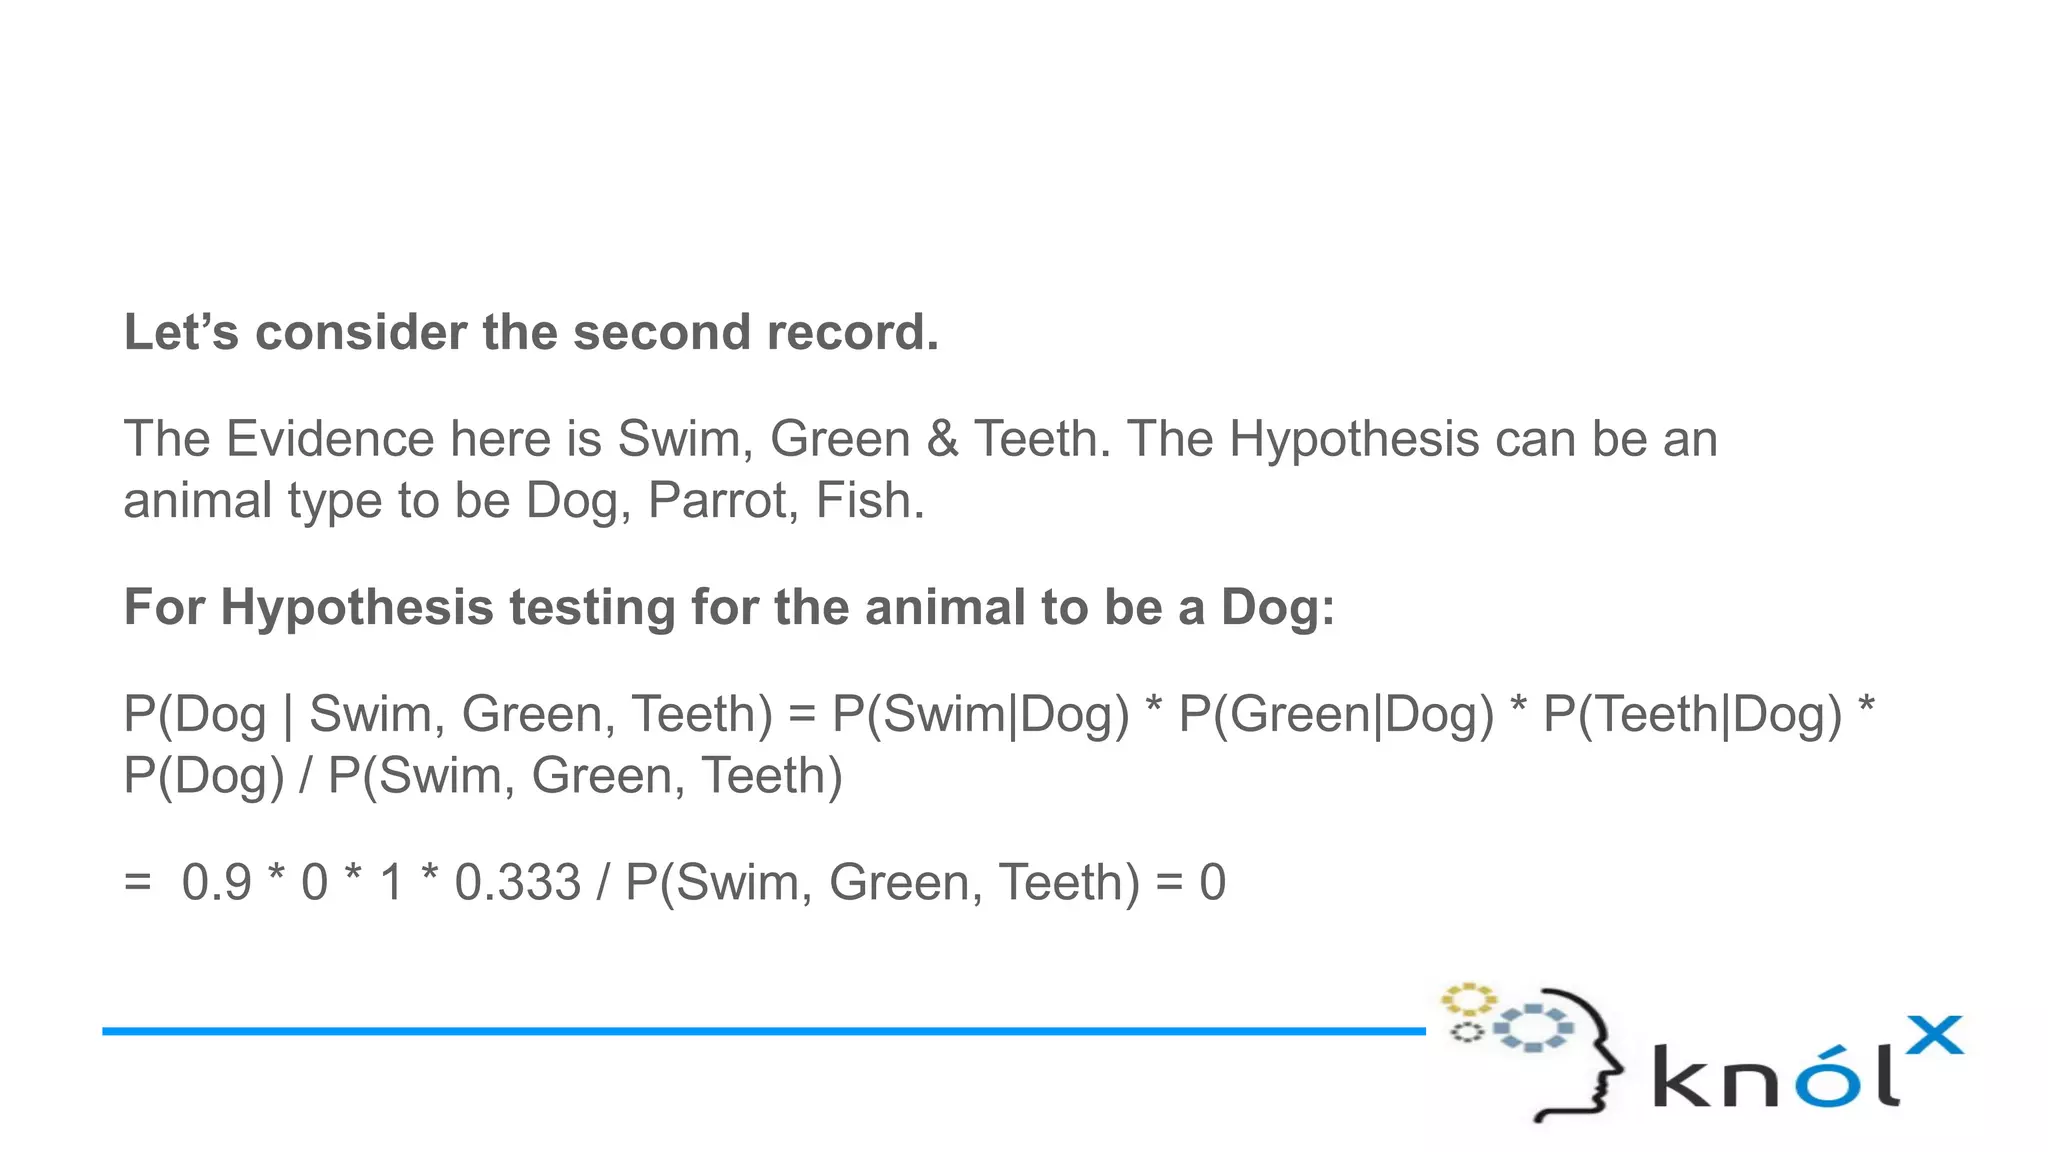
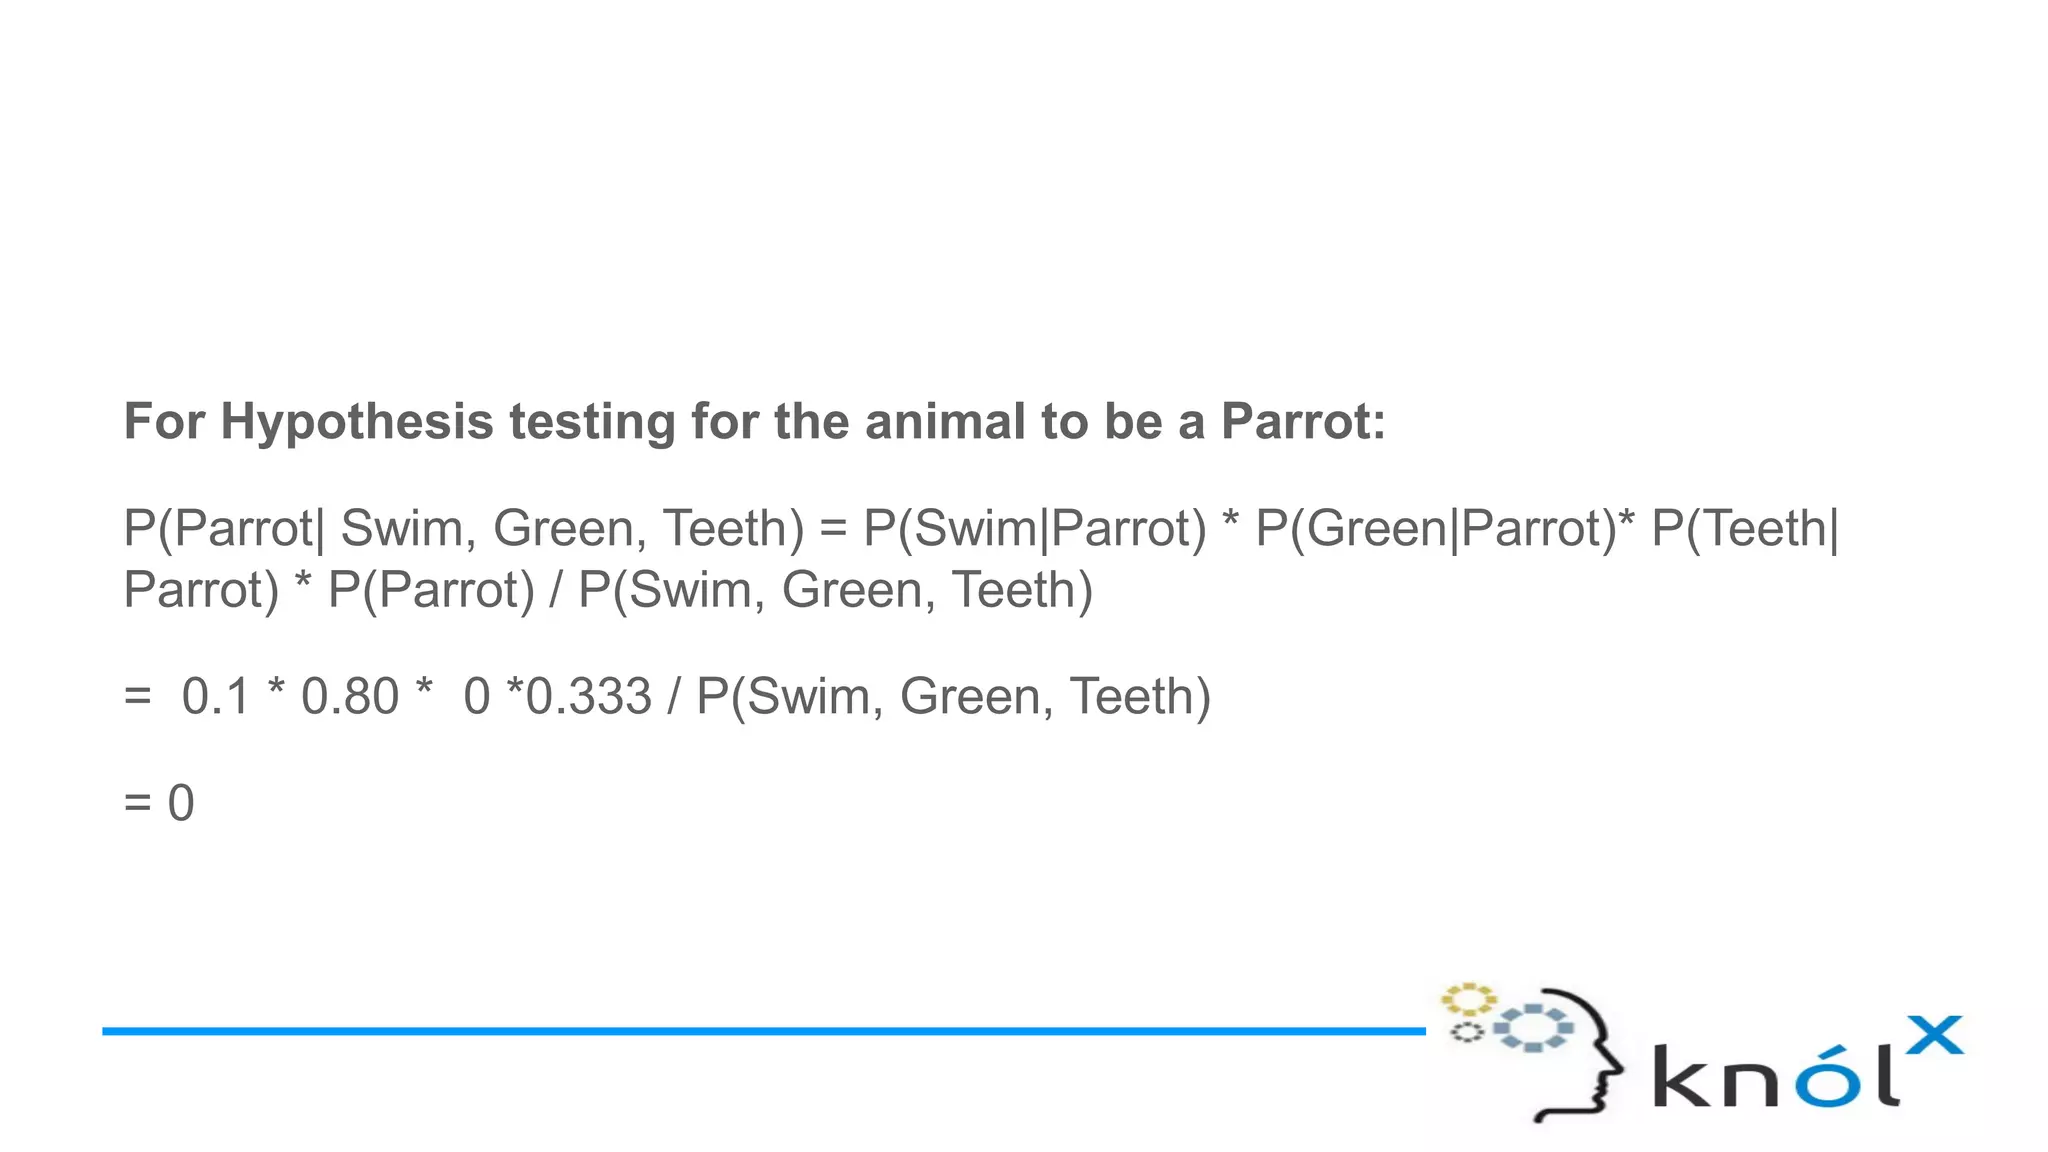
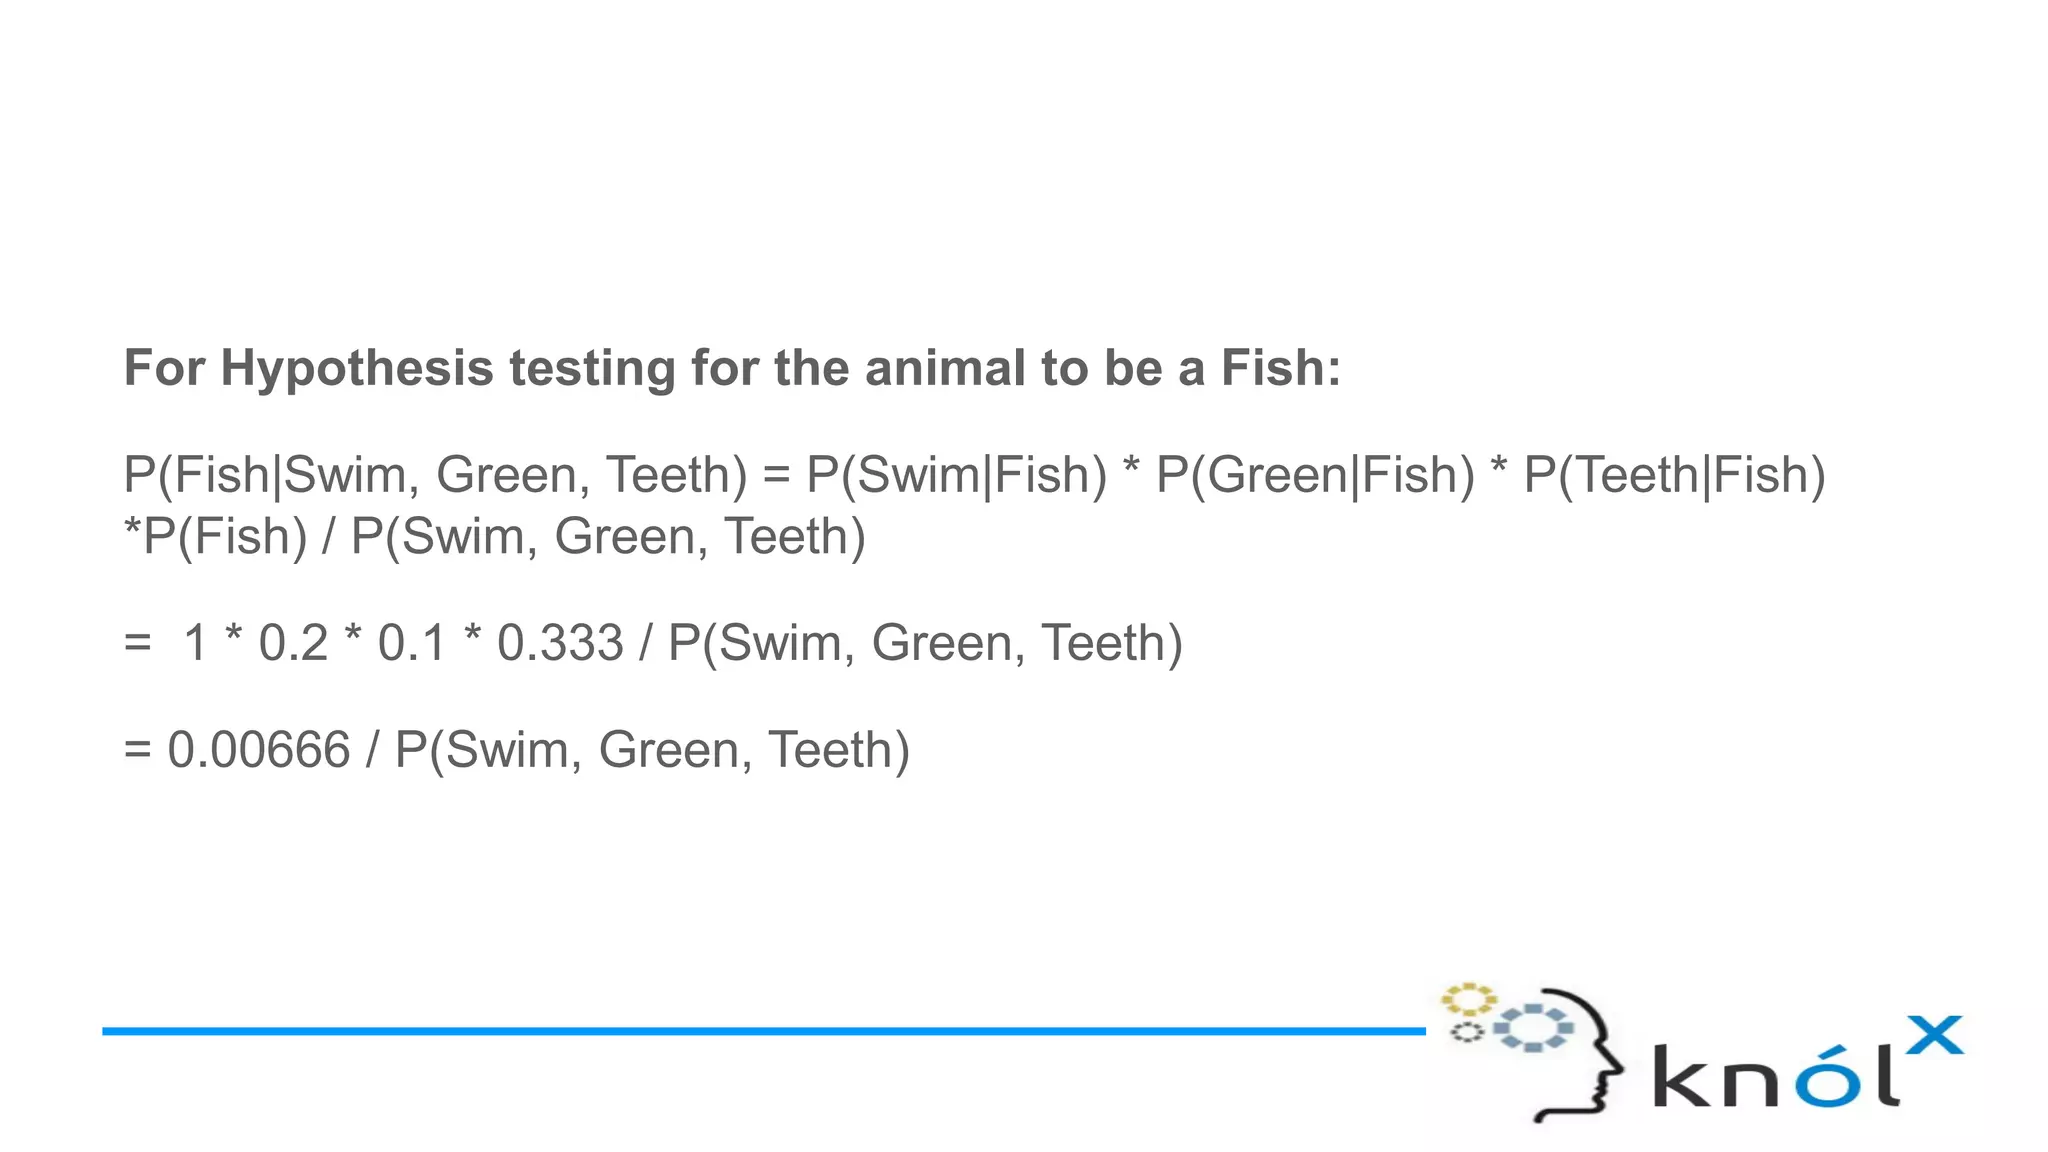


The document explains the Naive Bayes Classifier, built upon Bayes' theorem, which predicts class membership probabilities based on conditional probabilities of features. It discusses concepts like conditional probability, Bayes’ theorem, and provides examples to illustrate how the classifier functions, including its assumptions of feature independence. Additionally, it outlines types of Naive Bayes algorithms such as Gaussian, Bernoulli, and Multinomial, with applications in classification tasks.