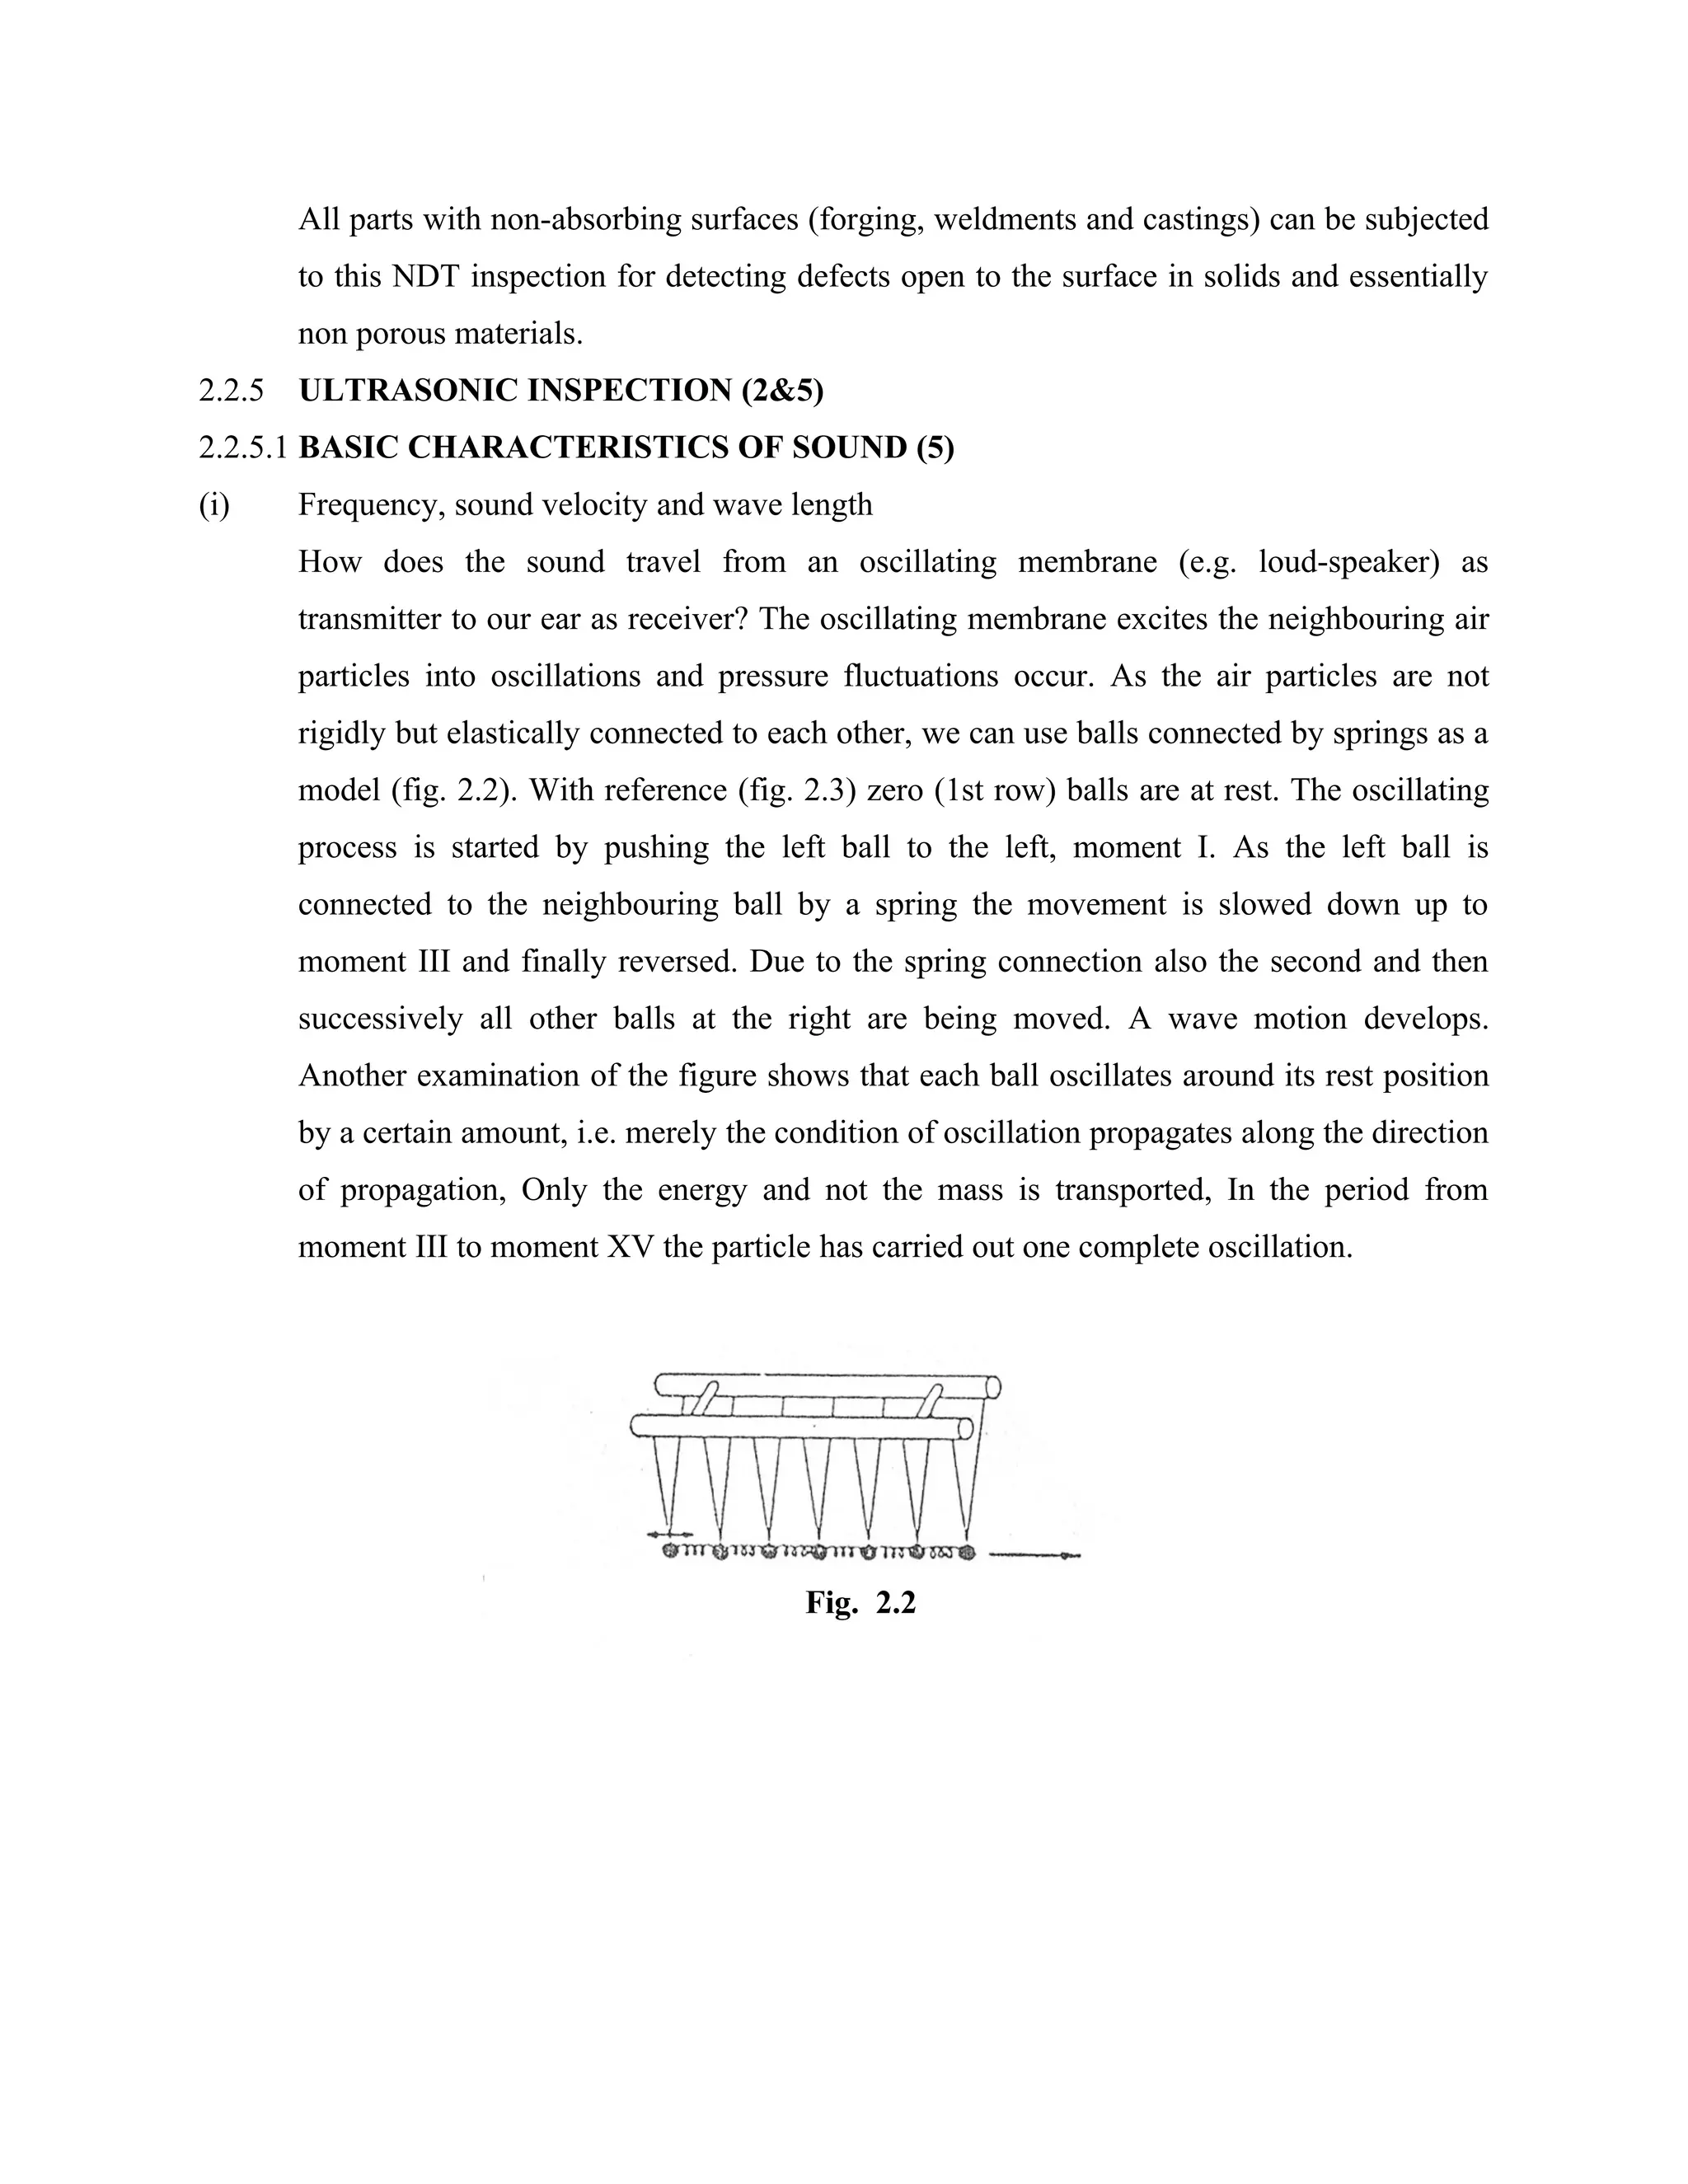
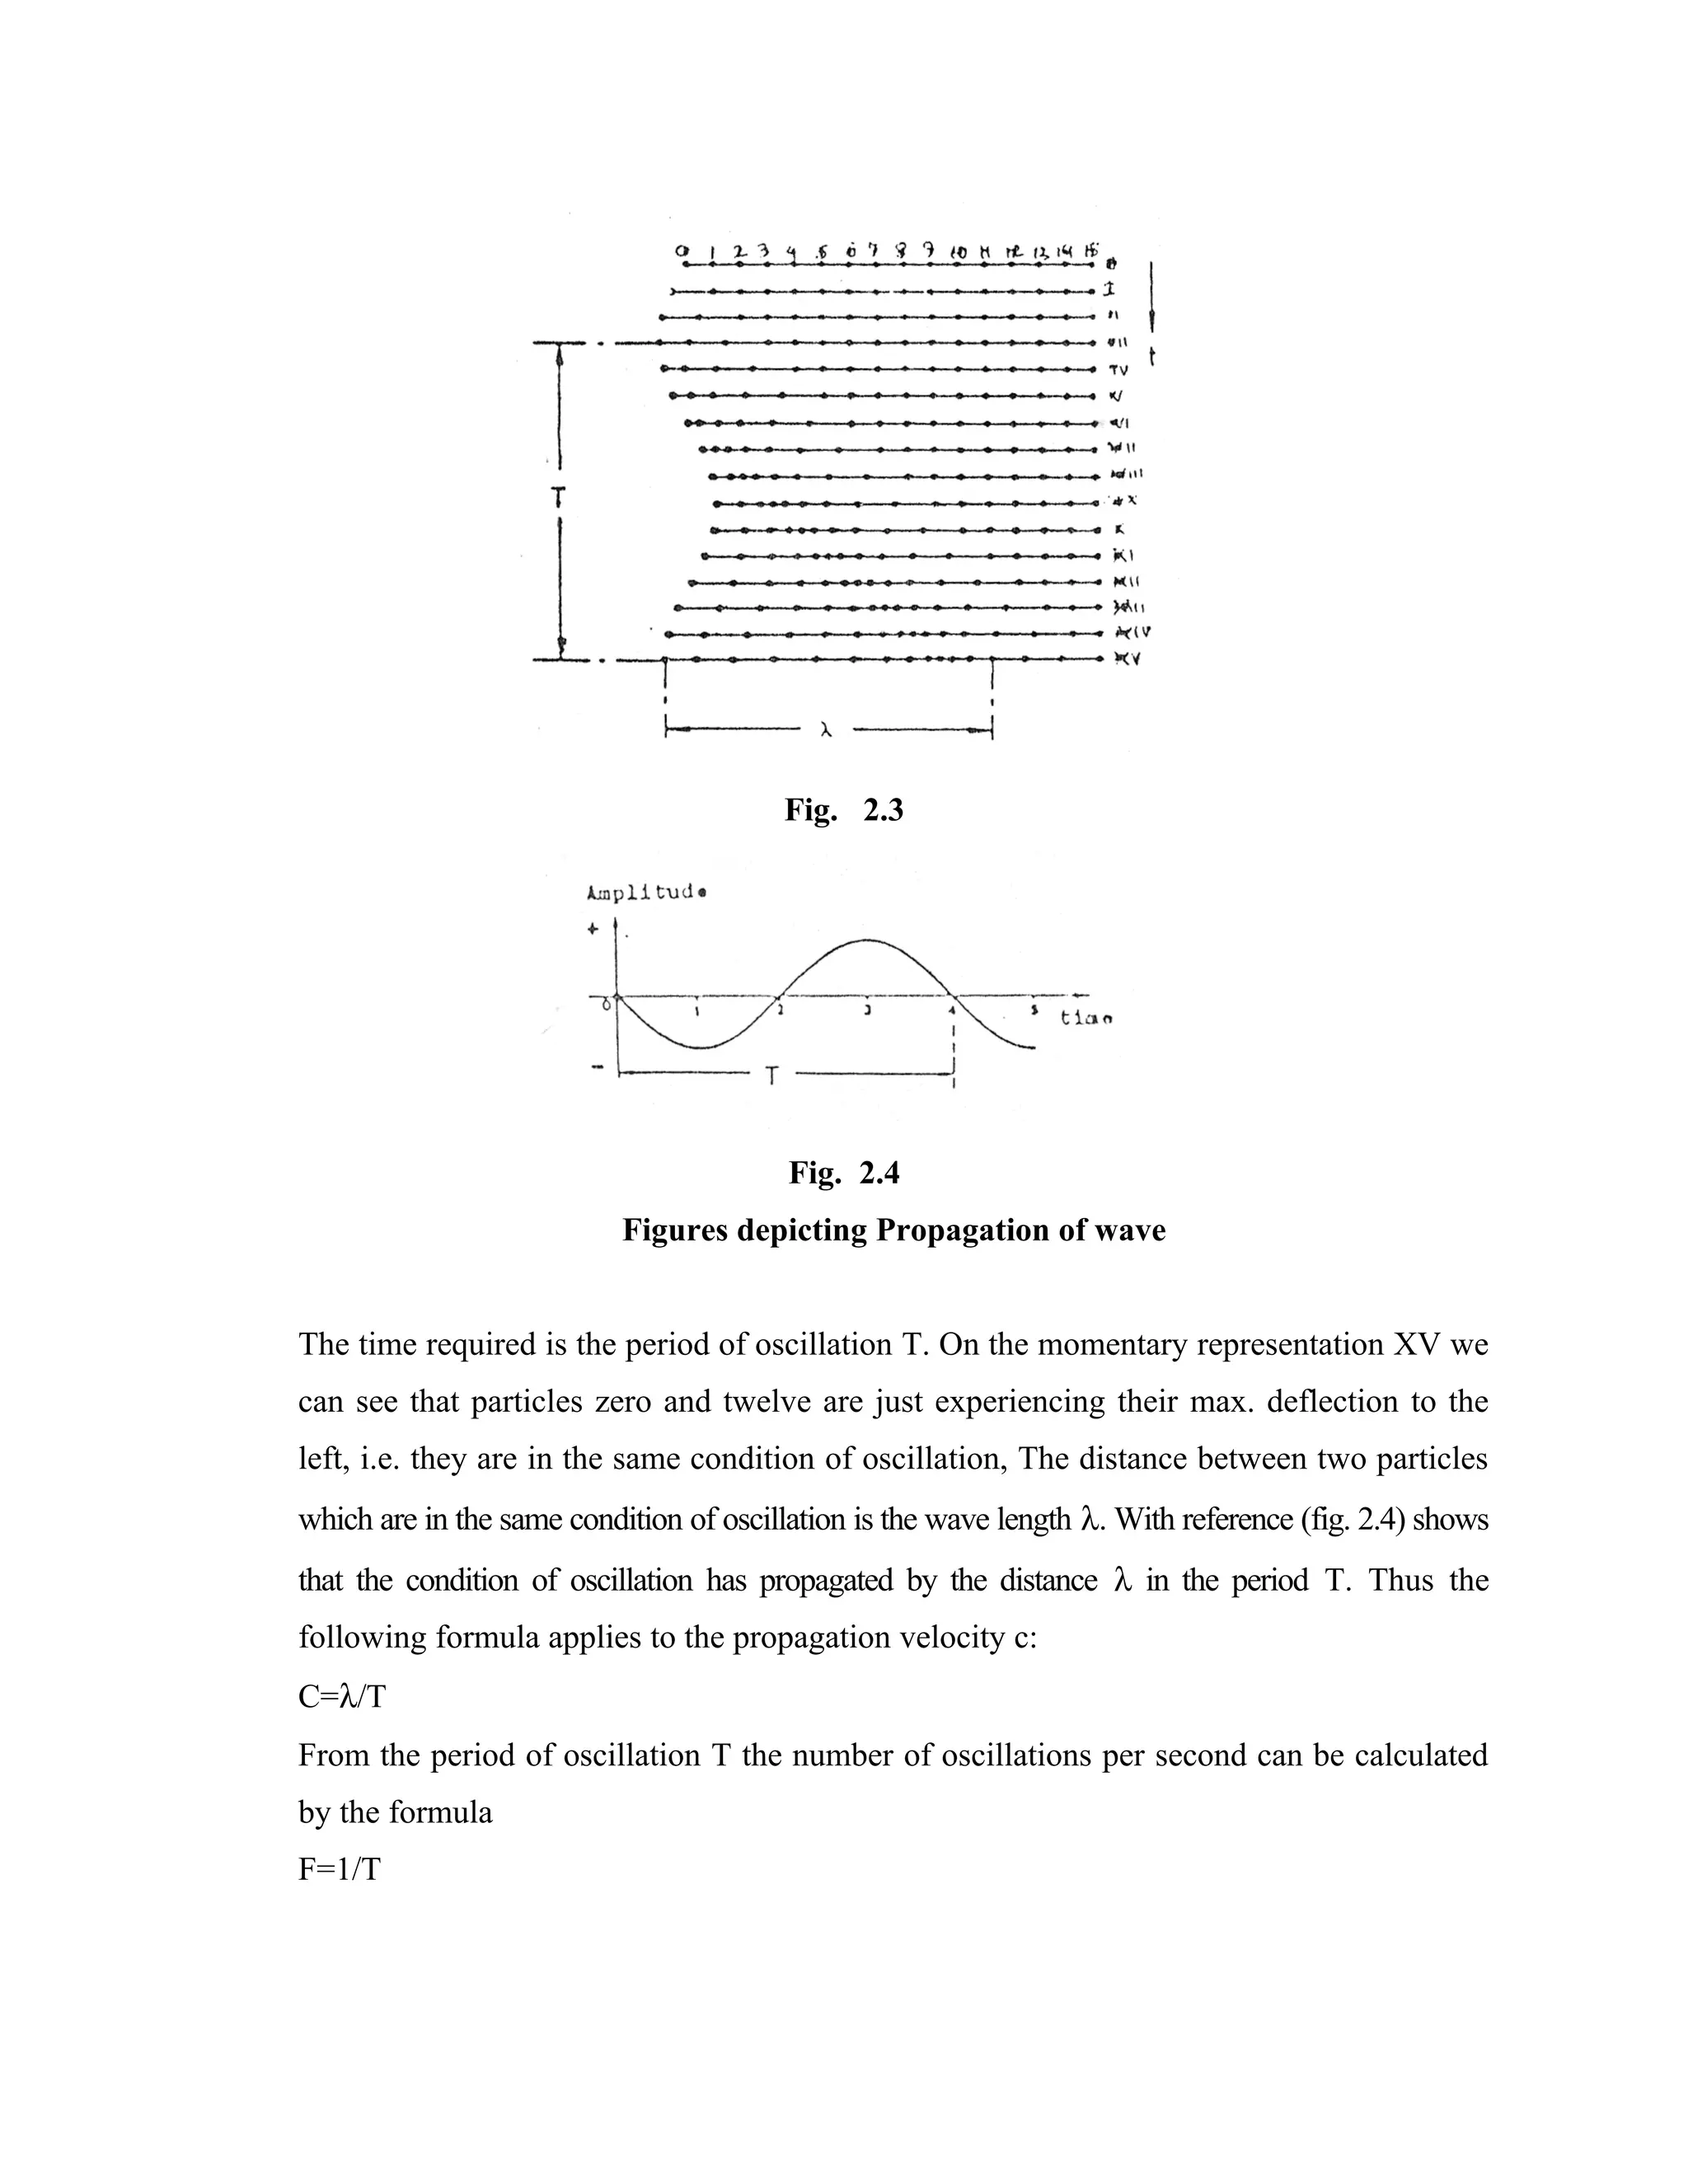
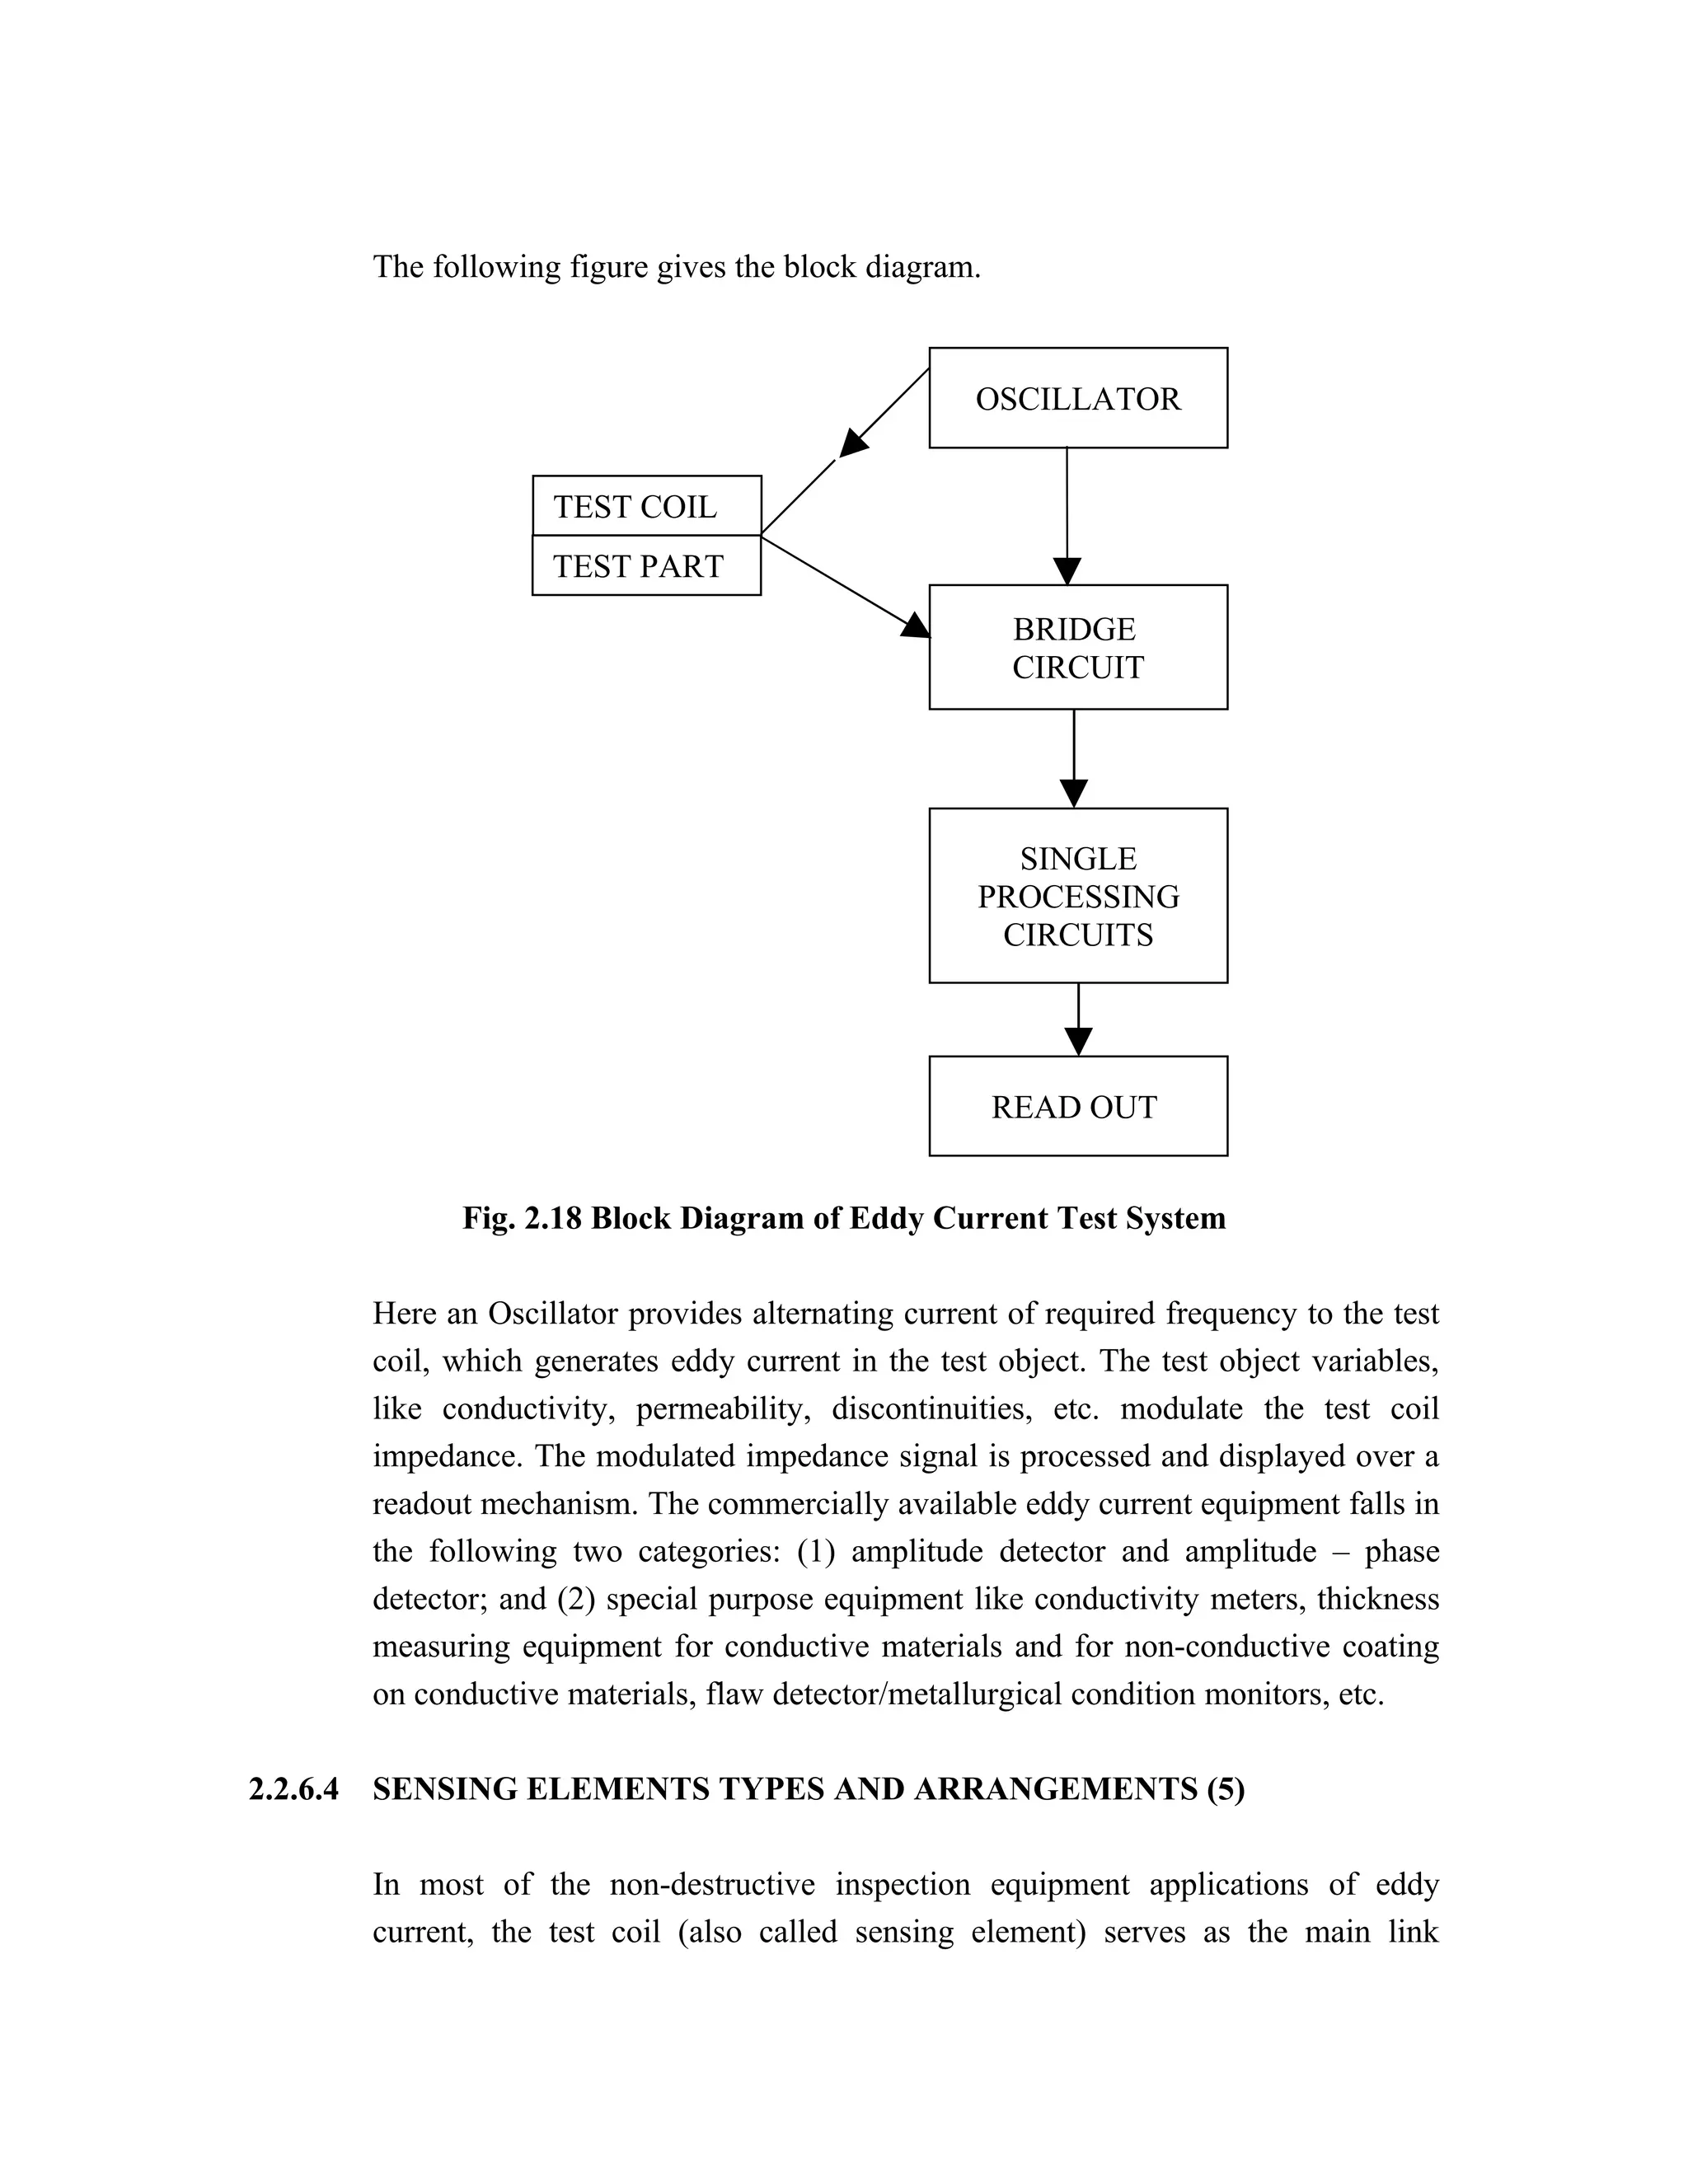
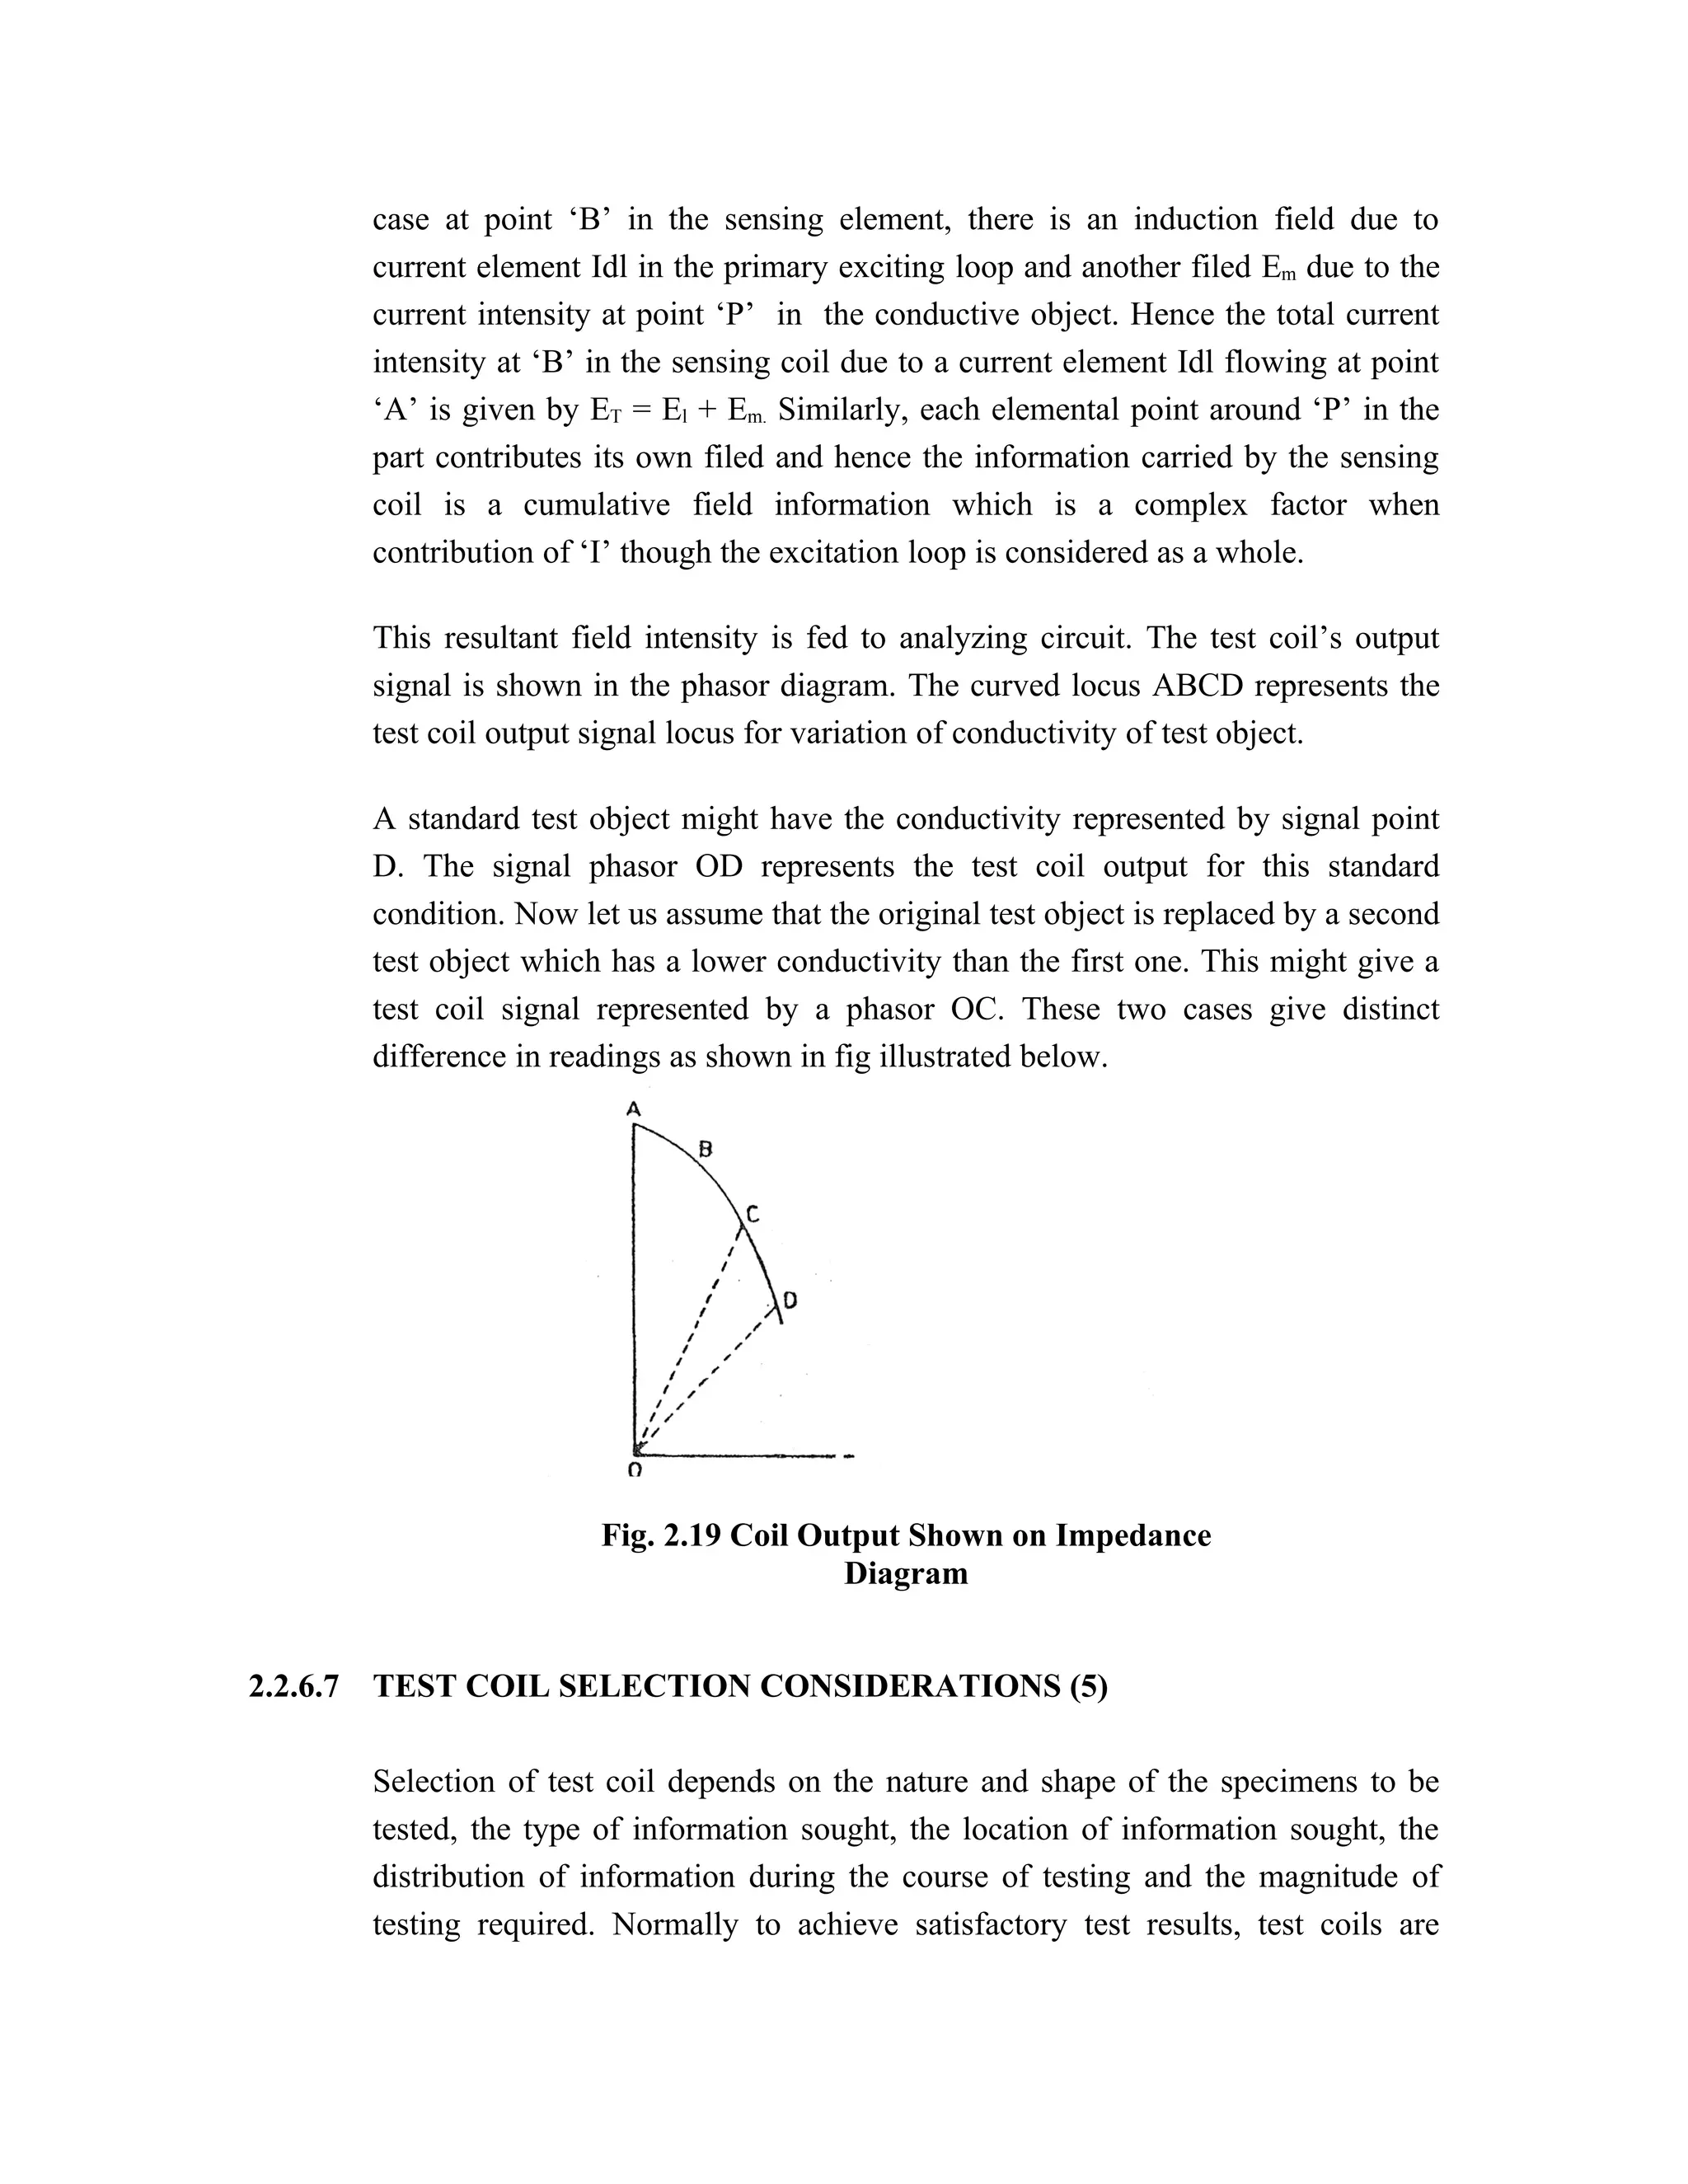
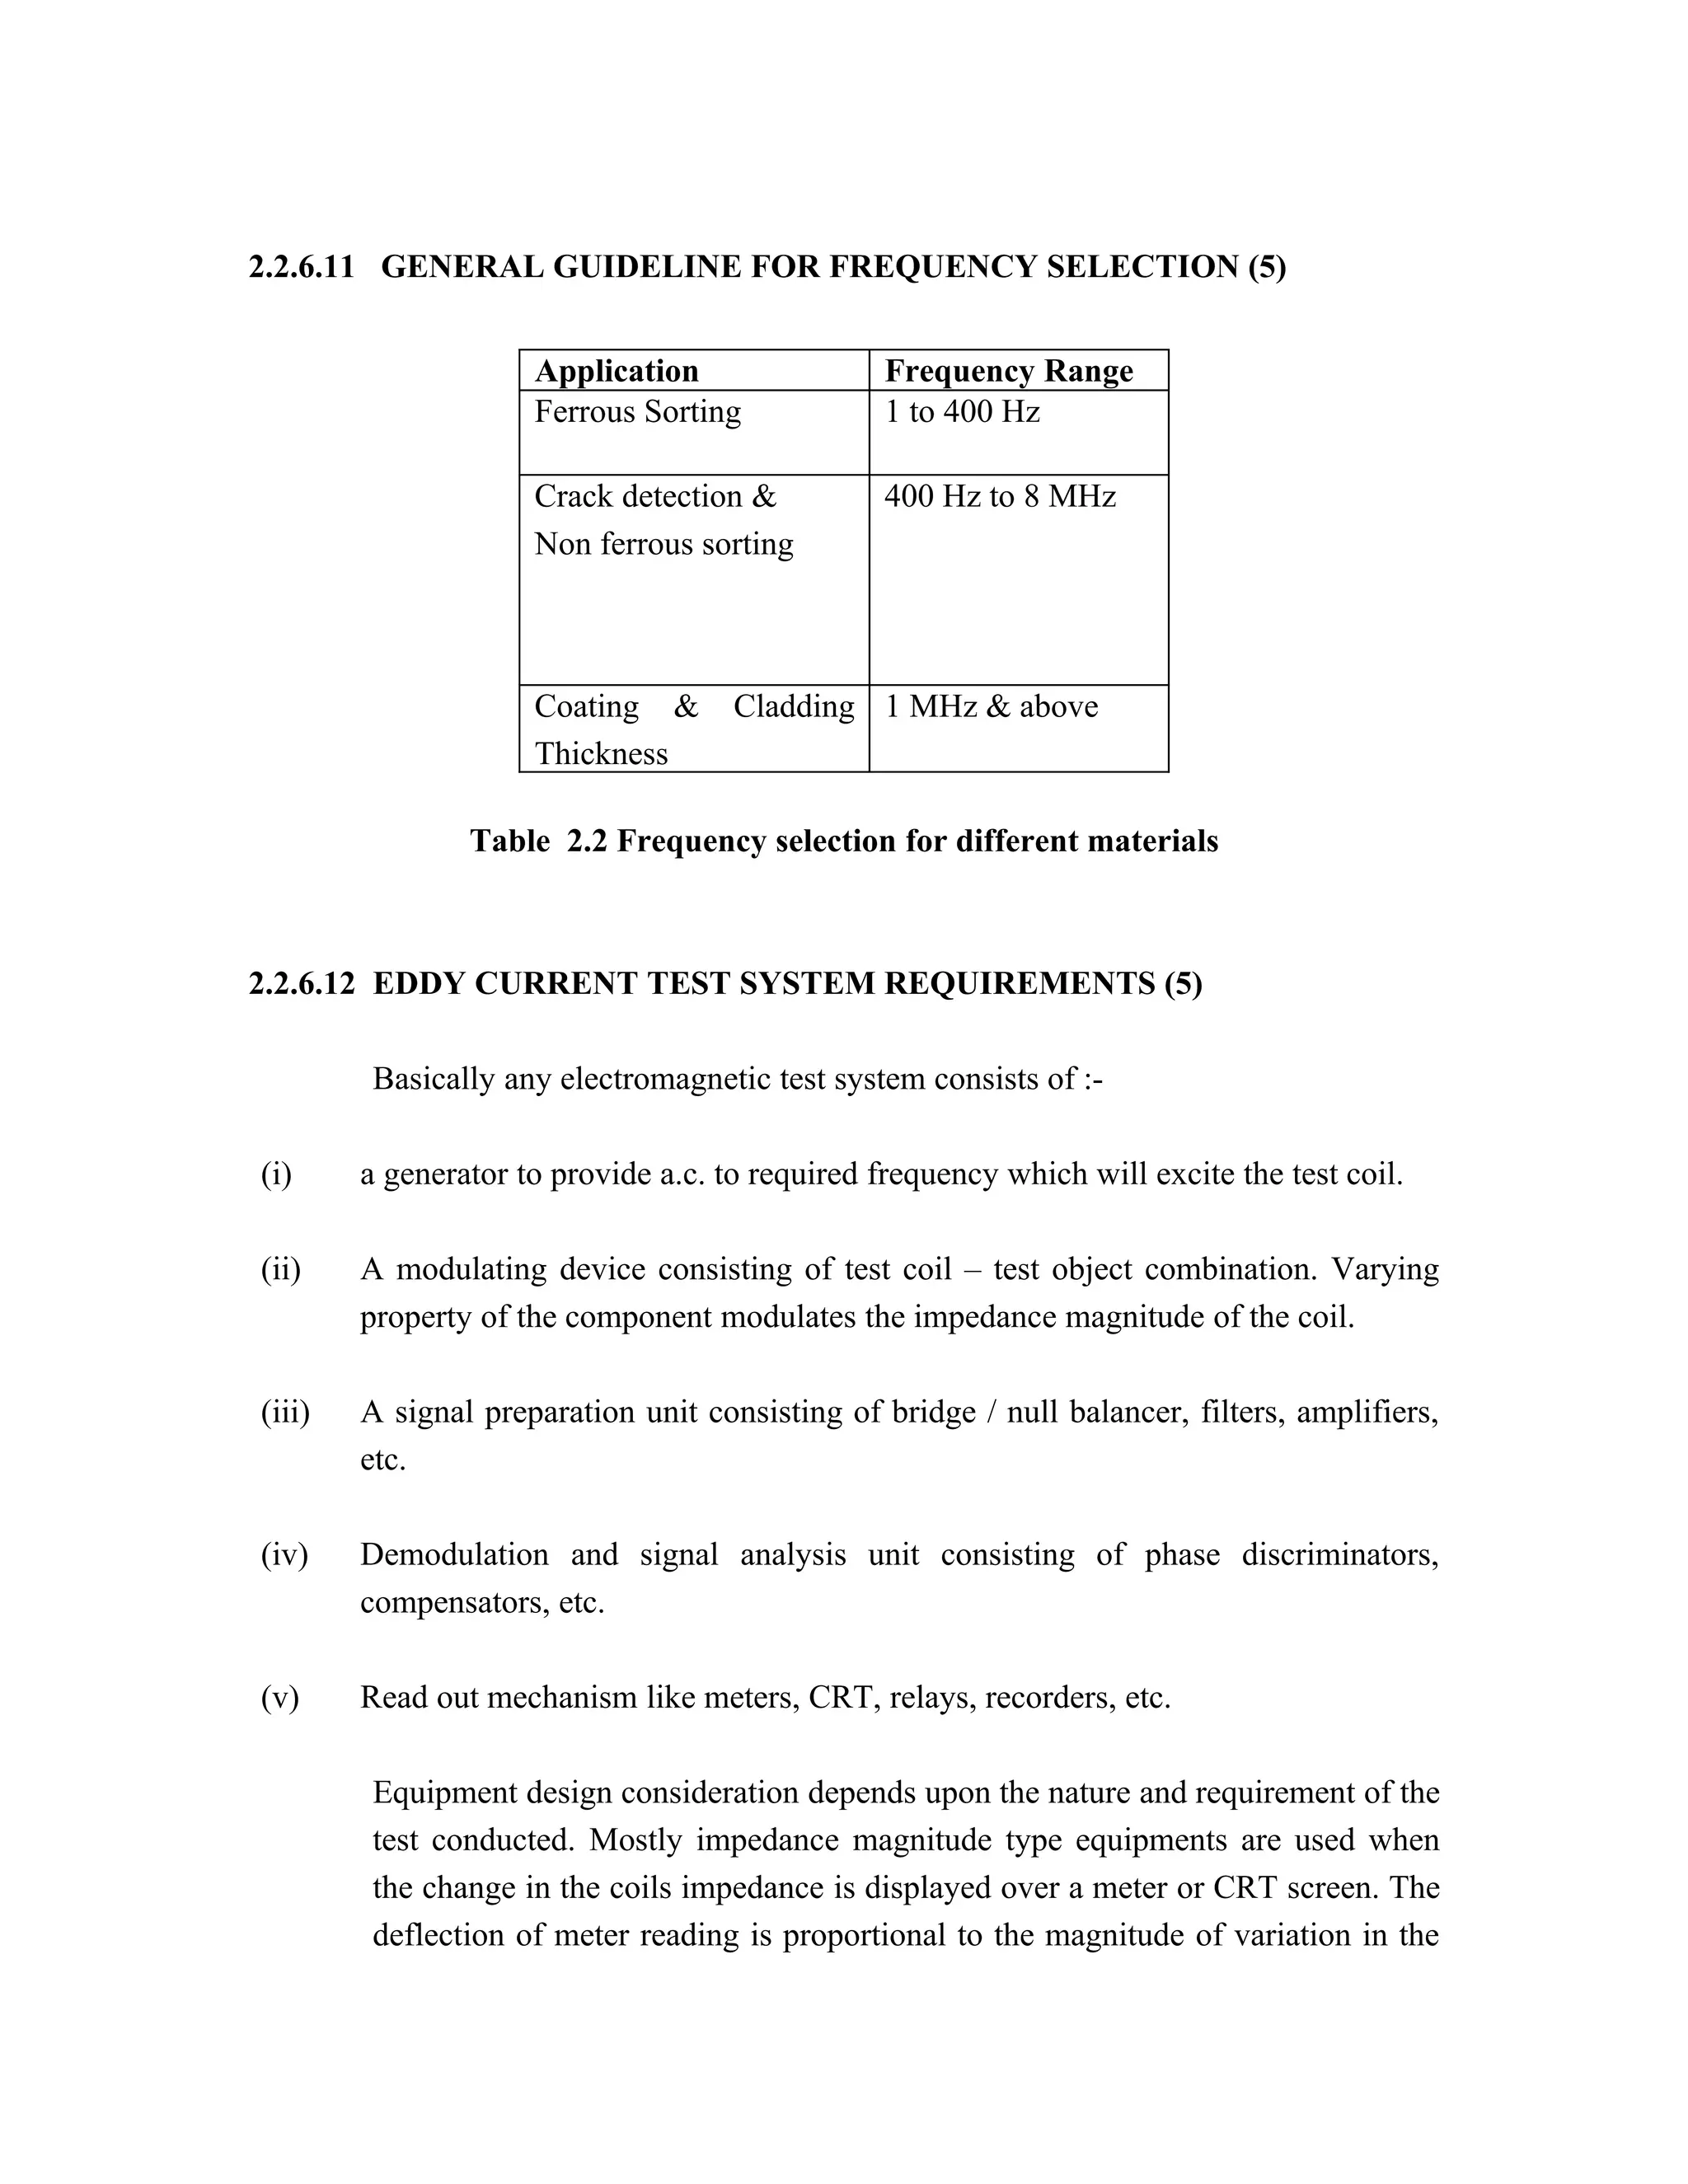
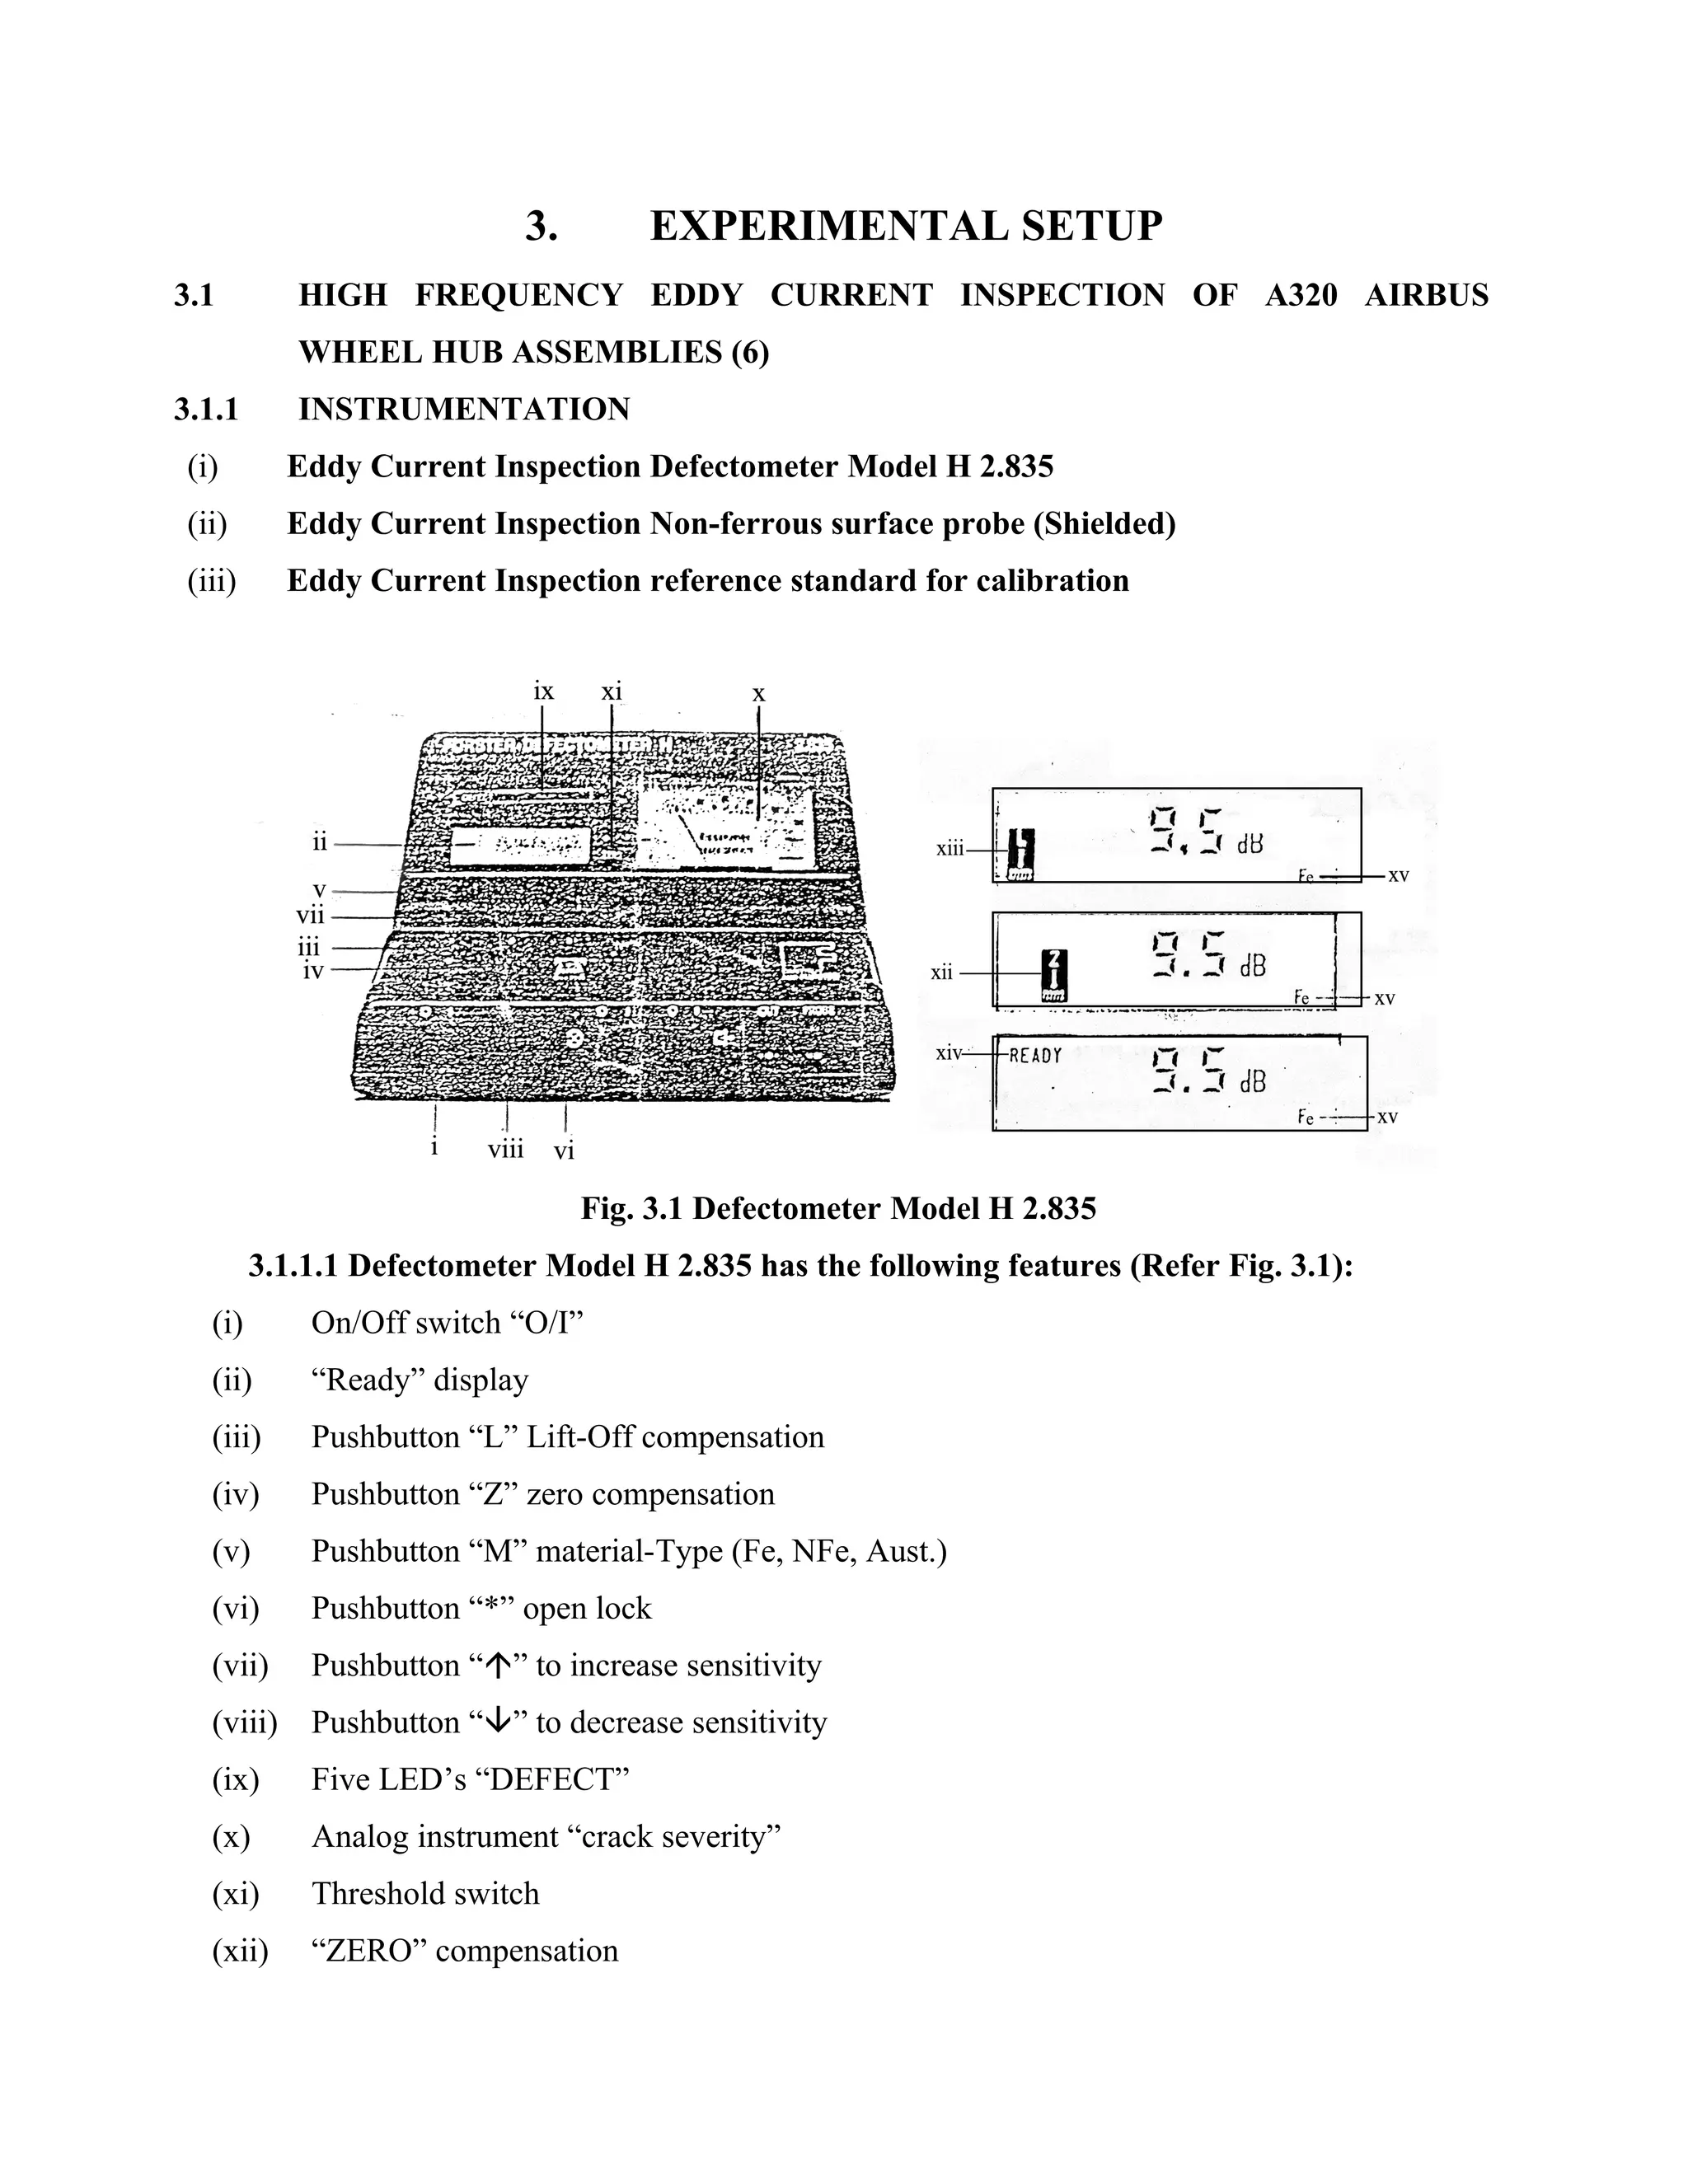
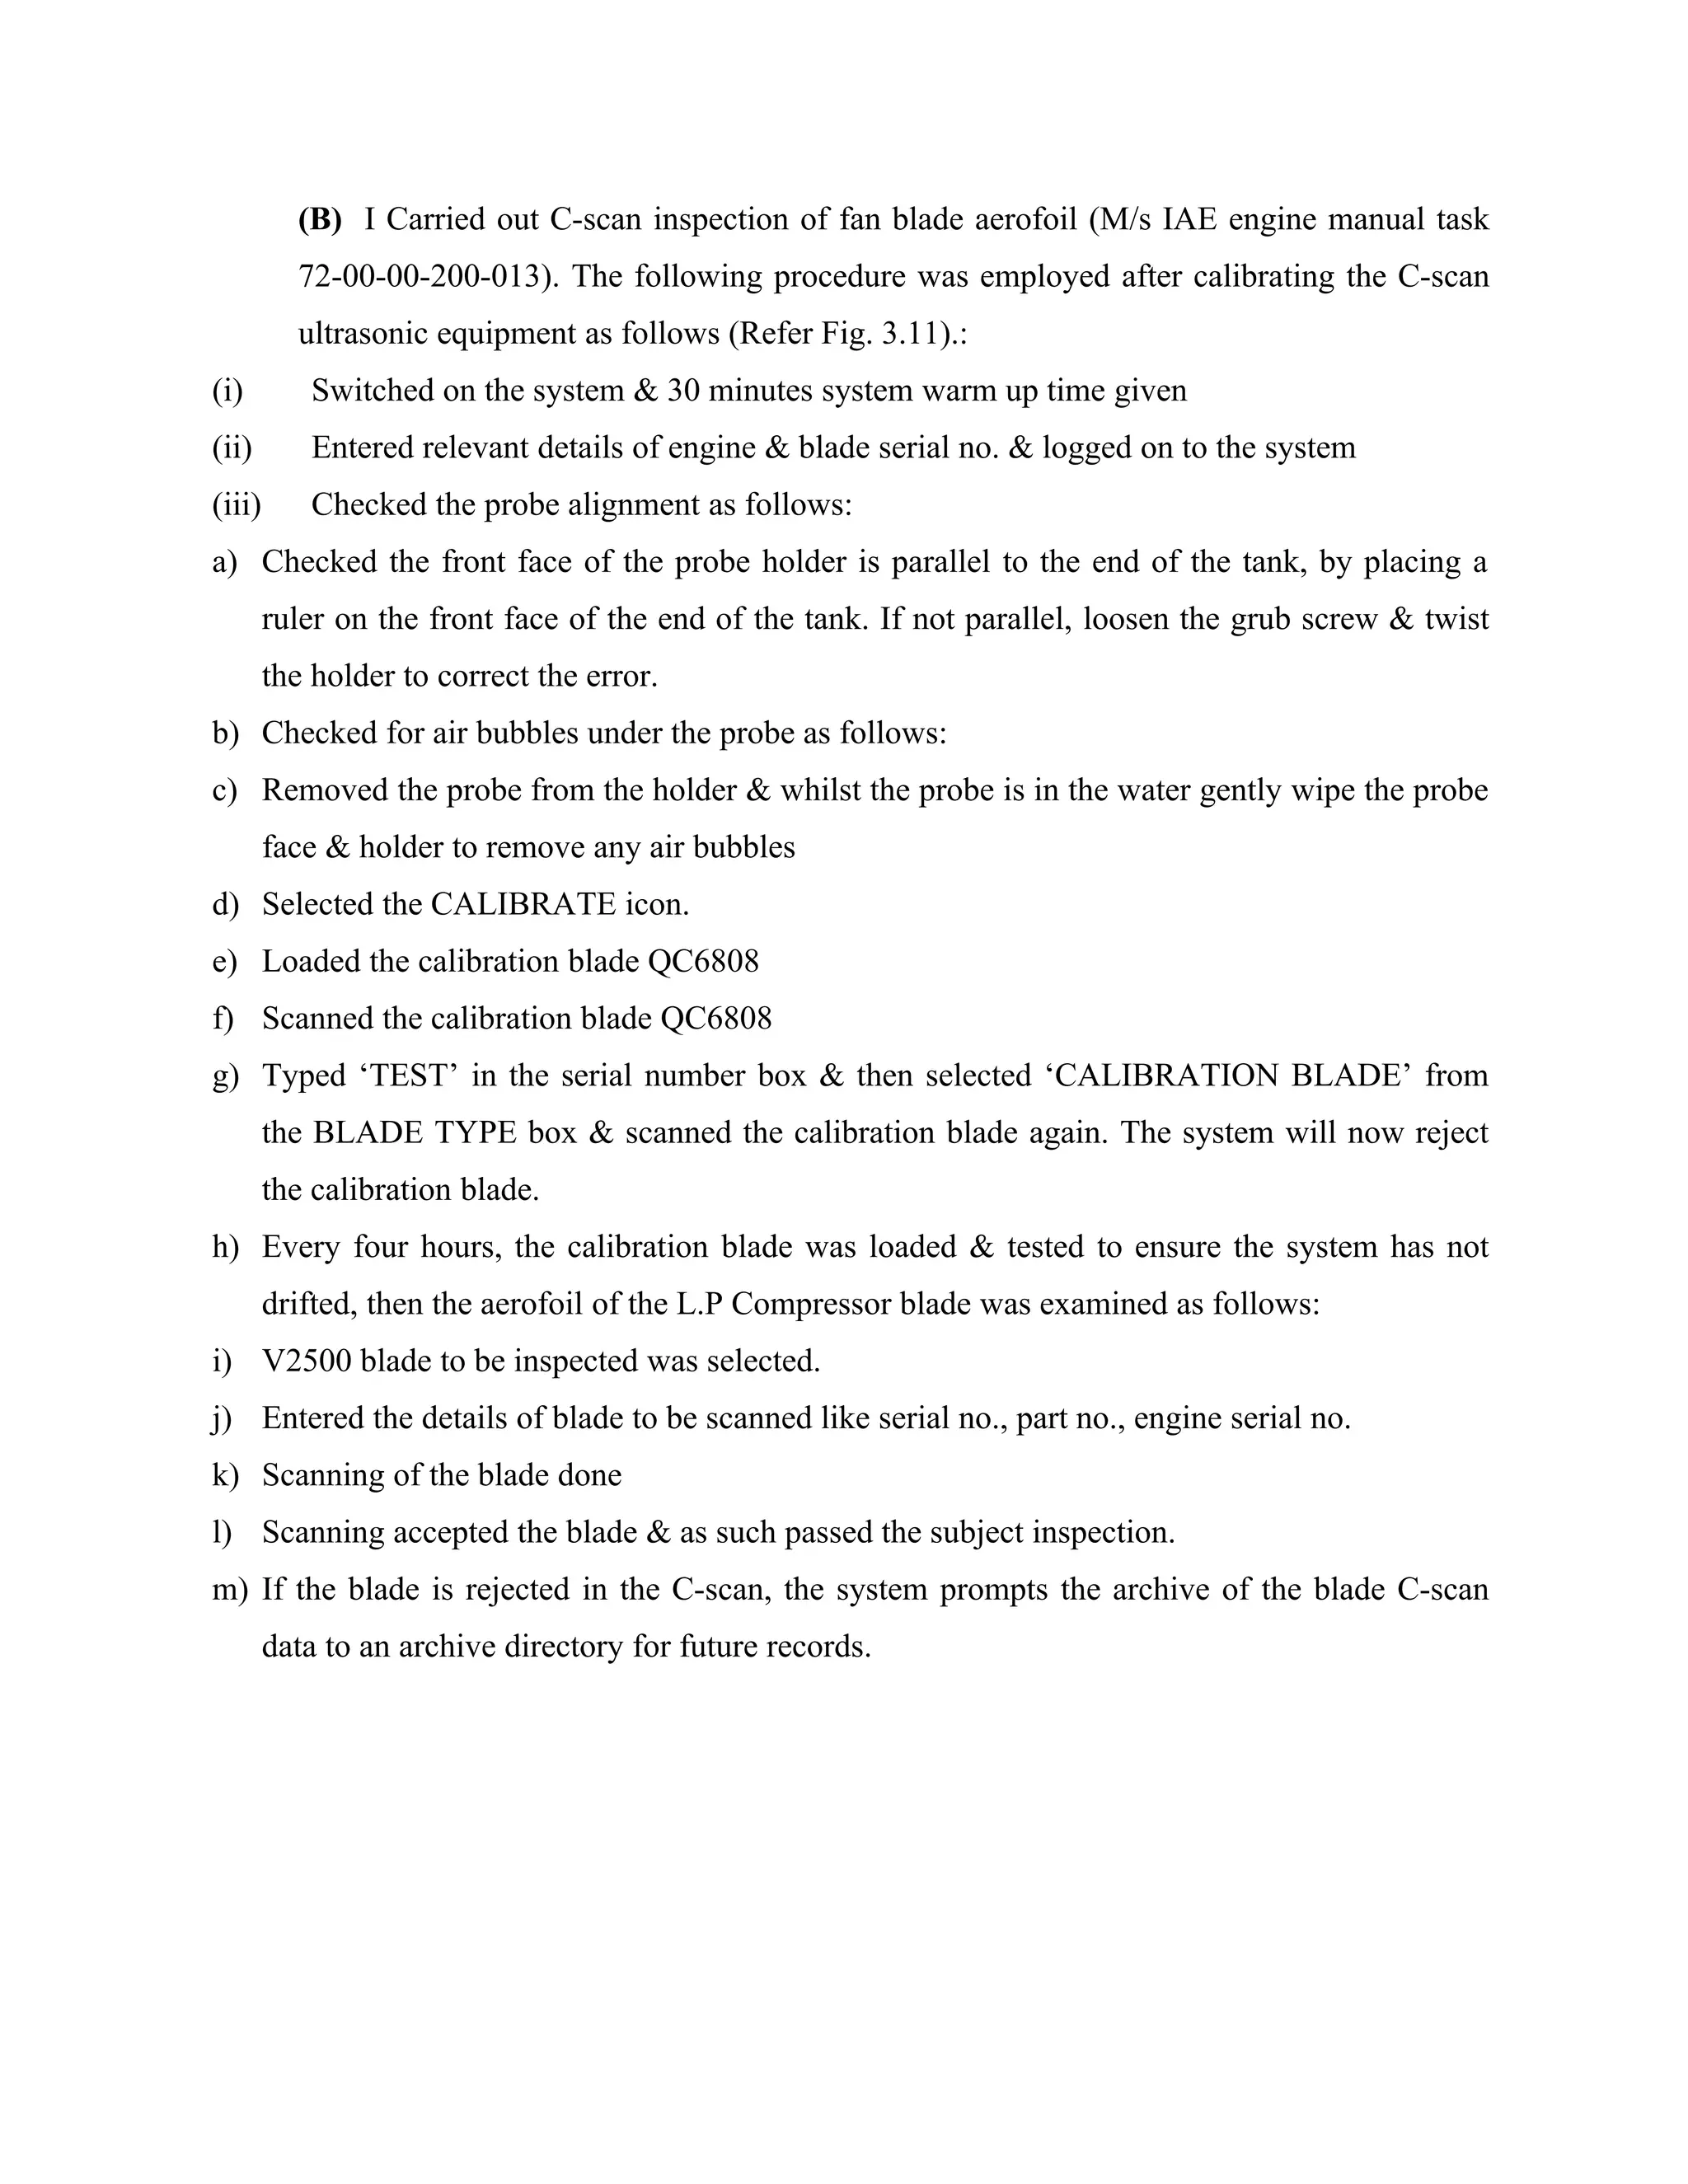
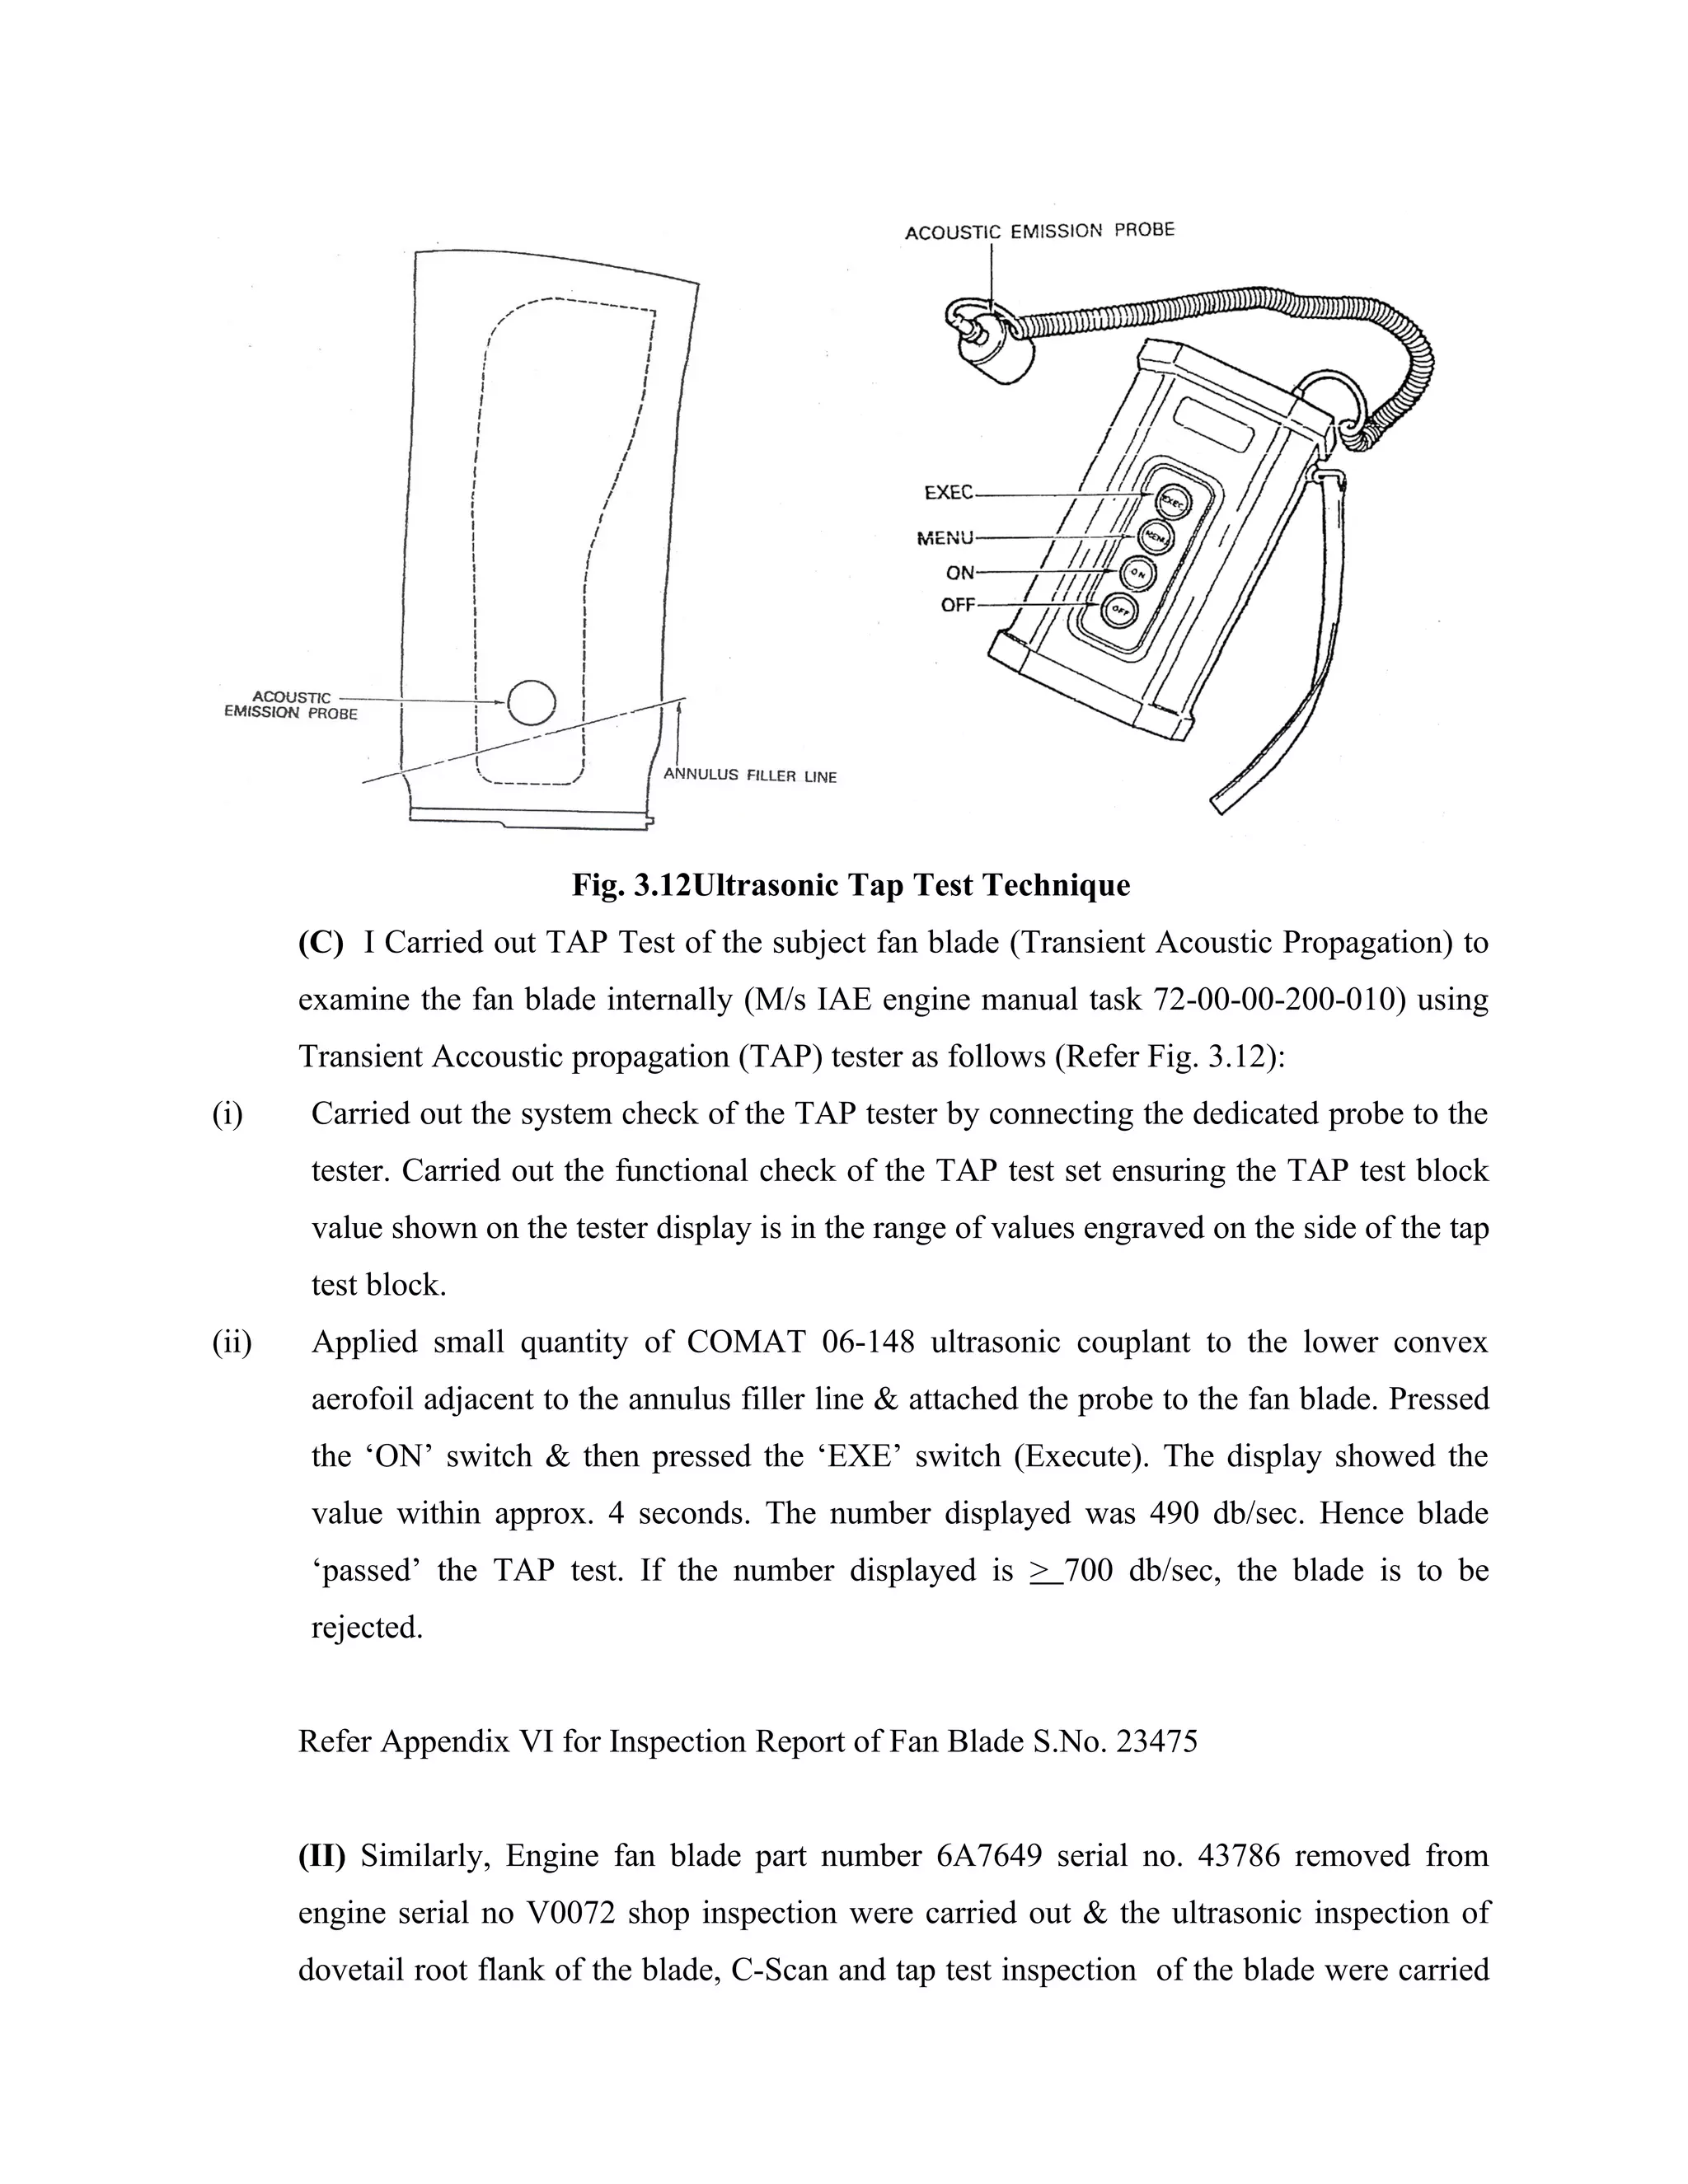
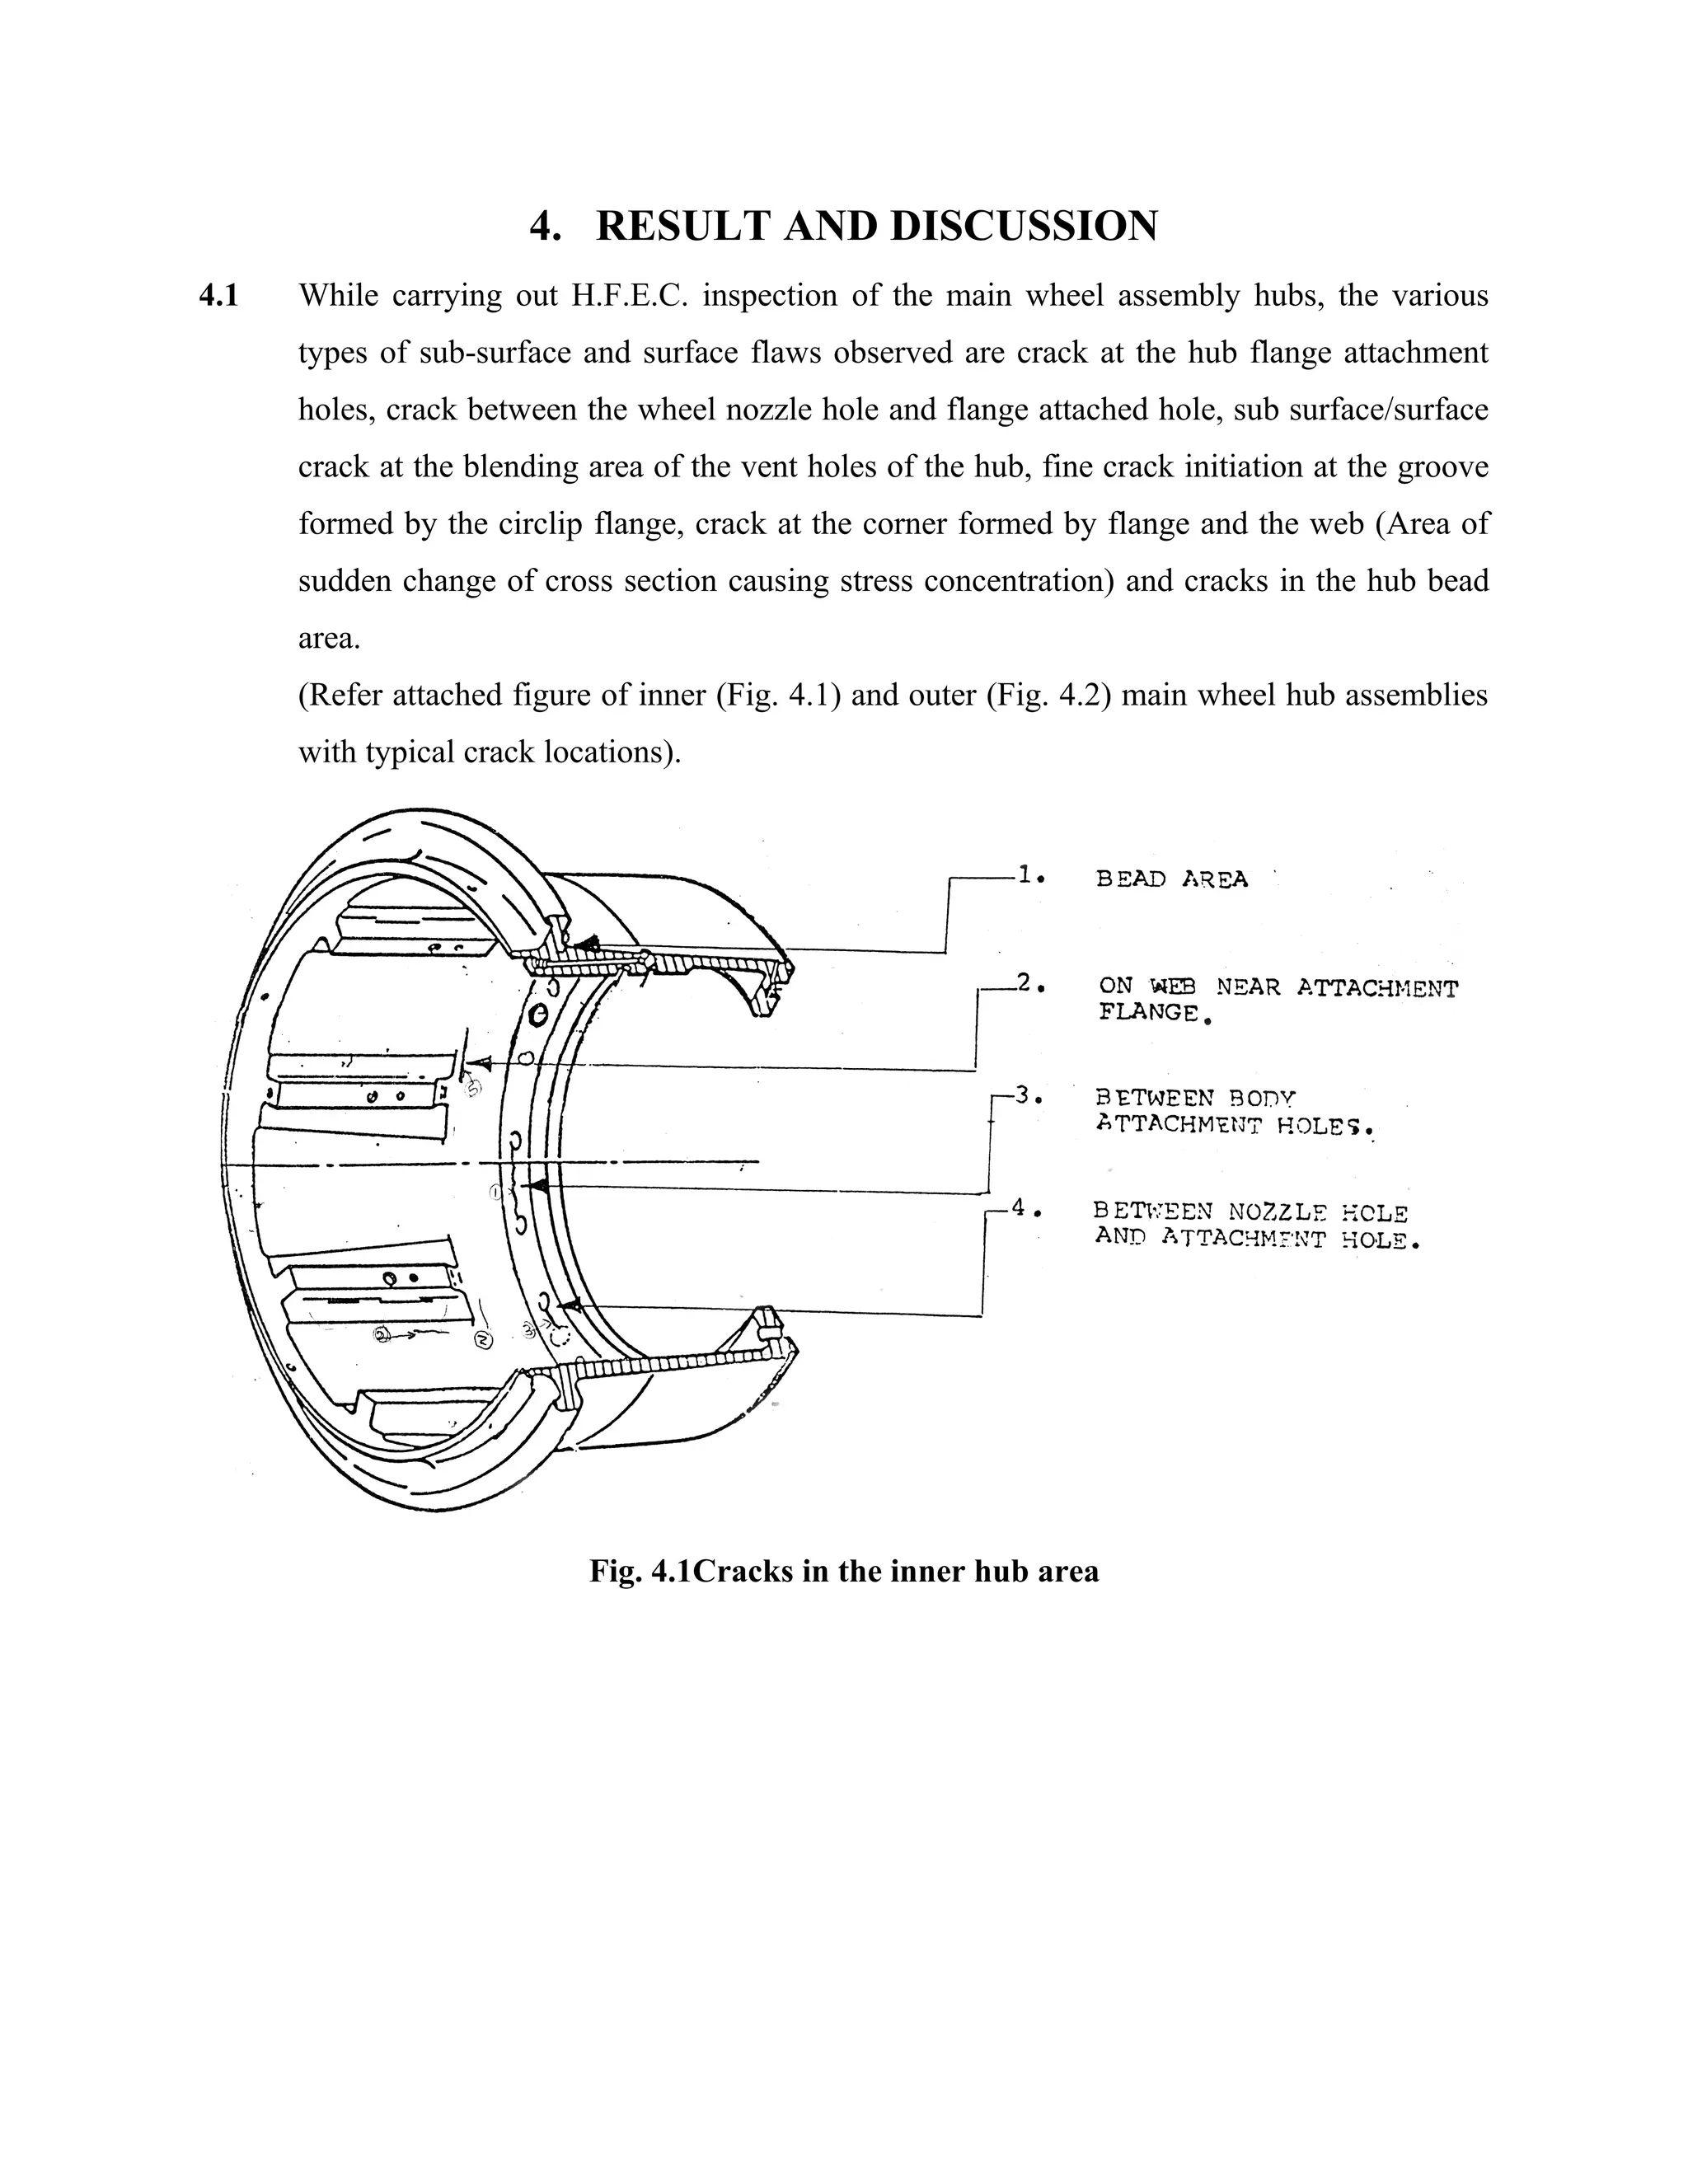
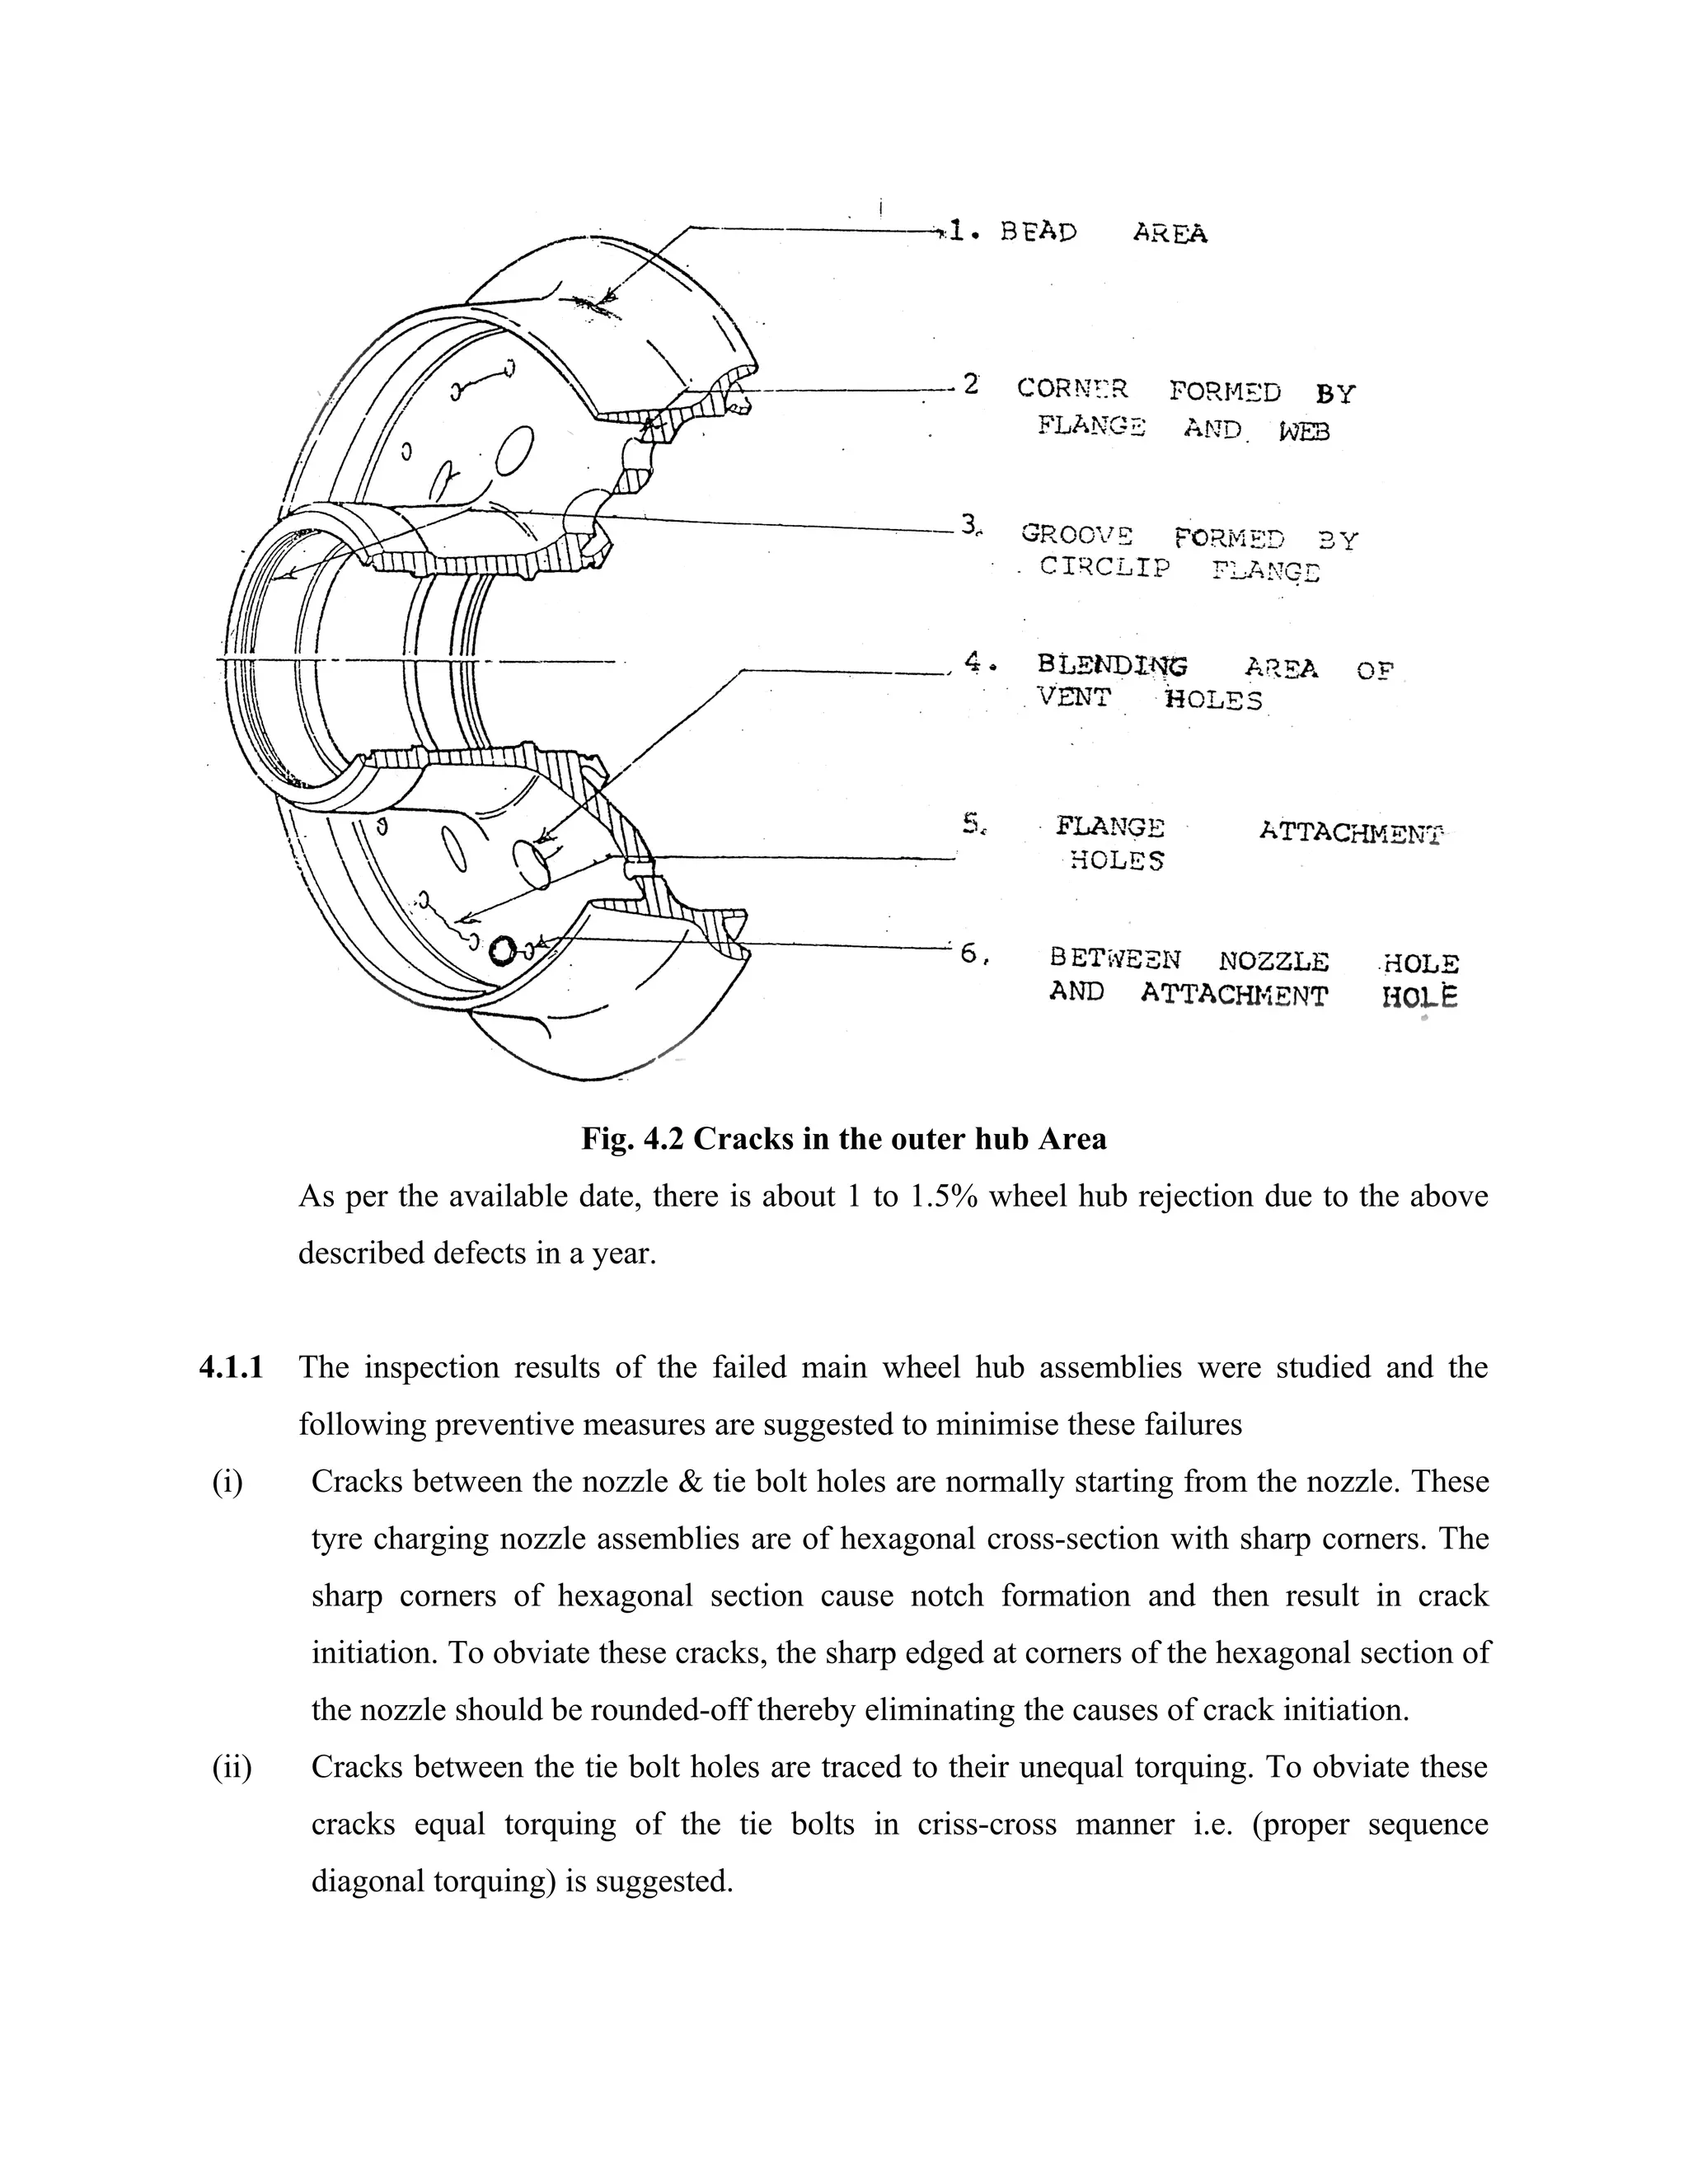
STUDY OF VARIOUS NON-DESTRUCTIVE
 TESTING TECHNIQUE & APPLICATION OF
THESE TECHNIQUES TO INSPECT AIRCRAFT
WHEEL HUBS & AERO ENGINE FAN BLADES
    & SUGGEST REMEDIAL MEASURES.
                 By
            KARAN DUGGAL

           Under the Guidance of
         Professor O.P.CHAWLA


DEPARTMENT OF MECHANICAL ENGINEERING
INSTITUTE OF TECHNOLOGY & MANAGEMENT,
           GURGAON, HARYANA
 (AFFILIATED TO M.D. UNIVERSITY, ROHTAK,
          HARYANA, MARCH 2005)
CERTIFICATE

This is to certify that the project entitled “Study of various non-destructive testing techniques and
application of these techniques to inspect aircraft wheel hubs & aircraft engine fan blades &
suggest remedial measures” is submitted by Karan Duggal as his final year major project the
work is based upon his work under the supervision of Dr. O.P. Chawla and neither his project
report nor any part of it has been submitted for any degree or any other academic award
anywhere before.


Professor O.P. Chawla
Department of Mechanical Engineering, ITM, Gurgaon.
ACKNOWLEDGEMENT

I would like to thank and express gratitude to my project guide Dr. O.P. Chawla for all his
assistance and guidance, which came forward at the advent of our difficulties and problems.
With his guidance & help and his positive approach towards furthering the problems, it would
not have been possible on my part to successfully complete this project.
I would like to express my gratitude to Sh. T.C. Sharma, Chief Manager Accessories Overhaul
Shop, Sh. R.K. Sharma, Chief Manager Jet Engine Overhaul Shop, Sh. S.N. Garg, Sh. R.K.
Arora & Sh. Vivek Inspection Engineers Accessories Overhaul & Jet Overhaul Shop, Indian
Airlines Northern Region, I.G.I. Airport Terminal II, N-Delhi. With their valuable support & on
the job practical guidance, I could succesfully complete this project. I would also like to thank all
the engineering staff of N.D.T. Section of Accessories Overhaul & Jet Overhaul Shops, Indian
Airlines, Northern Region, I.G.I Airport, Terminal II, N-Delhi for all their help and assistance
which helped me to complete this project successfully.
I also thank the college faculty and staff (Mechanical Engineering Department) for all their help
and valuable support for helping me to execute this project successfully.
ABSTRACT

The aim of the project is to study the various Non-destructive methods being used in the modern
manufacturing, overhaul & servicing industry. High Frequency Eddy Current N.D.T inspection
of A320 Airbus main wheel hub assemblies were carried out to identify the surface & subsurface
cracks in their critical areas. The problem areas were studied & remedial measures were
suggested to minimise such failures. Ultrasonic N.D.T inspection of the fan blades of M/s IAE
V2500 Turbo fan engine installed on A320 Airbus Aircraft were studied and problem area of fan
blade root flank area debonding & propagation of fine cracks was identified. This subject report
emphasizes the need to identify such defects in order to obviate in service failure of fan blade
which adversely affects the in-service reliability of the on-wing engines. The desired suggestion
emphasizes on carrying out more frequent on-wing N.D.T Inspections of these fan
blades, detailed inspection of fan blades during shop visit & overhaul of these engines
and their N.D.T inspections whenever any bird hit or F.O.D (Foreign Object Damage) is
reported or observed.
SUMMARY
The subject matter for the final year major project is the study of various non-destructive testing
techniques being used in the present manufacturing, overhaul & service industry. Also, their
important, applications, limitations, relative advantages & disadvantages were also studied.


Further, as a specific application of NDT methods, study of High Frequency Eddy Current
(H.F.E.C) inspections of A320 Airbus Aircraft main wheel Hub assemblies was carried out under
the guidance of N.D.T specialists of aircraft accessories overhaul shop, Indian Airlines, N.R. The
defects so observed were studied in depth & remedial actions suggested to minimize such
failures in future. Continuance of these defects in service without detection could result into
uncontained failure of the component endangering the safety of the aircraft in-service.


Similarly an another application of NDT methods regarding Ultrasonic Inspection of Aero
engine fan blades root flank area & its tap test was done to find out a debond or a crack in this
area to reject such a fan blade. Continuance of this defect in service could lead to fracture of the
blade from the root area causing consequent extensive internal damage to the engine and a
serious flight safety problem. To prevent such in service failure, I suggested more frequent on
wing engine fan blade root flank & tap test N.D.T Inspections during major maintenance checks
of the aircraft. These inspections during scheduled and unscheduled shop visits of the engines
were also suggested to be done scrupulously. I also suggested to carryout these NDT inspections
of fan blade whenever there is any reported or observed engine bird-strike or any time high
engine fan blade vibrations are reported.


These preventive NDT inspections in the critical areas prone to high fatigue stresses in the areas
of high stress concentration can prevent an impending failure of component/system, thereby
improving the component/system in-service reliability.
CONTENTS


Certificate
Acknowledgement
Abstract
Summary
1. INTRODUCTION
      1.1 Non-destructive testing techniques and their importance
      1.2 Application of N.D.T
      1.3 Motivation behind this project
      1.4 Consolidation of work
2    LITERATURE REVIEW
      2.1     Review of books and journals
      2.2 Different non-destructive testing techniques
              2.2.1   Visual testing technique
              2.2.2   Radiography technique
              2.2.3   Magnetic particle inspection
              2.2.4   Penetrant (Dye & inspection fluorescent) Inspection
              2.2.5   Ultrasonic inspection
              2.2.6   Eddy current inspection
     2.3      Relative advantages & disadvantages of various NDT methods.


3.    EXPERIMENTAL SETUP / SHOP TESTING
      3.1     N.D.T Inspection-High Frequency Eddy Current Inspection of main wheel hubs of
              A-320 Airbus Aircraft
              3.1.1   Instrumentation
              3.1.2   Experiments
                      3.1.2.1   Procedure and Observations
3.2   NDT Inspection-Ultrasonic Inspection of L.P. Compressor fan blade of M/s IAE
           V2500 Engine installed on A320 Aircraft
           3.2.1   Instrumentation
           3.2.2   Experiments
                   3.2.2.1   Procedure and Observations
4.   RESULTS AND DISCUSSIONS
5.   CONCLUSION
6.   REFERENCES
7.   APPENDIX
1.1 INTRODUCTION


N.D.T is the technology of assessing the soundness & acceptability of an actual component
without affecting its functional properties. Non-Destructive Testing is exactly what its name
implies i.e. testing without destroying. Therefore, N.D.T. is an examination of an object or
material in a way which will not impair its future usefulness. N.D.T. is the use of technology for
inspecting the materials to known standard. Since Non-Destructive Testing do not in any way
impair the serviceability, therefore these can be applied, if desired, on all the units produced.
Consequently, there is great reliability in the production.


1.2 APPLICATION
N.D.T. Tests are done for detecting discontinuities which might be inherent, develop during
processing or during in-service. Inherent cast discontinuities relate to inadequate feeding, gating,
excessive pouring temperature or entrapped gasses. Processing discontinuities are usually related
to various manufacturing processes such as machinery, forming, extruding, rolling, welding, heat
treating and plating. While service discontinuities relate to various in-service conditions such as
stress corrosion, fatigue & erosion etc. and are mainly due to design deficiencies, material
imperfection, processing deficiencies, assembly errors and due to in-service deterioration.


Non-destruction testing is an important part of preventive maintenance programme by
identifying a failure or an impending failure, NDT programmes help in the safety of the person,
plant & equipment and adds to the economy by preventing a major break-down. NDT is an
important tool in the present advance manufacturing, assembling, processing, overhauling and
maintenance industry and plays an important role in the development and improvement in the
end product of the company. NDT Techniques are useful in determining critical spots (weak) in
manufacturing operations right from receiving inspection to end item inspection. It helps to
establish and measure quality and acceptance limits at the various stages of manufacturing
thereby useful in development and improvement of material & process for fabrication.
NDT methods help in determining service life of the components. It is useful for failure analysis
and suggests remedial measures to prevent such failures in future. NDT is used for in-service
inspections to determine cracks due to fatigue damage/creep, corrosion damage, de-
bonding/delaminating of composite materials.
As a part of ‘On-Condition’ maintenance management programme, NDT methods are done in-
service on complicated assemblies without their disassembly & health of such critical
components is continuously monitored by carrying out these Non-destructive tests. Acceptable
parts with very high fabrication cost are not lost after testing. Since these tests are rapid, quick
and reliable, these are most suited for high rate production part when tests are to be done on
entire batch. The success of NDT method depends upon the knowledge of various type of
engineering material one comes across, the process by which the component is made of and the
probable stages at which the defect may creep-in. In Non-Destructive Testing language the word
‘defect’ is correctly applied only to a condition which will interfere with the safe or satisfactory
service of particular part in question. A discontinuity will be a defect only when it interferes with
performance of the part or material in its intended service. Non-destruction evaluation is the art
of developing NDT techniques, arriving at acceptance standard for components for which
nothing is available to start with.
The various defect/discontinuous which can be determined by different NDT Techniques include
detection of surface and Sub-Surface Cracks, Blowholes, Weld Penetration Deficiencies,
Detection of Grain Size Variations, Heat Treatment Deviations, Machining Defects, Plating
Defects, Inclusions, Pits & Porosity etc. It also helps to determine chemical composition &
thickness measurement of piping and pressure vessels.
These defects normally arise from initial production of the raw material or during conversion of
base or raw material into manufacturing components. In-service defects could arise due to
components operating under extreme conditions, inadequate preventive maintenance programme
of the components/systems or due to some external cause like F.O.D. (Foreign Object Damage)
1.3 MOTIVATION BEHIND THE PROJECT
My major objective to select “Study of various N.D.T. Techniques” as a project is due to its vast
applications in the Modern Production, Process and Maintenance Industry and to enhance my
knowledge on this subject matter due to my keen interest in aviation maintenance and overhaul
industry where N.D.T. Technique is a very important tool for preventive maintenance
management programme. Moreover this type of industrial project work will strengthen my
knowledge & confidence in the area of my choice & help me in my career growth.


1.4   CONSOLIDATION OF WORK
1.    Chapter 1 deals with Non-destructive testing techniques, their importance, applications of
      N.D.T, motivation behind this project and finally it ends with consolidation of project
      work.


2.    Chapter 2 deals with review of books, journals and manuals used for this project report.
      This report also describes about various Non-Destructive testing techniques such as Visual
      testing, Radiography, Magnetic particle inspection, Dye Penetrant Inspection, Ultrasonic
      inspection and Eddy current inspection technique. Finally, comparison of relative
      advantages & disadvantages of various NDT methods have been discussed briefly.


3.    In chapter 3 as per the reference manuals, important details of High Frequency Eddy
      Current N.D.T Inspection technique of main wheel hubs of A-320 Airbus Aircraft and
      Ultrasonic Inspection technique of turbo fan jet engines wide-cord fan blades (Titanium
      Alloy Skin with Aluminium Alloy honey comb core) have been discussed in detail. In the
      instrumentation, various important features and working of instruments viz Defectometer
      and Meccasonic used in these N.D.T techniques have been described. These details also
      include calibration procedures of these instruments.


4.    In chapter 4 results and discussions include description of various cracks/ flaws on different
      areas of main wheel hubs and turbo engine fan blade structure of A320 Airbus aircraft.
This chapter also describes about the various remedial measures suggested to minimise
     these failures for smooth engine performance and to improve the inservice reliability of
     aircraft wheel hubs.


5.   Chapter 5 conclusions mentions about importance of various N.D.T techniques being used
     in the present manufacturing, processing and maintenance industry. It also mentions about
     importance of High Frequency Eddy-Current N.D.T method on aircraft wheel hubs and
     ultrasonic inspection technique on engine fan blades to improve the components and
     system reliability.


6.   List of references used


7.   Appendix
2.      LITERATURE REVIEW
2.1   Review of books and journals
      CIVIL AVIATION AUTHORITY, UK (1) describes about Eddy Current applications,
      its principles of operations, Eddy Current tests, probes types, coil arrangements and types
      of circuits used. This leaflet gives guidance on the use of Eddy Current equipment for
      detecting cracks, corrosion and heat damage detection, for measurement of coating
      thickness or for sorting material. Elementary theory of Eddy Currents is included to show
      the variables which are being measured and to indicate interpretation of results which
      may be necessary for particular applications. This document also describes about
      advantage and limitations of this NDT techniques. It also describes how the size and
      shape of test specimen may affect these inspection results which can be overcome by
      probe design, equipment calibration, frequency selection or the use of jigs to maintain the
      probe in a particular relationship to the material surface. This document also describes in
      detail effect of frequency selected and its importance while carrying out this NDT
      inspection. It also describes about the effect of LIFT-OFF and its compensation while
      accomplishing this procedure. This leaflet also describes the details of the various types
      of probes like surface probes, hole probes, special probes and their different usage in
      Eddy Current inspection.


      CIVIL AVIATION AUTHORITY, UK (2) gives general guidance on the application
      and scope of ultrasonic sound waves for detecting surface and internal flaws in material
      and parts and for measurement of thickness. This document describes that ultrasonic
      inspection is the only satisfactory NDT method when a distant defect lies parallel with
      the only available surface of the component. It emphasizes the need for properly trained
      and qualified operator for using the ultrasonic equipment. This document describes about
      the various applications of ultrasonic methods prior to fabrication, during manufacturing
      processes, during periodic preventive maintenance checks to find out fatigue cracks and
      other defects arising from operating conditions. It describes about how the ultrasonic
      waves are produced and what is piezoelectric effect. This document describes in detail
      about various methods of operation of ultrasonic NDT techniques like Transmission
      Method, Pulse Echo Method, Immersion Testing And Resonance Technique etc,. This
document also describes about the choice of frequency for carrying out this test on
different material of different size and shape. This document emphasizes the most
important applications of ultrasonic NDT technique for its usage for in-situ examinations
and particularly for detecting corrosion damage which can be found in areas not
accessible for visual examinations. It is a useful NDT method for finding
delamination/debonding of non metallic composite material parts.


ROBERT C Mc MASTER (3) describes NDT techniques like Fluorescent Penetrant
Processes, Magnetic Flaw Detection Methods, Radiological Examination of the parts,
Electromagnetic Methods, Endoscopic Methods and Ultrasonic Methods. It describes
about the principle of operation of the particular NDT method, its application, advantages
and limitations. It also describes how these NDT methods are extensively being used in
present industries and how it will be useful in future advancement in technology.


WILLIAM E SCHALL (4) describes about the various types of flaws/ defects occuring
right from raw material to finish goods stage and how NDT techniques are useful at
various stages of production for economical, reliable and safe operation of the industry. It
defines the various types of surface and sub surface defects and appropriate NDT
technique to detect such defects. It also describes about the accuracy and limitations of
particular NDT method. It also describes about the need for proper training and
experience to become a good NDT engineer. Above all, it also mentions about the high
capital cost involved for procuring the NDT equipments and running cost involved to
keep it going.


In reference (5) EDDY CURRENT AND ULTRASONIC TESTING describes about
the elementary theory of electromagnetic induction, principles of Eddy Current and Eddy
Current Test Systems, the test frequency and distribution of Eddy Currents. This
document also mentions about various methods of Eddy Current testing and their
requirements. It also describes about various applications of electromagnetic testing and
depth of penetration of Eddy Current for various materials. Ultrasonic inspection
describes about basic characteristics of sound, principle of wave propagation and
generation of Ultrasonic waves. Various methods of Ultrasonic testing are explained in
details which includes ultrasonic test equipments-ultrasonic tester, test probes, couplants,
reference standards, scanning devices and recording systems. Effect of surface finish on
correct movement of sound waves is also described.


In reference (6) COMPONENT MAINTENANCE MANUAL, MESSIER HISPANO
BUGATI, ITALY describes in details about the inspection procedure of all the parts of
main wheel assembly which includes inner and outer hub assemblies. It specifies the need
of thorough cleaning of the parts before their detailed visual inspection and mandatory
use of 10X magnifying glass for this method of inspection. This document specifies the
type of damage and area of damage expected during this inspection such as dents, nicks,
scores, notches, corrosions or cracks. Besides it also specifies the need of carrying out
NDT inspections of the critical areas of the inner and outer hub assemblies. This
document also specifies the requirement of additional items of inspection in case of tyre
burst, tyre deflation/ overheating etc.


In reference (7) V2500 ENGINE MAINTENANCE MANUAL describes about the
general inspection of flaws, debonding and wall thickness measurements using Ultrasonic
Inspection. This document describes about the safety precautions, the equipment required
(viz High Frequency Ultrasonic Tester, Meccasonic D125 BJ or D325 BJ, 25 MHz
Focused Immersion Probe, Calibration Standard Specimen, Visual Display Units, etc,.)
for this method of N.D.T. It also decribes in details the calibration and inspection
procedure using the above test equipments. Finally, this document emphasizes the need
for proper training and experience for carrying out the above inspections and
interpretations of test results.


In reference (8) V2500 ENGINE SERVICE BULLETINES AND INSPECTION
PROCEDURES describes about following inspections/ checks of engine low pressure
compressor fan blades:-
(i)     Examination of engine fan blades internally using Transient Acoustic Propagation (TAP) tester.
        (Reference 8)
(ii)    Procedure for Ultrasonic inspection of root debond of engine low pressure compressor
        fan blades (Reference 8)..
(iii)   Procedure for the C-SCAN inspection of the engine low pressure compressor fan blades
        (Reference 8). The subject document gives in detail, the equipment and material required
        for carrying out the particular item of inspection as described above. The procedure for
        carrying out the above inspection items have been given in details. Finally the document
        describes about the analysis of results so obtained including the criterion of the
        acceptance or rejection of the part under test.
2.2     Different types of Non-Destructive testing methods:-
2.2.1   Visual Testing Technique (3)
        Visual aids can be employed to detect many types of different defects such as surface
        cracks & their orientation, weld defects, potential sources of weakness such as notches or
        misalignment and oxide film formation etc. The commonly used visual aids to detect
        these flaws are mirrors, magnifying lenses, microscopes, telescopes, enlarging projectors,
        Comparators, Boroscopes, Photoelectric Systems, Fibre Optics, Image intensifier and
        Closed Circuit Television (C.C.T.V.) etc. Some of these special visual aids are explained
        herebelow:-


(i)     Boroscope (3):-
        These are instruments designed to enable an observer to inspect inside of a narrow tube,
        bore or a chamber. These are precision built optical systems with arrangements of prisms
        and lenses to provide light with maximum efficiency.


(ii)    Fibre Optic Scanners (3):-
        Fibre optic scanning tubes are used to examine inaccessible areas & areas of dangerous
        environments. Optical fibres transmit light by the phenomenon of total internal reflection.


(iii)   Miniature C.C.T.V. (3):-
        A technique of inspection of turbine blades, turbofans, turboshafts and other components
        'In-situ' without any disassembling. Direct viewing through Boroscope inserted through
        parts in the engine assembly mounted on wing or on test rig requires prolonged
        inspection often under difficult and uncomfortable conditions. An improvement has been
        introduced of miniature C.C.T.V. camera equipment coupled with boroscope & light
        sources appropriate to the type of engine. The results may be transmitted to remote
        monitors of video recorders.
2.2.2   RADIOGRAPHY TECHNIQUES (3&4)
2.2.2.1 RADIOGRAPHY GAMMA RAY INSPECTION (3&4)
        It is projecting a three dimensional object on a plane with the help of GAMMA RAYS
        penetrating radiations resulting from disintegration of radioactive materials. Gamma-
        radiations is not in the same form as X-rays and consists of one or more discrete
        wavelengths in what is known as a 'line spectrum'. The relative intensities of each
        wavelength are always the same for a particular material. The four mostly used isotopes
        are Cobalt60, Iridium192 and Thulium170 etc. Radioactive gamma ray sources consist of
        a circular disc or cylinder of radioactive material encased in a sealed Aluminium or
        Stainless Steel Capsule. The capsule is kept in a container made of lead or deplated
        Uranium which will substantially reduce the emission of Gamma rays. This technique is
        normally used when there is lack of space or access for X-ray equipment.


2.2.2.2 RADIOGRAPHY X-RAY INSPECTION (3&4)
        This particular form of electromagnetic radiation is produced when electron travelling at
        high speed collide with matter in any form. The basic requirements for the production of
        X-rays are a source of electrons, a means of accelerating the electrons to high speed and a
        target to emit the X-rays. The X-ray tube in an evacuated chamber in which the electrons
        are derived from a filament, set in a focussing cup & heated to incandescence by a low
        voltage current, electrons are released and form 'space charge' around the filament. When
        a high potential is applied, electrons accelerate from the filament (the cathode) to the
        anode and strike the target which then emits the X-rays (refer fig 2.1 for typical circuit of
        an X-ray production set) The films used in radiography are very similar to those used in
        photography except that the emulsion covers both sides of the flexible transparent base.
        The emulsion is sensitive to X-rays, Gamma rays & light and when exposed to these
        radiations a change takes place in its physical structure. When treated with developer, a
        chemical reaction results in formation of black metallic silver which comprises of the
        image. Both the radiographic techniques are used to detect internal defects and variations,
        porosity, inclusion, cracks, lack of fusion geometry variations, corrosion damage,
        thickness measurement, determining mis-assembly and mal-alignment. It is used for the
inspection of boiler tube thinning due to corrosion or erosion in power plants, castings,
weldments, and small thin complex wrought products. It is also used to check for dis
bonding/ delamination of non metallic, electrical assemblies, composites, solid propellant
rocket motors and water entrapment in the honeycomb structures. Gamma Ray Inspection
is often used for examination of internal features of turbine engines such as the main
rotor shaft and turbine hot section inspection of Nozzle Guide vanes and rotor blades.


                 FIG 2.1   Circuit diagram of X-Ray N.D.T Technique
2.2.3   MAGNETIC PARTICLE INSPECTION (4)
        This NDT process is normally applied to homogeneous ferromagnetic materials which
        can be easily magnetized. This NDT method is suitable for detecting surface and
        subsurface cracks.
        If a component is subjected to a magnetic flux, any discontinuity in the material will
        distort the magnetic field and cause local leakage fields at the surface. Particles of
        magnetic material applied to the surface of the magnetised component will be attracted to
        the flux leakage areas and reveal the presence of the discontinuity. The sensitivity of
        magnetic flaw detection depends largely on the orientation of the defect in relation to the
        magnetic flux and is highest when the defect is at 900 to the flux path. Sensitivity is
        considerably reduced when the angle between the defect and the flux path is less than 450
        so that two tests are normally required with each component, the flux path in first test
        being at 900 to the flux path in the second test. Components of complex shape may
        require tests in several different directions.


        A component may be magnetised either by passing a current through it or by placing it in
        the magnetic circuit of a permanent magnet or electromagnet. The magnetic particles
        used to reveal defects are either in the form of a dry powder or suspended in a suitable
        liquid. They may be applied by spray, pouring or immersion depending on the type of
        component. Fluorescent inks are also used where high sensitivity is required. Inspection
        of the component, to which fluorescent inks has been applied, should be carried out under
        ultraviolet light.


        Particles of magnetic ink are attracted to flux leakage fields and these may occur at
        defects, brazed joints and heat affected zone in welds. Cracks are revealed as sharply
        defined lines on the surface of the specimen, the magnetic particles often building up into
        a ridge. So if a discontinuity is present at or near the surface, the magnetic field is
        deflected and forms a leakage field. Detection of this field by particle application forms
        the basis of this inspection. Finally, the tested component must be demagnetised after this
        NDT method is completed. This method is used for determining surface and subsurface
cracks, seams, porosity and inclusions. It is extremely sensitive for locating small tight
        cracks of ferromagnetic materials, bars forging, weldments and extrusions.


2.2.4   PENETRANT (DYE & FLUORESCENT) INSPECTION (4)
        Penetrant dye processes are used mainly for the detection of flaws in non-ferrous & non-
        magnetic ferrous alloys but may also be used for ferrous parts where magnetic flow
        detection techniques are not specified or are not possible. The processes can be divided
        into two main groups. One group involves the use of penetrants containing an
        emulsifying agent (water washable process) whilst in the other group a dye solvent has to
        be applied separately after the penetration time has elapsed if the surplus dye is to be
        removed by water wash operation. Basically, this process consist of applying a red
        penetrant dye to the surface of the part to be tested, removing after the predetermined
        time the dye which remains on the surface and then applying a developer, the purpose of
        which is to draw to the surface the dye that has entered into defects, the resultant stains
        indicating the position of the defects.


        Surface preparation is most important for this method of NDT. The surface to be tested
        must be free from oil, grease paint, rust, scale, welding flux and carbon deposit etc. The
        penetrant dye can be applied to the surface by dipping, spraying or brushing, the method
        used depending largely on the size, shape and of quantity of parts to be examined. The
        dye penetration time is normally in the range of 5 minutes to 1 hour, the smaller the
        defect the longer the time necessary. Any dye remaining on the surfaces of the parts after
        expiry of penetration time should be removed as thoroughly as possible but without
        disturbing the dye which would have found its way into any defects present. The
        developer is usually very fine absorbent white powder suspended in volatile carrier liquid
        which rapidly evaporates and the action of absorbent powder is to draw out the dye from
        the surface defects, thus indicating their position by the resulting stain. Normally, the
        position of defects will be indicated by red marks appearing on the whitened surface.
All parts with non-absorbing surfaces (forging, weldments and castings) can be subjected
        to this NDT inspection for detecting defects open to the surface in solids and essentially
        non porous materials.URRENT INSPECTION
2.2.5   ULTRASONIC INSPECTION (2&5)
2.2.5.1 BASIC CHARACTERISTICS OF SOUND (5)
(i)     Frequency, sound velocity and wave length
        How does the sound travel from an oscillating membrane (e.g. loud-speaker) as
        transmitter to our ear as receiver? The oscillating membrane excites the neighbouring air
        particles into oscillations and pressure fluctuations occur. As the air particles are not
        rigidly but elastically connected to each other, we can use balls connected by springs as a
        model (fig. 2.2). With reference (fig. 2.3) zero (1st row) balls are at rest. The oscillating
        process is started by pushing the left ball to the left, moment I. As the left ball is
        connected to the neighbouring ball by a spring the movement is slowed down up to
        moment III and finally reversed. Due to the spring connection also the second and then
        successively all other balls at the right are being moved. A wave motion develops.
        Another examination of the figure shows that each ball oscillates around its rest position
        by a certain amount, i.e. merely the condition of oscillation propagates along the direction
        of propagation, Only the energy and not the mass is transported, In the period from
        moment III to moment XV the particle has carried out one complete oscillation.


                                               Fig. 2.2
Fig. 2.3


                                         Fig. 2.4
                           Figures depicting Propagation of wave


The time required is the period of oscillation T. On the momentary representation XV we
can see that particles zero and twelve are just experiencing their max. deflection to the
left, i.e. they are in the same condition of oscillation, The distance between two particles
which are in the same condition of oscillation is the wave length λ. With reference (fig. 2.4) shows
that the condition of oscillation has propagated by the distance λ in the period T. Thus the
following formula applies to the propagation velocity c:
C=λ/T
From the period of oscillation T the number of oscillations per second can be calculated
by the formula
F=1/T
f is the frequency of the oscillation, its unit is "number of oscillation/second". The unit is
       named after the physicist H. Hertz and is abbreviated Hz.


       Thus the following formula applies to the propagation velocity of the wave:
       C=fλ = 1/T * λ
       This equation (wave equation) applies to all wave processes.


(ii)   Definition of the term ultrasound
       The frequency of a sound impression (tone) is a direct measure for the pitch of a tone.
       The higher the frequency the higher the tone. The pitch of a tone which can be received
       by the human ear has an upper limit. For young people the limit is approximately 20,000
       Hz = 20 kHz. Sound having higher frequencies is called ultrasound.
       Audible sound: f= 20 -20,000 Hz
       Ultrasound: f> 20,000 Hz = 20 kHz.
       As we have learned from the spring model an energy transport through a sound wave is
       possible only when constituent particles are connected to each other by elastic forces. In
       the case of the sound transmission from the loud-speaker to our ear, the air molecules
       serve as transmitting medium. Liquids and solid matter are also suitable media for the
       sound transmission, In the vacuum (space) no matter exists and thus no sound
       transmission is possible. The satisfactory sound conductivity of liquids and solid matter is
       nowadays technically utilised in various sectors.


2.2.5.2 PRINCIPLES OF WAVE PROPAGATION (5)
(i)    Types of Oscillations
       The sound propagation demonstrated by the spring model is possible in all media, It is
       characterized by the fact that the direction of oscillation of the particles runs along the
       direction of propagation of the wave. Thus zones with small particle distance and zones
       with large particle distance are created, Therefore, this type of wave is called
       compression wave or longitudinal wave. If we do not look at the momentary
       representation but at the dynamic process of the propagation of the longitudinal wave, we
see that the compressions and diminishing move through the test object at an unchanging
distance. The velocity at which they move is the sound velocity C L of the longitudinal
wave. This sound velocity is a matter constant, i. e. in a test object completely made of
same material it can be considered constant. e. g.
for steel:     CL= 5920 m/s
for aluminum: CL = 6300m/s
In solid matter the density is very high as compared with that of liquids and gases, i.e. the
distance between the atoms or molecules is very small. Moreover, they are arranged in a
crystal lattice and the elastic linkage forces between the atoms (molecules) are
particularly strong, Due to these two facts the sound can propagate in various ways in
solid matter. We already became acquainted with one type of wave, namely the
longitudinal wave. Another type of wave is called shear wave or transverse wave, In the
case of a transverse wave the particle oscillate vertically to the direction of propagation of
the wave. Now we look again at the spring chain. The wave is not excited into the
direction of the chain but in cross direction. The springs pull the balls back into their
starting position but due to their movement they oscillate over their rest position. At the
same time these transverse oscillations are transmitted to the two neighbouring balls
which also start oscillating, These oscillations are continued to be transmitted to the
neighbouring balls due to the spring connections.


Looking at the dynamic process of the wave train, we find out that both wave crests and
wave toughs move through the test object at an unchanging distance. The distance
between two neighbouring wave crests is the wave length. The energy trasmission of the
transverse wave is lower due to the transverse oscillation of the atoms than that of the
longitudinal wave. Therefore the propagation velocity of the transverse wave is
considerably lower than that of the longitudinal wave, e.g.
Steel: CL = 5920 m/s
      CT = 3250 m/s
The velocity of the transverse wave, too, is a matter constant which is characteristic for
the corresponding work piece.
Longitudinal and transverse waves can propagate only through the whole volume of a
      workpiece. At the interfaces or surfaces of the work pieces further types of waves may
      occur. The surface wave or Rayleigh wave propagates only at the surface of the
      workpiece.


2.2.5.3. GENERATION OF ULTRASONIC WAVES (5)


(i)    Piezoelectricity
       Ultrasonic transmitters and receivers are mainly made from small plates cut from
       certain crystals (piezoelectric crystals) as shown in (fig. 2.5). If no external forces act
       upon such a small plate electric charges are arranged in a certain crystal symmetry and
       thus compensate each other. Due to external pressure the thickness of the small plate is
       changed and thus the symmetry of the charge. An electric field develops and at the
       silver-coated faces of the crystal, voltage can be tapped off. This effect is called direct
       piezoelectric effect. Pressure fluctuations and thus also sound waves are directly
       converted into electric voltage variations by this effect : the small plate serves as
       receiver. The direct piezoelectrical effect is reversible (reciprocal piezoelectrical
       effect). If voltage is applied to the contact face of the crystal the thickness of the small
       plate changes according to the polarity of the voltage the plate becomes thicker or
       thinner. Due to an applied high – frequency a.c. voltage the crystal oscillates at the
       frequency of the a.c. voltage. A short voltage pulse of less than 1/1 000,000 second (1
       second) and a voltage of 300-1000 V excites the crystal into oscillations at its natural
       frequency (resonance) which depends on the thickness and the material of the small
       plate. The thinner the crystal the higher its resonance frequency. Therefore it is possible
       to generate an ultrasonic signal with a defined primary frequency. The thickness of the
       crystal is calculated from the required resonance frequency f0 according to the
       following formula:
       d= λ/2 = c/2f0
c=sound velocity of the crystal
f0=resonance frequency of the crystal
d=thickness of the crystal
λ=wave length


                                Fig. 2.5 Piezoelectric Crystals
A piezoelectric crystal occuring naturally is the quartz (rock crystal) which was used as
crystal material in the beginning of ultrasonic testing. Depending on whether
longitudinal waves or transverse waves are to be generated the quartz plates have either
been saved vertically to the X-axis of the crystal (X-cut) or vertically to the Y-axis (Y-
cut) out of the rock crystal.
In modern probes quartz is hardly used, instead sintered ceramics or artificially
produced crystals are employed. The most important material for ultrasonic crystal as
well as their characteristics are stated in the Table 2.1 below :
                                Lead zirconate Barium Lead             Lithium    Quart Lithium
                                titanate        titanate metaniobate   sulphate   z          niobate
 sound velocity                 4000            5100     3300          5460       5740       7320
 acoustic impedance             30              27       20.5          11.2       15.2       34
 z 106 kg/m2
 electromechanic                0.6 – 0.7       0.45     0.4           0.38       0.1        0.2
 coupling factor k
 piezoelectric modulus d        150-593         125-19   85            15         2.3        6
 (Transmission/generatio                        0
 n)
 piezoelectric                  1.8 – 4.6       1.1–     1.9           8.2        4.9        6.7
 deformation constant H                         1.6
coupling    factor    for 0.5 – 0.6          0.3       0.07          0           0.1        -
           radial oscillations kp
                    Table 2.1 Characteristics of various ultrasonic crystals


          The efficiency during the conversion from electrical into mechanical energy and vice
          versa differs according to the crystal material used.
          The corresponding features are characterised by the piezoelectric constants and the
          coupling factor. The constant d (piezoelectric modulus) is a measure for the quality of
          the crystal material as ultrasonic transmitter. The constant H (piezoelectric deformation
          constant) is a measure for the quality as receiver. The table shows that lead zirconate-
          titanate has the best transmitter characteristics and lithium sulphate the best receiver
          characteristics. The constant k (theoretical value) shows the efficiency for the
          conversion of electric voltage into mechanical displacement and vice versa. This value
          is important for the pulse echo operation as the crystal acts as transmitter and receiver.
          Here the values for lead zirconate-titanate, barium-titanate and lead meta niobate lie in
          a comparable order. As in the case of direct contact as well as immersion testing a
          liquid couplant with low acoustic impedance z is required the crystal material should
          have an acoustic impedance of the same order in order to be able to transmit as much
          sound energy as possible. Thus the best solution would be to use lead meta-niobate and
          lithium sulphate as they have the lowest acoustic impedance. A satisfactory resolution
          power requires that the constant kp (coupling factor for radial oscillations) is as low as
          possible. kp is a measure for the appearance of disturbing radial oscillation which
          widen the signals. From this point of view lead meta-niobate and lithium sulphate are
          the best crystal materials. The characteristics of the crystal materials described here
          show that no ideal crystal material exists. As lithium sulphate presents additional
          difficulties due to its water solubility the most common materials are lead zirconate-
          titanate, barium-titanate and lead meta-niobate.


2.2.5.4   Set-up of the probe (5)
For the practical application in the material testing, probes are used into which the
          piezoelectric crystal are installed. In order to protect the crystals against damage they
          are pasted on a plane-parallel or wedge-shaped plastic delay block; the shape of the
          delay block depends on whether the sound wave is to be transmitted perpendicularly or
          angularly into the workpiece to be tested. The rear of the crystal is closely connected
          with the damping element which dampens the natural oscillations of the crystal as
          quickly as possible.
          In this way the short pulses required for the pulse echo method are generated. The unit
          comprising crystal, delay block and damping element are installed into a robust plastic
          or metal housing and the crystal contacts are connected with the connector socket.
          Probes transmitting and receiving the sound pulses perpendicularly to the surface of the
          workpiece are called normal beam probes or straight beam probes. If the crystal is
          equipped with a wedge-shaped delay block an angle beam probe is concerned which
          transmits/receives the sound pulses at a fixed probe angle into/from the workpiece to be
          tested. In both probe types the crystal serves for the both the transmission and reception
          of the sound pulses. A third probe type comprises two electrically and acoustically
          separated crystal units of which one only transmits and the other receives the sound
          pulses. This probe is called Transmitter-Receiver Probe or twin crystal probe (fig 2.6).
          Due to its design and functioning, it is used for the testing of this material or detection
          of material flaws located near the surface of the workpiece.


                                  Fig. 2.6 Twin Crystal Probe


2.2.5.5   ULTRASONIC TEST EQUIPMENT (5)
(i)   Principle of the ultrasonic test instrument
      So far we know that, with the probe, we can transmit ultrasonic pulses into the
      workpiece. If this has two plane-parallel surfaces, the sound pulse will be reflected on
      the surface opposite to the probe and return to it.
      Our interest concerns the measurement of the pulse transit time.
      This time is too short to be measured mechanically. We therefore use a cathode ray
      tube or Braun tube as measuring instrument. The Braun tube contains a heater coil
      which brings the cathode K to glow whereby the so “eveporating” electrons are
      accelerated by a voltage between between cathode K and anode A. The result is an
      electron beam. The voltage at the wehnelt cylinder W focuses the electron beam and so
      makes it appear on the fluorescent screen F as a light spot. As the electrons travel to the
      CRT-screen, they pass two pairs of deflecting plates which are arranged
      perpendicularly to each other. If one applies a voltage to the horizontally orientated pair
      of plates then the electron beam will be reflected vertically. Analogue to this, the
      vertically oriented pair of plates serves for the horizontal deflection.
(a)   A-scan representation
      The standard application of the pulse echo method normally uses ultrasonic flaw
      detectors having a CRT-screen with A-scan representation. The A-screen shows the
      amplitudes of the echo signals in the vertical Y direction and the distance of the
      corresponding reflectors are represented in the horizontal X-direction.
      This allows a direct allocation between the echoes on the screen and the depths of the
      associated reflectors.
(b)   B-scan representation
      Especially for semi or fully automatic tests, the ultrasonic testing technique uses special
      instruments which allow a special type of displaying the test results. Instruments with
      B-scan representation display a cross-section of the test object on the screen after the
      probe has been moved on a scanning track running across the test object. The probe
      movement is mostly displayed in the X-direction while the distance of occurring
      reflectors is displayed in the Y-direction.


(c)   C-scan representation
If the whole volume of a workpiece is to be covered it is necessary to scan at least one
          surface completely. E.g. an automatic plate testing machine scans the whole plate using
          a great number of probes and a measuring scanning track. The test results can then be
          displayed by the C-scan representation for which one normally uses an X-Y recorder or
          a printer. The workpiece is represented in a top view in which the flaw locations can
          then be marked true-to-scale. The use of printer allows the indication of further
          information (e.g. the depths of reflectors, echo amplitudes) by means of various
          symbols.


                                         Fig. 2.7 C-Scan
2.2.5.6   Monitor function
          In a case of a manual test using an Ultrasonic Flaw Detector, the operator scans the
          workpiece with the probe and simultaneously observes the CRT-screen thereby
          concentrating on echo indications which originate from the interior of workpiece or, in
          other words, from the flaw expectancy range. The start and end of the flaw expectancy
          range can be there by be marked by means of a step on the base line of the screen or an
          additionally displayed bar on the screen. If now an echo appears within this range then
          this releases a visible and/or audible alarm signal. The response threshold of the
          monitor is also variable so that an echo indication only releases the alarm when it has
          reached a certain height.
          In addition to the monitor function, most of these instruments have a control output
          which can be used to further process the information.
As soon as an echo appears within the monitor threshold, a voltage is fed to the control
          output which is proportional to the echo height and which can be immediately used for
          automatic recording. By means of this monitor function together with a path pick-up
          which is fixed onto the probe, C-scans of workpieces can be easily printed on an X-Y
          recorder. They can be regarded as test reports and filed.


2.2.5.7   Test mechanism (5) (Fig. 2.8)
          All cases where continuously large amounts of equal parts are tested are suitable for
          automatic testing machines. These consist essentially of one or several probes which
          are coupled to the test specimen by a control unit and are moved across the test object
          according to a predetermined scanning pattern. The ultrasonic signals are processed by
          the evaluation unit (e.g. an ultrasonic flaw detector) and displayed on a CRT-screen if
          available. All measured data are fed to a computer where they are further processed and
          evaluated. At the same time information about the probe position is also fed to the
          computer. The test report is produced by means of a printer. The computer controls
          additionally the marking and sorting device which marks the flaw locations on test
          objects. Test objects which have unacceptable flaws are rejected. A further task of the
          computer is to control the transport of the workpiece and to signal defined test
          conditions.
Fig. 2.8 Automatic Ultrasonic testing machines (Block diagram)


2.2.5.7   METHODS OF ULTRASONIC TESTING (5)


                  Fig. 2.9 Block diagram of ultrasonic testing technique

          Today, Non-destructive ultrasonic testing is applied. on a great variety of materials of
          different processing conditions and geometries. Refer Fig. 2.9 for a typical setup for
          ultrasonic test set.
In order to test a certain workpiece for certain flaws it is not only important to choose a
        suitable probe but also the right testing method.
(i)    Direct contact testing
        Almost all non-automatic tests employ direct coupling, i.e. The operator moves the
        probe manually in direct contact over the surface of the test object. The acoustic
        coupling agent are oil, water, glycerine, wall paper glue, etc,.
(ii)    Straight-beam testing
        If a probe, which contains an X-cut crystal, is coupled to a workpiece a longitudinal
        wave pulse will be generated and transmitted into the workpiece. Straight-beam probes
        transmit the sound pulse perpendicular to the surface of the workpiece into the material
        (Refer Fig. 2.10). If the pulse that passes through the workpiece has plane-parallel
        surfaces then the reflected pulse returns to the probe and generates a signal (backwall
        echo) on the CRT-screen of the instrument. Only a small portion of the reflected pulse
        returns to the probe itself while the greater portion is reflected on the surface and passes
        through the workpiece a second time. This generates further backwall echoes on the
        CRT-screen.


        The speed at which the electron beam travels across the CRT-screen from the left to the
        right is set in accordance with a defined proportion to the sound velocity of the
        workpiece. If this proportion is known then the thickness of the workpiece can be
        directly read off by the distance between two sequential backwall echoes on the CRT-
        screen (Refer Fig. 2.11). To be able to set the above speed ratio the instrument must be
        calibrated.


                        Fig. 2.10 Normal & Alternate Transmission Technique
Fig. 2.11 Pulse Echo Technique


(a) Calibration:
         By means of the calibration it is possible to allocate the whole width of the CRT-screen
         to a defined distance range in the material to be tested. This distance range is
         designated the test range. For the calibration we use a plane-parallel calibration block
         which has a known thickness and must be made of the same material as the test object.


(iii)   Locating- reflectors:
         To test the workpiece we couple the probe onto its surface. If we have chosen a suitable
         test range we should now obtain the first backwall echo on the screen. If the first
         backwall echo is preceded by another echo then this echo comes from a reflector in the
         workpiece. For the evaluation we only use that range before the first backwall echo
         because in the range behind it secondary echoes may occur due to split transverse
         waves thus simulating a reflector in the workpiece.
         The operator's task is now to exactly determine the location of the reflector. By slightly
         moving the probe on the surface of the workpiece the reflector echo can be optimised
         (or maximised). At the probe position with the highest echo amplitude the reflector
         stands exactly on the central axis of the sound beam, i.e. perpendicular under the centre
         point of the probe. The last step is to determine the exact depth position of the reflector.
         The sound beam should strike reflectors perpendicularly


         If this condition is fulfilled the result will be a maximum echo.
Using a straight-beam probe it is impossible to detect reflectors which run inclined or
       perpendicular to the surface because the sound is not directly reflected to the probe.


       To be able to detect and evaluate this type of flaw one uses angle-beam probes.


       To transmit ultrasonic pulses inclined to the surface we glue an X-cut crystal, which
       generates longitudinal waves, onto a wedge-shaped perspex delay block. That sound
       portion which is reflected by the sole of the probe strikes a damping element which
       absorbs this unwanted sound portion. At the interface of the perspex wedge to the
       workpiece, the sound waves are refracted which may also cause a splitting of transverse
       waves so that, in this case, there can be two types of waves in the workpiece, namely
       longitudinal and transverse waves.
       Both of these two wave types are converted again into a longitudinal wave as they
       return to the probe. That means, every echo returning to the probe, regardless from
       which type of wave it originates, is always received by the crystal as a longitudinal
       wave echo so that it is impossible to decide whether it comes from a transverse or a
       longitudinal wave. However, due to this it would then also be impossible to locate a
       reflector since both types of wave propagate in the material in different directions and
       at different velocities.


       We therefore use a constructive trick to ensure that only one type of wave may occur in
       the testpiece. We choose an angle of incidence for the longitudinal wave in the probe so
       large that a longitudinal wave can no longer occur in steel where by βL is greater than
       90° (total reflection).


(iv)   Testing with twin crystal probes (TR technique)
       Straight-beam and angle-beam probes are equipped with only one crystal which has
       both the transmitting and receiving function. Depending on the length of the delay line,
       this has the effect that the initial pulse is displayed either fully or partially on the CRT-
       screen, and, consequently, echoes from near-surface flaws are not definitely traceable
       (dead zone, initial pulse influential zone). In practical testing, however, we often meet
with situations were we have to test thin parts or where especially near-surface flaws
are to be detected. In these cases, we use a probe with 2 crystal units which are
electrically and acoustically separated, i.e. one only transmits sound pulses and the
other one has only a receiver function.


Each TR Probe crystal unit consists of a perspex delay line having the shape of a semi-
cylinder. The crystal, which is semi-circular, is bonded to the delay line. Both crystal
units, separated from each other by an acoustic separation layer, are built into a probe
housing and are connected with 2 electrically separated sockets. An additional increase
in sensitivity within the near-surface zone is attained by a slight inclination of the
crystals towards each other. This angle of inclination, which we also call roof angle,
varies in size from 00 to approx. 120 depending on the purpose of application and probe.
If we wish to operate a TR probe in connection with an ULTRASONIC FLAW
DETECTOR then the instrument must be switched to TR-operation (twin crystal
operation). At one connection socket stands the initial pulse and at the other connection
socket is the input of the amplifier (receiver). The ultrasonic pulses are generated in
transmitter part of the probe and transmitted into the delay line. Echoes from the delay
line, however, are not displayed on the CRT-screen due to the fact that the transmitter
crystal has no receiving function. If we now couple the probe onto a plane parallel plate
we then receive an echo because the sound pulse, being reflected on the backwall, is
directed into the receiver part of the probe.


The remaining wall thickness measurement on tubes and containers which are exposed
to corrosion or erosion is one of the principal fields of application: The main advantage
is the fact that the installations or plants to be tested do not need to be put out of
operation and therefore no standstill losses will occur. The measuring accuracy is 1/10
mm with wall thickness from 0.5 mm onwards and measurements are possible on
systems which have temperatures of up to approx. 5000 C.
Twin crystal probes are often operated in combination with digital wall thickness gages.
       After coupling the probe a digital display indicates directly the wall thickness in mm, or
       inch.


       Due to the high sensitivity of twin crystal probes regarding the near-surface zone they
       are also suitable to trace very small flaw locations from a depth of approx. 0.6 mm.
       Twin crystal probes arc therefore employed for flaw detection on thin parts.


(v)    Through transmission
       The through transmission technique is the oldest method applied in ultrasonic testing.
       One probe is used to transmit sound into the test object and the other side receives it.
       Using this method we compare the sound intensity from a flaw-free zone with that from
       a flawed zone. A flaw in the sound field shades a portion of the sound energy off, so
       that the intensity measured at the receiver is lower as compared with a flaw-free zone.


       A disadvantage of this method is that no statement can be made regarding the depth and
       the extension of the flaw. Despite this disadvantage, the through transmission method is
       still in use, mainly for testing thin plates or saucer type test objects which are accessible
       on both sides and have flat flaws extending parallel to the surface. This concerns
       mainly plates of whole thickness range which have laminar defects, and short tubular
       bodies such as bearing bushes, laminated plastics and platting. To avoid high coupling
       variations these objects are normally tested in the immersion technique.
       If the test objects are not accessible on both sides but have plane-parallel surfaces, one
       can also employ the V-through transmission or make use of the lamb wave
       transmission.
(vi)   Immersion technique
       With the immersion technique (Fig. 2.12) both the testpiece and the probe are totally
       immersed in water. This guarantees a continuously good coupling effect. As a rule we
       use water to which we admix an anticorrosion agent, fungicides as well as an additive
       to reduce the surface tension of the water. The water should stand for a longer time to
       de-aerate, i.e. to reduce disturbing air bubbles to a minimum. The immersion type
probes differ from the straight-beam probes for direct contact only insofar that they are
        watertight moulded including the cable connection.
        The probes are mounted in a holder so that they are oriented perpendicular to the testing
        surface. Between the probe and the surface of the workpiece is a water delay line which
        has a defined length.


                     Fig. 2.12 Immersion Testing Technique


(vii)   Resonance Method
        All technique described before arc based on the pulse echo method. A continuous
        ultrasonic wave, however, can also be used in non-destructive testing.
        A continuous ultrasonic wave which is transmitted into a plane parallel plate can excite
        natural oscillations of the plate. A pre requirement for this is that the plate can freely
        oscillate on either side, i.e. on both sides of the plate must be a medium with small
        acoustical impedance.
Fig. 2.13 Standing Wave

The ultrasonic wave is reflected on both interfaces thus traveling through the plate in
two different directions whereby the forward wave and the reflected wave superimpose
each other. Depending on the wave length in relation to the plate thickness amounts
exactly to a multiple of the half wave length. In this case the wave crests of the forward
wave meet the wave crests of the reflected wave and a standing wave develops (Refer
Fig. 2.13). Such a wave is characterised by the fact that inside the plate there are
locations where the particles are always stationary while on other locations the particles
always oscillate with the maximum amplitude. Those frequencies which generate
standing waves in the plate are designated natural frequencies of the plate. If the plate is
excited in one of its natural frequencies then we refer to resonance vibration of the
plate. For the detection of flaws the resonance method is difficult to apply. In addition,
the flaws must have a surface of ¼ or ½ of the crystal surface in order to be detectable
at all. The described disadvantages of this method are the reason why the resonance
techniques were replaced by the pulse echo method.
2.2.6     EDDY CURRENT INSPECTION TECHNIQUES (1&5)
2.2.6.1   PRINCIPLES OF EDDY CURRENT (5)
          Eddy Current and Its Properties
When magnetic flux through a conductor changes, induced currents are set up in closed paths on
          the surface of the conductor. These currents are in a direction perpendicular to the
          magnetic flux and are called “Eddy Current”, Figure given below illustrate this.


                                   Fig. 2.14 Eddy Current

          Basic arrangement for producing Eddy Current in a conducting material is shown in
          Figure given below:


                                 Fig. 2.15 Generation of Eddy Current
          When an alternating current is passed through a coil, an electromagnetic field is set up
          around it. The direction of magnetic field changes with each cycle of alternating
          current.


If a conductor is brought near this field, eddy currents are induced in it. The direction of eddy
          current changes with the change in direction of magnetic flux during the cycle of
          alternating current.
The induced eddy current produces its own magnetic field (or flux) in a direction
          opposite to the inducing primary magnetic field. The secondary magnetic field due to
          eddy currents interacts with the primary magnetic field and changes the overall
          magnetic field and magnitude of the current flowing through the coil. In other words,
          the impedance of the coil is altered due to influence of eddy current. During non-
          destructive testing, using eddy current, change in impedance is displayed either on a
          meter or on a cathode ray tube screen.


2.2.6.2   FACTORS AFFECTING EDDY CURRENT (5)
          The magnitude and distribution of eddy current in a given conductor is influenced by
          conductivity of the material, the magnitude of primary magnetic field of the coil,
          Permeability of the conductor, Geometrical variations of the part, In homogeneities and
          discontinuities, Test frequency and Skin effect. Some of these important factors are
          discussed herebelow:-
(i)       Effect of Geometrical variation of the part:
The shape, thickness and presence of conducting materials in close proximity of the part affect
          distribution of eddy current and associated magnetic field.


          Edges, corners and radii, obstruct the circular pattern of eddy current. This limits the
          volume of eddy current and changes the magnitude and distribution of eddy current and
          consequently the associated magnetic field is also effected. This is called ‘edge effect’.
(ii)     Effect of in homogeneities and discontinuities:
The inhomogeneities and discontinuities like cracks, inclusions, voids, etc. in conducting
         materials also effect the circular pattern of eddy current and its associated magnetic
         field, fig. below illustrates the effect of inhomogeneities / discontinuities on
         distribution of eddy current.


(iii)    Effect of magnetic coupling:-
Magnetic coupling refers to the interaction of varying magnetic field of the test coil with the
         test object. The effect of the primary magnetic field of the coil in inducing eddy
         current on the surface of a conductor is strongly influenced by the distance of the
         test coil from the surface of the conductor. This effect is illustrated in fig. below.


                Effect of Discontinuity of                   Effect of distance of test
                      Eddy Current                              Coil from the part
                                             Fig. 2.16

         Coupling is said to be effective when the distance of separation of the coil from the
         test object is small, it is said to be poor when the distance of separation between the
         test coil and test object is large. It is easy to realize that coupling is influenced by
         configuration and geometry of the test object, Surface condition and Coating on the
         surface of the test object
(iv)   Effect of Test Frequency:

       The magnitude of induced eddy current in an object increases with frequency of
       the inducing magnetic field, it has been observed that higher intensity of eddy
       current results in stronger secondary magnetic field opposing the primary
       magnetic field. This results in low depth of penetration of eddy current as in
       case of high conductivity or higher magnetic permeability of the test object as
       shown in Fig. Eddy current concentration is found to be greater at the surface of
       conductor and decreases as the depth increases. As the frequency of
       magnetizing field increases. As the frequency of magnetizing field increases,
       the concentration of eddy current near the surface also increases and depth of
       penetration decreases. Increasing magnetic permeability and conductivity of the
       material further Accentuates this effect. The depth at which the eddy current
       density is reduced to about 37% of its intensity on the surface, us called
       standard depth of penetration. This depth is given by

                                                 1
       Standard depth of penetration =
                                               πf µrσ

       Where f = frequency
       µr = relative permeability
       σ = electrical conductivity.
       The fig. below illustrates the relationship between depths of penetration against
       frequencies for various materials.
Fig. 2.17 Depth of Penetration-Frequency for Various Materials.


2.2.6.3 EDDY CURRENT TEST SYSTEM (5)

         Basic Test System

         An eddy current test system consists of :
(i)     An oscillator to provide alternating current of required frequency for exciting the
        test coil.
(ii)    Test coil-test object combination which brings out desired information in the form
        of an electrical signal.
(iii)   Signal processing
(iv)    Signal display.
The following figure gives the block diagram.


                                                       OSCILLATOR


                       TEST COIL
                       TEST PART
                                                           BRIDGE
                                                           CIRCUIT


                                                         SINGLE
                                                       PROCESSING
                                                        CIRCUITS


                                                          READ OUT


                Fig. 2.18 Block Diagram of Eddy Current Test System

          Here an Oscillator provides alternating current of required frequency to the test
          coil, which generates eddy current in the test object. The test object variables,
          like conductivity, permeability, discontinuities, etc. modulate the test coil
          impedance. The modulated impedance signal is processed and displayed over a
          readout mechanism. The commercially available eddy current equipment falls in
          the following two categories: (1) amplitude detector and amplitude – phase
          detector; and (2) special purpose equipment like conductivity meters, thickness
          measuring equipment for conductive materials and for non-conductive coating
          on conductive materials, flaw detector/metallurgical condition monitors, etc.

2.2.6.4   SENSING ELEMENTS TYPES AND ARRANGEMENTS (5)

          In most of the non-destructive inspection equipment applications of eddy
          current, the test coil (also called sensing element) serves as the main link
between the test instrument and test object. It serves two main functions. The
           first one is to establish a varying electromagnetic field which induces eddy
           current in the test object and induces increased magnetic effect in magnetic
           materials. The second purpose is to sense the current flow and magnetic effect
           within the test object and feed the information to signal analysis system.

           Factors that influence selection of a test coil are:-

(i)       Nature of the test specimen, e.g. Flat (sheet & plates), cylindrical (rods, wires,
          tubes and pipes), spherical (ball).

(ii)      type of information required and likely distribution of variables, e.g. Crack
          detection, conductivity variation, permeability variation, etc.

(iii)     accessibility, e.g. complexity of shape can make a test location on a component
          very difficult and the test may require a special configuration coil for testing.

(iv)      quantum of inspection: Depending on the production rate of a component and
          percentage inspection or service monitor needs, the selection of coil is made.

2.2.6.5    TYPES OF COILS (5):
(i)        Encircling Coil:

           An encircling coil is a coil arrangement in which the coil is in the form of a
           solenoid into which the test part is placed. With this arrangement the entire
           outside circumferential surface of the test part covered by the coil is scanned at
           a time. Its main advantages are Evaluating entire circumference at one time,
           High speed of testing and No coil wear problem. Main disadvantages are that it
           does not identify the exact location or point of defect in the circumference.

(ii)       Inside Coil:

           An inside coil is a coil arrangement in which the coil is in the form of a winding
           over as bobbin, which passes though the parts like tube, bolt holes, etc., to be
           tested and this arrangement scans the entire inside circumferential surface of the
           tube or bolt hole at a time. The main advantages are evaluation of the entire
           internal circumference at a time, which is otherwise not accessible to any other
optical method of inspection. Main disadvantages are inability to identify the
           exact location or point of defect over the circumferencential inspection and
           more Wear and tear of the test coil.

(iii)      Surface Coil:

           Surface coil is a type of coil arrangement in the form of a spring mounted flat
           probe or a pointed pencil type probe which scans the surface or selected location
           and this arrangement is very useful in exactly locating the defect. In surface
           probes, the distance between the probe and the specimen is very critical and this
           must be taken care of in probe design or in equipment design, to compensate for
           this ‘lift-off’ effect. In some surface probes, the coil is spring mounted, such
           that independent of the pressure applied, a constant spring pressure is applied to
           the coil and holds it firmly against the specimen. Main advantage of this coil is
           that it pin points the defect and disadvantages are speed of testing is slow being
           manual and lift-off and edge effect create problems.


 2.2.6.6   TEST COIL FUNCTION AND SIGNAL FORMATION (5)

           Although the same coil can be used for excitation and for supplying the
           response signal, this is not necessary and often not desirable. One coil can be
           used for excitation purposes with a second coil or multiple coils used for
           monitoring the electromagnetic field conditions. The use of separate coils for
           excitation and sensing gives greater flexibility in meeting the test system
           requirement. For example, the primary electromagnetic field may be established
           by the use of a few turns of relatively large wire driven from a low impedance
           generator and the number of turns not the sensing coil can be adjusted to meet
           the input impedance requirements of sensing circuits. If desired, sensing circuits
           having very high input impedance can be used and the sensing coil may be
           wound with many turns of small wire gives a simple illustration of a sensing
           coil inside an excitation coil. As a simplified case, let ‘I’ be the current flowing
           through the excitation loop. Let us consider an element current Idl at ‘A’ in the
           excitation loop. Because of this elemental current at point ‘A’ there will be an
           induced voltage E1 at Point ‘B’ in the sensing loop and E 2 at a point ‘P’ in the
           test material. The induced electric field E2 at P causes a current Im to flow in the
           test object at point ‘P’. This current in turn causes induction resulting in a
           electric field Em at point ‘B’ in the sensing coil. Thus in the above simplified
case at point ‘B’ in the sensing element, there is an induction field due to
          current element Idl in the primary exciting loop and another filed Em due to the
          current intensity at point ‘P’ in the conductive object. Hence the total current
          intensity at ‘B’ in the sensing coil due to a current element Idl flowing at point
          ‘A’ is given by ET = El + Em. Similarly, each elemental point around ‘P’ in the
          part contributes its own filed and hence the information carried by the sensing
          coil is a cumulative field information which is a complex factor when
          contribution of ‘I’ though the excitation loop is considered as a whole.

          This resultant field intensity is fed to analyzing circuit. The test coil’s output
          signal is shown in the phasor diagram. The curved locus ABCD represents the
          test coil output signal locus for variation of conductivity of test object.

          A standard test object might have the conductivity represented by signal point
          D. The signal phasor OD represents the test coil output for this standard
          condition. Now let us assume that the original test object is replaced by a second
          test object which has a lower conductivity than the first one. This might give a
          test coil signal represented by a phasor OC. These two cases give distinct
          difference in readings as shown in fig illustrated below.


                           Fig. 2.19 Coil Output Shown on Impedance
                                            Diagram


2.2.6.7   TEST COIL SELECTION CONSIDERATIONS (5)

          Selection of test coil depends on the nature and shape of the specimens to be
          tested, the type of information sought, the location of information sought, the
          distribution of information during the course of testing and the magnitude of
          testing required. Normally to achieve satisfactory test results, test coils are
selected to suit a specific test situation. This is done depending upon the shape
          of the test object, the sensitivity and resolution required in a test situation. The
          depth of eddy current penetration depends on test frequency, conductivity and
          permeability. Hence selection of frequency for a test situation on part of known
          conductivity and permeability is one of the main considerations. Each test
          requirements requires high duty cycle system. High production rate testing like
          tube, wires, etc. requires a specific test system. High production rate testing like
          tubes wires, etc. requires high duty cycle system with a good mechanical,
          electrical and thermal stability. The system should have least vibration between
          coil and job, whereas in a scanning type surface coil testing, good resolution and
          sensitivity are very essential. The test object conductivity varies due to
          temperature. Power dissipation in coil-object combination would result in
          temperature variation leading to change in conductivity. This thermal drift effect
          is troublesome, only when the coil assembly scans the same location of the test
          part for more duration.

2.2.6.8   TEST FREQUENCY AND DISTRIBUTION OF EDDY CURRENT (5)

(i)       Effect of Frequency on Eddy Current Testing:

          Eddy current testing is based on the principle of electromagnetic induction,
          wherein the test object is placed under the influence of varying magnetic field of
          a test coil driven by an alternating current of required frequency. In general, the
          test coil is characterized by a change in impedance which consists of two
          electrical impedance parameters. Impedance change due to magnetic variable
          causes a change in inductive reactance component ‘XL’. Alternatively, a change
          in electrical variable causes a change in resistive component ‘R’ of the
          impedance. In the case of inductive reactance XL (2πfL) the test coil’s inductive
          reactance is frequency dependent since ‘f’ is the frequency of the applied A.C.
          field. Since the inductive reactance is directly proportional to the frequency of
          the test coil, it plays an important role in eddy current testing.
There are basically three approaches to eddy current testing: (i) Impedance
          testing: (ii) Phase analysis: and (iii) Modulation analysis. These methods can
          identify changes in conductivity, permeability or dimensional variations of the
          test specimen cumulatively or separately. A change in any one or more of the
          above characteristics, or a test part will be identified accordingly, depending
          upon the test requirement and choice of the method. Similarly important
          instrument characteristics which influence the eddy current testing are: (i)
          frequency of the A.C. applied to the test coil; (ii) size and shape of the test coil;
          and (iii) distance of the test coil from the object or electromagnetic coupling
          (lift-off/fill factor).

          Basic factors which influence the eddy current testing are (i) the effective
          permeability (µeff.). Which is determined by the frequency ration f/fg ; (ii) the
          limit frequency fg which is a function of physical characteristics of the test
          object such as conductivity (σ), relative permeability (µrel.). Diameter (d) for
          round specimens; (iii) test frequency f, and (iv) electromagnetic coupling (fill
          factor in case of cylindrical test object–encircling coil combination).

          The optimum test frequency for a specific test problem is determined by theory
          or experiment to provide the highest sensitivity to detect variation in
          conductivity, dimensions or permeability.

2.2.6.9   SELECTION OF TEST FREQUENCY (5)

          Generally, test frequencies used in eddy current inspection range from 200 Hz
          to 6 MHz. Frequency has a direct relationship with the ability of any eddy
          current test system to accurately and reliably measure the desired property of
          the test object. Frequencies can be selected to provide a maximum response
          signal caused by the variable. Usually lower frequencies of the order of 1 KHz
          are used for magnetic materials and relatively higher frequencies for non-
          magnetic materials. Actual frequency used for any specific case/instrument
          depends upon the thickness of test material, desired depth of penetration, degree
          of sensitivity/resolution required and the purpose of the inspection. For
          example, mid range frequency (say 100 KHz) might be used to detect surface
          cracks in stainless steel plate. Higher frequencies (1MHz) provide less
          sensitivity to cracks and greater sensitivity to lift off/ dimensional variations.
Lower frequencies (1KHz) may provide poor sensitivity to the surface cracks
      but have good sensitivity to conductivity variations in the base material.

      Selection of frequency is a compromise so that penetration is sufficient to reach
      any sub-surface flaw. At lower frequencies, penetration is greater, but at the
      same time sensitivity to flaw decreases. Therefore, inspection frequency as high
      as possible that is still compatible with the required depth of penetration is
      selected. Generally, small flaws remain undetected as the depth increases.
      Optimum frequencies are often determined experimentally. Frequency selection
      can be within a range since often there will be wide band frequencies, which
      produces nearly the same results. The following Fig. gives a general guideline
      for frequency selection for different purposes.

     Ferrous                        Crack Detection &               Coating

     Sorting                        Non-Ferrous Sorting             Cladding

     Low Freq.                      Med. Freq.                      High Freq.

   1Hz 10Hz 100Hz 1KHz 10KHz 100KHz                 1MHz 10MHz
                 Frequency

                         Fig. 2.20 Frequency Distribution

2.2.6.10 EDDY CURRENT DISTRIBUTION (5)

      In eddy current testing, the coil’s field intensity decreases as the distance from
      the coil surface increases. The amount of eddy current generated in a specimen
      increases as the field intensity increases. If we consider an empty test coil, the
      filed would have a constant intensity across the coil’s inside diameter. When the
      test coil carrying A.C. is placed near a conductor, the electrons in the conductor
      move back and forth generating eddy current which follow circular path. This
      path will always be parallel to the surface of the specimen.

      The eddy current generated near the surface will be more. As the depth from the
      surface increases eddy current intensity decreases. The reason is that the flow of
      eddy current generates a secondary magnetic field decreases the intensity of the
      coils’ magnetic field. Near the surface, the test coils’ full intensity is applied and
hence eddy current of higher intensity is generated. In the subsequent layer the
intensity is decreased due to the nullifying effect of the secondary magnetic
field due to eddy current. Thereby the eddy current produced in subsequent
layers below will be less than the previous upper layer. This phenomenon
continues until the eddy current intensity becomes negligible. Thus at the center
of a circular conductor of reasonable diameter, eddy current intensity will be
almost negligible.

Distribution of field strength or eddy current density within the test object
determines the sensitivity of the test method. At higher f/fg ratio, eddy currents
concentrate near the surface which results in sensitivity restricted to surface
cracks with reduction in sensitivity to conductivity variations. Too low test
frequencies, no doubt, would have greater penetration but are less sensitive. At
very high f/fg ratio (say 100), the eddy current density fails off very rapidly as
indicated by a steep falling trend of the curve. At f/fg of 4, the intensity falls off
gradually indicating the presence of eddy current even at lower depths. The rate
of reduction of the field strength decreases and the percentage of fields strength
decreases. The eddy current density at the surface decreases as the frequency is
decreased. As the frequency is increased, the eddy current concentrates near the
surface and decreases as the depth increases with virtually no field strength at
the center. Stronger the eddy current, more sensitive is the system for detection
of discontinuities and sensitivity is always greater near the surface.

Inhomogeneities and discontinuities act to obstruct the passage of eddy current,
thereby distorting the circular path. This changes the effective conductivity of a
test piece by concentration of eddy current into a relatively small volume. This
results in lowering the effective conductivity of the specimen. Further, the
response to surface cracks and discontinuities is greatly reduced at low f/fg
ratios. If the magnetizing field strength is increased, the eddy current density
also increases proportionately. But if very high eddy current is developed, it
heats up the test sample which is turn changes the electrical conductivity of the
test specimen resulting in erroneous test results.
2.2.6.11 GENERAL GUIDELINE FOR FREQUENCY SELECTION (5)


                     Application                 Frequency Range
                     Ferrous Sorting             1 to 400 Hz

                     Crack detection &           400 Hz to 8 MHz
                     Non ferrous sorting


                     Coating &       Cladding 1 MHz & above
                     Thickness

                Table 2.2 Frequency selection for different materials


2.2.6.12 EDDY CURRENT TEST SYSTEM REQUIREMENTS (5)

        Basically any electromagnetic test system consists of :-

(i)     a generator to provide a.c. to required frequency which will excite the test coil.

(ii)    A modulating device consisting of test coil – test object combination. Varying
        property of the component modulates the impedance magnitude of the coil.

(iii)   A signal preparation unit consisting of bridge / null balancer, filters, amplifiers,
        etc.

(iv)    Demodulation and signal analysis unit consisting of phase discriminators,
        compensators, etc.

(v)     Read out mechanism like meters, CRT, relays, recorders, etc.

        Equipment design consideration depends upon the nature and requirement of the
        test conducted. Mostly impedance magnitude type equipments are used when
        the change in the coils impedance is displayed over a meter or CRT screen. The
        deflection of meter reading is proportional to the magnitude of variation in the
sample. Since the impedance magnitude test cannot separate, allowed tolerance
         diameter change effects from conductivity changes, it is having limited scope in
         practice.

          Four basic types of instruments are :-
(i)     measuring the change of magnitude of the total impedance of the test coil
        regardless of phase.

(ii)    measurement of the resistive component of the test coil impedance (core loss).

(iii)   measurement of the reactive component of the coil impedance.

(iv)    Phase sensitive measurements which separate the resistive and reactive
        components of the coil impedance, as required.

         Eddy current instrumentation system is designated to sense and indicate
         variations in the output of the coil assembly resulting from changes in
         electromagnetic field caused by discontinuities in the part under test. The
         detection system may include an adjustable phase selective system as well as
         filter circuit for the purpose of enhancing the response to specific kind of
         variations present in the output of test coil assembly and reducing unimportant
         variations. When such selective methods are present, means must be provided to
         ensure that their correct adjustments are achieved. This is done by the use of
         calibrated controls. The stability of eddy current system should be such that
         repeatable results are obtained when a calibration standard is passed through the
         test system at various times.

2.2.6.13 READ OUT (DISPLAY) MECHANISMS (5):

         An important part of eddy current inspection system is the readout system used
         to display the demodulated signals for interpretation. The display device may be
         an integral part of the system or a replaceable plug-in module type. The readout
         mechanism should be of required speed and accuracy to meet the test
         requirement depending upon production speed and variable of interest. A single
         test requirement may have more than one device. There are various types of
         display devices available.
(i)     Uncalibrated Meter:

        This is otherwise known as analog meter and gives continuous reading over a
        wide range. They are rapid in operation and the scale can be calibrated for any
        specific parameter by having standard specimen with known parameter. The
        accuracy of such meters is ±1% of full scale.

(ii)    Calibrated Meters:

        These types of equipment have a meter with a needle, over which calibrated
        scales for specific variables to be measured (usually coating thickness, etc.) is
        attached. For each measurement different scales are attached and the needle
        reading against the calibrated scale given the test parameter directly.

(iii)   Digital Meters:

        These provide greater accuracy than analog meters. Here the chance of operator
        error is negligible, since the reading is direct and no interpretation is involved.
        This system is faster than direct meter type.

(iv)    Audio and Video Alarm:

        Both these two system alert the operator that the test parameter level has
        exceeded the pre-set level. These two systems can be set to any threshold level
        by adjusting as potentiometer type control. If any input signal exceeds the set
        level an automatic warning alerts the operator by way of a blinking lamp or a
        buzzer.

(v)     X-Y Recorder:

        Here the output signal activates a pen which records continuous line as a chart.
        When scanning long specimens like rod, tube, etc. the recording reveals position
        of a given flaw in one co-ordinate (the longitudinal direction of the specimen) in
        the form of a ‘go’ and ‘no-go’ trace or proportional trace. X-Y recorders makes
        it possible to simulate on a stationary sheet of chart, the scanning movement of
the coil in two co-ordinates. The X-Y recording is done by means of an ink
         filled stylus which is activated by the output signal voltage.

(vi)     Storage Oscilloscope:

         This is similar in principle to X-Y recorder but is comparatively fast. The
         storage pattern is available over a long persistence fluorescent screen of CRT as
         along as desired by the operator, but can be cleared when the interpretation is
         completed.

(vii)    Magnetic Tape Recorder:

         The output signal can be recorded in a magnetic tape at a good speed and can be
         played back and analyzed later at any time.

(viii)   Computers:

         These types of mechanisms are very useful for complex test variables and the
         output signals from various channels are fed to a high speed computer. These
         mechanisms are highly useful in high production rate process lines. The
         computer separates parameters and isolates the variable of interest and
         significance, catalog data, print the summaries of the result and store them on
         tape for reference in future study.


2.2.6.14 APPLICATION OF ELECTROMAGNETIC TESTING (5)


         Eddy current method of non-destructive testing is put to variety of applications.


         Broadly, eddy current application can be grouped into (i) Conductivity
         measurement (sorting, hardness, heart-treatment, & alloy segregation,
         carburization, etc.); (ii) Discontinuity testing (cracks, dimensional charges,
         surface conditions, etc.); (iii) Thickness measurement (coating, platting, sheet
         metal gauging, etc.).
2.2.6.15 FLAW DETECTION (5)


       Inhomogeneities in electrically conducting materials appreciably alter the
       normal circular eddy current flow pattern and can be detected by eddy current
       test coils. The inhomogeneities include crack, inclusions, voids, seams, laps etc.
       and are termed as discontinuities.


       Single surface probe coil with defectometer is normally employed for detection
       of crack depth in forgings, castings, extrusions which are electrically
       conductive. The system is balanced with the probe in air and further balanced to
       a zero value on sound material of the same composition, heat- treatment and
       surface conditions as the component under test. Alternatively, a known defect
       can also be used for balance calibration. Flaw suspected areas of the surface are
       scanned with the probe which searches for imbalance due to flaw. The
       indications for defective component, in meter type, ellipse type and vector point
       type presentations are shown in fig. below. For wires, solid and hollow
       cylindrical parts, rods, etc. encircling coil is used.
Phase Response from Cracks:


         Phase changes are unique for several eddy current inspection parameters. By
         determining the phase change of an eddy current response, it is possible to
         isolate the response of a specific variable such as conductivity, lift-off,
         thickness, permeability and cracks (Refer Fig. 2.21)


                         Fig. 2.21 Defect Indication in Various Displays

In most applications of eddy current inspection, difference in phase between lift-off
response and crack response is essential for the detection of cracks. When conductivity,
magnetic permeability, frequency, etc. are low and crack size is small, the phase angle
response between lift-off and crack indication will be small. As the magnitude of one or
more of the above variables increases, the phase angle increases. When the crack length
increases, the phase angle approaches more closely the phase angle for conductivity
changes.
2.2.6.16   Effects of Material and Inspection variable on sensitivity and thickness. (5)

                Increase in Variable            Effect of Sensitivity                  Range of
                                                                            Measurement
               Conductivity, Material (1) Increases for thin metallic (1) Decreases          for
               permeability and test      parts and platings               metallic materials.
               Frequency              (2) Increases for thick metallic
                                          parts and platings           (2) Increases for non-
                                      (3) Increases for non conductive     conductive
                                          coatings                         coatings.

               Probe diameter             (1) Increases for thick metallic Increases for metallic
                                              parts and platings.          parts platings and non-
                                          (2) Increases for non-conductive conductive coatings.
                                              coatings.


Table 2.3 Effects of Material and Inspection variable on sensitivity and thickness. (5)

           The above table gives the effects of material and inspection variable on
           sensitivity and thickness and also their range of measurements.
           Generally alloy sorting, heat treatment checks (non-magnetic materials),
           cladding thickness, plating thickness, etc. fall under conductivity measurement.
           Magnetic material alloy sorting, plating thickness, case depth, heat-treat control,
           fall under magnetic permeability measurement. Measurement of thin foil
           thickness fall under geometry measurement. Detection of cracks, seams,
           inclusion, etc. fall under flaw detection. Insulation thickness, non-metallic
           coating thickness measurements, etc. fall under magnetic coupling (lift-off/fill
           factor) variation measurement. Table 2.4 given below shows the effective depth
           of penetration for various frequencies for different materials.
Material      Permeability Conductivity            Depth of Penetration (mm) at
                                          (σ) %                         frequency
                                                            1 KHz     10KHz 30 KHz         100
                                                                                          KHz
           Copper               1              100           2.00      0.63      0.31      0.20
           Aluminum             1               65           2.80      0.84      0.48      0.25
           Magnesium            1               39           3.30      1.02      0.58      0.33
           Brass                1               55           4.30      1.36      0.78      0.43
           Mild Steel          500             2.1           0.25      0.10      0.05     0.025
           (Normal)
           Mild Steel           1              2.1           6.90        2.27       1.34        0.76
           (Saturated)
           Austenitic           1              2.1           13.40       4.30       2.45        1.34
           Stainless
           Steel

       Table 2.4 Depth of Penetration for various materials and frequencies.

2.2.6.15      STANDARDIZATION AND CALIBRATION (5)

              Eddy current method of inspection can only be applied on a ‘GO’/’NO GO’
              basis by calibrating the test system against a pre-fabricated standard with
              known magnitude of variation, desired to be measured in a specimen which is
              identical to the test component except the parameter being measured.
              Artificially fabricated standards may contain notches, slots, holes etc. Their
              types, advantage, limitations and applicability has been shown in the table 2.5
              below.
Type                   Advantage                    Limitation                Applicability
Drilled Holes          (1) Easy to fabricate.       Maximum          response (1) For small crack in Al
                       (2) Good       dimensional difficult to detect.             & Ti.
                           tolerance.                                          (2) Not for small crack in
                                                                                   sheet.
Saw Notches            Easy to fabricate in field. Precise       dimensional Good for crack standard
                                                    tolerance possible in in Al, Ti and Steel.
                                                    field.
Conductivity           (1) Easy to use in field.    (1) Response        varies (1) Not for small cracks.
Difference             (2) No tools/ labour              with type of probe. (2) For           instrument
                           involved.                (2) Primarily for non-         operation checking.
                                                         ferrous alloys.       (3) Not for use with
                                                                                   steels.
Slots     in     foils (1) Easy      for      field (1) Dimensional            Not for small cracks.
(Razor cuts)               fabrication.                  control difficult.
                       (2) Formed to curved (2) Not for harder
                           surface.                      metals.
                                                    (3) Response
                                                         repeatability poor.
E.D.M.       Notches (1) Good         dimensional (1) Cannot                be For small cracks in Al, Ti
(Electrical                tolerance.                    fabricated in field and Steel.
discharge              (2) Response similar in           fabrication
machining)                 phase to crack.          (2) Expensive
E.D.M. slots in (1) Good              dimensional (1) Expensive.               Not for small cracks.
foils                      control.                 (2) Difficult for field
                       (2) Formed to curved              fabrication.
                           surface.                 (3) Response
                                                         repeatability poor.
Shrink fit plugs       For surface and bolt Off               scale      gross (1) Not for small cracks.
                       holes.                       indication.                (2) For           checking
                                                                                   instrument operation.
Milled Notches         Less expensive than (1) Response                 varies (1) Not for small cracks.
                       E.D.M. notches                    with type of probe. (2) For             checking
                                                    (2) Difficult for field        instrument operation.
                                                         fabrication.

                    Table 2.5 Commonly used Reference Standards
2.3   RELATIVE ADVANTAGE & DISADVANTAGES OF VARIOUS NDT
      METHODS :-

      Name of the Method    Advantages              Disadvantages
      (A)                  (i)    Low Initial Cost (i) Trained operator
                           (ii)   Permanent               needed.
           RADIOGRAPH             Records           (ii) Cost related to
           Y (GAMMA        (iii) Portable                 source size.
           RAYS AND X-     (iv) Small Sources       (iii) Depth of defect
           RAYS)                  can be placed           not shown.
           INSPECTION             with small        (iv) High initial cost
                                  openings.         (v) Source decays
                           (v)    Panoramic               radiation hazard.
                                  imaging           (iv) Sensitivity
                                  possible (X-              decreases with
                                  Ray)                      increase in
                           (vi) High sensitivity            scattered
                                  to density                radiation.
                                  changes.
                           (vii) Nocouplant
                                  required.
                           (viii) Geometry
                                  variation doesn't
                                  effect direction
                                  of X-ray beams.


      B.   ULTRASONIC      (i)     Most sensitive     (i)     Couplant
           INSPECTION              to cracks.                 required
                           (ii)    Test results       (ii)    Small Thin &
                                   known                      complex parts
                                   immediately.               difficult to test.
                           (iii)   High penetration   (iii)   Reference
                                   capability.                standard
                           (iv)    Automation and             required.
                                   permanent          (iv)    Trained operator
                                   record                     required.
                                   capability.        (v)     Special probes
                                                              required
C.   EDDY          (i)      No special         (i)     Conductive
     CURRENT                operator skill             material alone
     INSPECTION             required                   can be tested
                   (ii)     Low cost           (ii)    Shallow depth of
                   (iii)   Automation                  penetration
                           possible for        (iii)   False indication
                           symmetrical                 due to variation
                           parts                       in part geometry
                   (iv)    Permanent           (iv)    Reference
                           record possible             standard required
                   (v)      No couplant        (v)     Permeability
                            required                   variation causes
                                                       difficulties.
D. MAGNETIC        (i)     Advantage over      (i)     Low sensitivity
   PARTICLE                penetrant that it           due thick surface
   INSPECTION              indicates sub-              coatings.
                           surface defects –   (ii)    Alignment of
                           particularly                magnetic field is
                           inclusions.                 critical.
                   (ii)    Relatively fast     (iii)   Demagnetization
                           inspections.                of parts required
                   (iii)   Low cost.                   after test. Must
                   (iv)    Portable & Fixed            be cleaned
                           both types                  before and after
                           available                   the test.
E.   PENETRANT     (i)     Portable            (i)     Surface Films
     (DYE AND      (ii)    Low cost                    such as coatings,
     FLUORESCEN    (iii)   Indications may             scales, smeared
     T                     be further                  metal prevent
     INSPECTION)           examined                    detection of
                           visually                    defect.
                   (iv)    Results easily      (ii)    Parts must be
                           interpreted.                cleaned before
                                                       and after
                                                       inspection.
                                               (iii)   Defects must be
                                                       open to surface.
3.        EXPERIMENTAL SETUP
3.1         HIGH FREQUENCY EDDY CURRENT INSPECTION OF A320 AIRBUS
            WHEEL HUB ASSEMBLIES (6)
3.1.1       INSTRUMENTATION
 (i)        Eddy Current Inspection Defectometer Model H 2.835
 (ii)       Eddy Current Inspection Non-ferrous surface probe (Shielded)
 (iii)      Eddy Current Inspection reference standard for calibration


                                 Fig. 3.1 Defectometer Model H 2.835
         3.1.1.1 Defectometer Model H 2.835 has the following features (Refer Fig. 3.1):
   (i)       On/Off switch “O/I”
   (ii)      “Ready” display
   (iii)     Pushbutton “L” Lift-Off compensation
   (iv)      Pushbutton “Z” zero compensation
   (v)       Pushbutton “M” material-Type (Fe, NFe, Aust.)
   (vi)      Pushbutton “*” open lock
   (vii)     Pushbutton “” to increase sensitivity
   (viii)    Pushbutton “” to decrease sensitivity
   (ix)      Five LED’s “DEFECT”
   (x)       Analog instrument “crack severity”
   (xi)      Threshold switch
   (xii)     “ZERO” compensation
(xiii)      Symbols for “Lift-Off” compensation
 (xiv)       “Ready” symbol to indicate operability
 (xv)        Symbol for Material type


3.1.1.2 Eddy Current Tester Calibration Procedure
(i)Lift-Off compensation
Lift-Off may be defined as the change in impedance of a coil when the coil is moved away from
the surface of the specimen. This produces a large indication on the test equipment.
                               L

Flashing of the symbol             indicates that Lift-Off compensation must be carried out. For this
purpose raise the test probe from the testpiece and depress the push button “L”. This stops
flashing of “L” in the display and symbol remains for upto 3.5 seconds whilst Lift-Off
compensation is carried out. The “L” is extinguished and “Z” beings to flash with the symbol

            (Refer Fig. 3.2)
        .


                          Fig 3.2 Eddy Current Tester Calibration Procedure
(ii)Selection of Test Probe


The test probes are either Ferrous, Non-ferrous or austenitic, depending upon the type of material
to be tested. For Non-ferrous mode the test frequency is approx. 2 MHz and for ferrous and
austenitic mode it is approx. 4 MHz. Special probes can be obtained for very special inspections
as per the test requirements. There are surface probes which are used for detecting surface or
sub-surface cracks. There are hole probes used to detect radial cracks in round fastener holes
(Cracks inside the fastener holes).


Calibration Standard is supplied along with the apparatus as per the material to be tested and test
probe being used. In order to calibrate the equipment, standard reference pieces, manufactured
from a material similar to that being tested, are necessary. These pieces should contain defects of
known size and shape, so that the change in coil impedance against a known defect could be used
as an acceptance limit.
3.1.2 EXPERIMENTS (6)
3.1.2.1     PROCEDURE AND OBSERVATIONS
          As a part of On-Condition (O.C) preventive maintenance programme of A-320, main
          wheel assemblies, High frequency eddy current inspection is carried out during every
          shop visit of the wheel assemblies (Shop visit is mainly due to worn out tyres requiring
          tyre change or wheel assemblies overhaul).


          I associated in carrying out A320 aircraft main wheel hub assemblies high frequency
          eddy current inspection in the wheel-bay section of Accessories overhaul shop. The
          details of which are given herebelow & copies of their work sheets are enclosed for ready
          reference. First I calibrated the defectometer with the help of the testpiece. After
          connecting the test probe to the probe socket, the defectometer is switched on. The
          display indicates the sensitivity values and the type of material of the last test. For the test
          to be carried out one should make sure the displayed material type (Fe, NFe, Aust.)
          agrees with that of the test probe. 12.5 seconds after the appearance of the “READY” all
          push buttons are locked with the exception of the button “Z” and “L” thus preventing
          inadvertent changes to the selected settings. The defectometer is now ready for use. The
          crack severity display of the unit can be set with the help of test flaws in the testpiece.
          The sensitivity can be modified between 0 and 19.5 db in the steps of 0.5 db. An audible
          flaw signal can also be obtained in addition to the visual signal. The audio generator
          incorporated in this defectometer can be set with the threshold switch as a threshold value
          to 20, 40, 60, 80 and 100 scale divisions of instruments corresponding to 5 flaw
          thresholds.
Testing is extremely simple. The test probe is lowered onto the test piece and smoothly
guided over zone to be tested. If the material is flawless, the pointer merely flutters
around the scale reference point due to the inaccuracy of the manual probe guidance. On
the other hand cracks on the surface of the material cause a deflection of the pointer
which is proportional to the depth. The display increases as the crack depth increases. As
the calibrated threshold is reached, an audible signal is given along with large deflection
of the pointer on the scale. If testing is to be carried out in transition from plane surface to
an acutely curved surface undesirable displays appears on the unit. This situation is
eliminated by means of following described calibration method. For testing curved
surfaces, the instrument pointer can be set to the centre of the scale with the zero control
after switching on the unit. To test concave surfaces, Lift-Off compensation is carried out
by placing the probe on the level surface and Zero compensation is carried out in the
curve. To test convex surface, Lift-Off compensation is carried out on the curve and Zero
compensation is carried out on the level surface. The defectometer is now ready to test
the curved surface after “READY” appears on the display.
After testing few of the main wheel hub assemblies, the following five Main wheel hub
assemblies were found to have defects, the details of which are given herebelow:


                      Fig. 3.3 Eddy Current test Procedure
(i). Main wheel assemblies serial no. AM442 removed from A320 aircraft VT-EPO
durng its ‘4A’ check on 8/1/05 due to uneven wear of the tyre. During shop checks & as
per item A of the WORKSHEET of A320 aircraft Main wheel assembly
servicing/overhaul schedule, high frequency eddy current inspection of inner & outer half
hubs of main wheel assembly serial no. AM-442 was carried out in association with shop
inspection engineers using non-ferrous surface probe & defectometer. Inner half of hub
was found to have a crack of approx ¾” on the web near flange attachment area. Outer
half of the hub was found satisfactory (Refer Fig. 3.4)


      Fig 3.4 Crack on the web near flange attachment area of the hub


Refer Appendix I for Shop Inspection Report of Main Wheel Assembly S.No. AM442
Hub Assemblies


(ii). Main wheel assembly serial no. AM 398 removed from A320 aircraft VT-EPM on
8/10/04 during night halt inspection due to its tyre wear. During shop investigation,
H.F.E.C inspection of inner & outer half hubs carried out using non-ferrous surface probe
& defectometer, a circumferential crack of ½” length observed between the tie bolt holes
of outer hub. H.F.E.C inspection of inner hub found satisfactory. (Refer Fig. 3.5)
Fig. 3.5 Circumferential crack between the tiebolt holes.
Refer Appendix II for Shop Inspection Report of Main Wheel Assembly S.No. AM398
Hub Assemblies.


(iii). Main wheel assembly serial no. AM208 removed from A-320 aircraft VT-EPC on
20/10/04 during preflight inspection due to uneven wear of the tyre. During shop
investigation, High frequency eddy current inspection of outer & inner wheel hubs
carried out & inner half hub found to have a longitudinal crack of approx. 0.4 inch near
the drive block area (The web area). H.F.E.C of the outer half hub satisfactory (Refer Fig.
3.6)
Fig. 3.6 Longitudinal crack in the drive block area
    Refer Appendix III for Shop Inspection Report of Main Wheel Assembly S.No. AM208
    Hub Assemblies.


    (iv). Main wheel assembly serial no. AM201 removed from A320 aircraft VT-EPR on
    3/1/03 during night halt inspection due tyre worn-out. During shop, investigation, outer
    half of the hub having a crack of approx. ¼ inch between spoke hole area. Inner half of
    the hub satisfactory (Refer Fig. 3.7)
.
Fig. 3.7 Crack between the spoke hole area


Refer Appendix IV for Shop Inspection Report of Main Wheel Assembly S.No. AM201
Hub Assemblies.


(v). Main wheel assembly serial no. AM493 removed from A320 aircraft VT-EPI on
21/9/04 during ‘2A’ check as wheel assembly was due for overhaul. During shop
investigation, outer half of the hub having a circumferential crack of approx. 0.7 inch
between the tie bolt holes & approx. 0.5 inch diagonal crack at the nozzle hole. H.F.E.C
of inner hub – satisfactory (Shop NDT report enclosed) (Refer Fig. 3.8).
Fig. 3.8 Cracks between nozzle hole and tiebolt hole


        Refer Appendix V for Shop Inspection Report of Main Wheel Assembly S.No. AM493
        Hub Assemblies.


3.2     ULTRASONIC INSPECTION OF L.P COMPRESSOR FAN BLADE OF M/s IAE
        V2500 ENGINE INSTALLED ON A320 AIRCRAFT. (7&8)


3.2.1   INSTRUMENTATION
 (i)    High Frequency Ultrasonic Testing Instrument
           Meccasonic         D125BJ              or             Meccasonic   D325BJ
           (Refer Fig. 3.9)
Fig. 3.9 Meccasonic Ultrasonic Tester
(ii)    25 MHz focussed testing probe
           Meccasonic ‘Blueface’ probe 1001225 or equivalent as per Overhaul Manual
(iii)   Calibration standard to be made from the same material or a material with same
        acoustic velocity as the part to be tested.
(iv)    Ultrasonic Couplant Ultragel II


                             Fig. 3.10Ultrasonic Tester Calibration
        Ultrasonic Tester Calibration Procedure Model D325BJ unit (Refer Fig. 3.10)
(i)     Switch the set on.
(ii)    Set the vertical movement control to mid-setting and push in the vertical control.
(iii)   Set the horizontal movement control to mid-setting.
(iv)    Set the outer thickness control to position 1 and centre thickness control to its mid
        position.
(v)     Turn the brightness control to get a trace of necessary brightness and focus the trace.
(vi)     If necessary control the display with vertical and horizontal controls.
 (vii)    Set amplitude control to its mid position.
 (viii)   Select calibrate position on interface trigger button.
 (ix)     Turn delay control fully anti-clockwise
 (x)      Turn horizontal control clockwise to position first pulse at far left of screen.
 (xi)     Position applicable calibration piece and first multiple echo must be monitored at mid-
          screen on the time-base.
 (xii)    Set thickness control to position 5.
 (xiii)   Turn delay control clockwise the first pulse will go out of view to the left. Continue to
          turn until the first multiple echo is at the far left of the screen but no part of the pattern is
          off screen.
 (xiv)    Push IF button into LOCK position. No multiple echo should be seen at this phase.
          Slowly and continuously increase IF LEVEL control from 0 until echo pattern jams and
          locks on to the left of the screen.
 (xv)     Tilt calibration piece to reduce the interface echo amplitude and get the most stable
          display possible on the smallest interface echo.
 (xvi)    Set thickness control to position 3.
 (xvii) Using centre THICKNESS control and horizontal control calibrate screen as necessary.
          The video display must calibrated from at least the first and second backwall echo’s.
          Adjust amplitude control to produce a first backwall echo ½ to ¾ screen height.


Selection of Test Probe
The test probe consists of a transducer mounted in a damping material and connected electrically
to the test set. For any particular application it may be necessary to use a probe of particular
design so that a sound beam is injected into the material at an angle normal to the expected
defect. In certain applications a wheel probe, consisting of a transducer mounted inside an oil-
filled plastic tyre, has been found suitable for high speed automatic scanning.


Reference Standards
Reference standards are used for:
 (i)      Calibration of ultrasonic testing equipment
(ii)    Compare test indications of ultrasonic inspection material against defects (real or
         artificial) of known size must be specified with the applicable reference number.


3.2.2   EXPERIMENTS(7&8)


3.2.2.1 PROCEDURE AND OBSERVATIONS
        Ultrasonic testing is a non-destructive procedure looking for defects or breaks within
        materials which can transmit sound at high frequency in these materials, land quality,
        voids, cracks, inclusions, porosity can be found throughout the work piece.
        As described earlier, in ultrasonic testing an electric pulse is applied to a piezo-electric
        crystal, which causes it to vibrate. When this vibration is applied to a sound transmitting
        material, a mechanical wave is caused in the material until stopped or reflected by a break
        or edge. The reflected energy is found by the same or a different crystal. These detected
        signals are applied to an amplifier & visually presented on a cathode ray tube. This
        presentation is then analysed to give the size, location & other property of the break or
        edge.
        The above NDT method was employed to check internal health of V2500 engine fan
        blades. These fan blades are Hollow Titanium Hives with Aluminium Honeycomb Core
        which are bonded together to form integral structure & are of Wide Cord type for
        improved aerodynamic efficiency & for improved F.O.D resistance. I associated in
        carrying out ultrasonic inspection on two of such fan blades in the jet overhaul shop &
        their detailed inspection reports are as follows.


        (I).    Engine fan blade part no. 6A7650 serial no. 23475 removed from V2500 engine
        serial no. V0079 following shop visit inspections were carried out.
(A)After thoroughly cleaning the fan blade, I carried out ultrasonic inspection of fan
        blade dovetail root flank (M/s IAE engine manual task 72-00-00-200-011). The following
        procedure was employed after calibrating the ultrasonic testing equipment
        COMAT 06-148 ultrasonic couplant was applied to the concave surface of blade root
        flank.
(i)      Ultrasonic probe was positioned at front of the leading edge of concave blade root flank
         & the probe was moved along full cord width of the blade. The signal was monitored
         carefully on the display to ensure that signal greater than 60% of screen height between
         4.5 & 5.5 division lines on time base is not produced which is criterion for blade
         rejection.
(ii)     Same procedure was repeated for convex blade root flank.
(iii)    Both concave & convex blade root flank inspection were found satisfactory.


                             Fig. 3.11 Ultrasonic C-scan Inspection
(B) I Carried out C-scan inspection of fan blade aerofoil (M/s IAE engine manual task
          72-00-00-200-013). The following procedure was employed after calibrating the C-scan
          ultrasonic equipment as follows (Refer Fig. 3.11).:
(i)         Switched on the system & 30 minutes system warm up time given
(ii)        Entered relevant details of engine & blade serial no. & logged on to the system
(iii)       Checked the probe alignment as follows:
a) Checked the front face of the probe holder is parallel to the end of the tank, by placing a
        ruler on the front face of the end of the tank. If not parallel, loosen the grub screw & twist
        the holder to correct the error.
b) Checked for air bubbles under the probe as follows:
c) Removed the probe from the holder & whilst the probe is in the water gently wipe the probe
        face & holder to remove any air bubbles
d) Selected the CALIBRATE icon.
e) Loaded the calibration blade QC6808
f) Scanned the calibration blade QC6808
g) Typed ‘TEST’ in the serial number box & then selected ‘CALIBRATION BLADE’ from
        the BLADE TYPE box & scanned the calibration blade again. The system will now reject
        the calibration blade.
h) Every four hours, the calibration blade was loaded & tested to ensure the system has not
        drifted, then the aerofoil of the L.P Compressor blade was examined as follows:
i) V2500 blade to be inspected was selected.
j) Entered the details of blade to be scanned like serial no., part no., engine serial no.
k) Scanning of the blade done
l) Scanning accepted the blade & as such passed the subject inspection.
m) If the blade is rejected in the C-scan, the system prompts the archive of the blade C-scan
        data to an archive directory for future records.
Fig. 3.12Ultrasonic Tap Test Technique
       (C) I Carried out TAP Test of the subject fan blade (Transient Acoustic Propagation) to
       examine the fan blade internally (M/s IAE engine manual task 72-00-00-200-010) using
       Transient Accoustic propagation (TAP) tester as follows (Refer Fig. 3.12):
(i)    Carried out the system check of the TAP tester by connecting the dedicated probe to the
       tester. Carried out the functional check of the TAP test set ensuring the TAP test block
       value shown on the tester display is in the range of values engraved on the side of the tap
       test block.
(ii)   Applied small quantity of COMAT 06-148 ultrasonic couplant to the lower convex
       aerofoil adjacent to the annulus filler line & attached the probe to the fan blade. Pressed
       the ‘ON’ switch & then pressed the ‘EXE’ switch (Execute). The display showed the
       value within approx. 4 seconds. The number displayed was 490 db/sec. Hence blade
       ‘passed’ the TAP test. If the number displayed is > 700 db/sec, the blade is to be
       rejected.


       Refer Appendix VI for Inspection Report of Fan Blade S.No. 23475


       (II) Similarly, Engine fan blade part number 6A7649 serial no. 43786 removed from
       engine serial no V0072 shop inspection were carried out & the ultrasonic inspection of
       dovetail root flank of the blade, C-Scan and tap test inspection of the blade were carried
& all the tests were satisfactory. As such this blade also passed all the ultrasonic
inspection checks. (Copies of inspection schedules of both the blades are enclosed for
ready reference).


Refer Appendix VII for Inspection Report of Fan Blade S.No. 43786
4. RESULT AND DISCUSSION
4.1   While carrying out H.F.E.C. inspection of the main wheel assembly hubs, the various
      types of sub-surface and surface flaws observed are crack at the hub flange attachment
      holes, crack between the wheel nozzle hole and flange attached hole, sub surface/surface
      crack at the blending area of the vent holes of the hub, fine crack initiation at the groove
      formed by the circlip flange, crack at the corner formed by flange and the web (Area of
      sudden change of cross section causing stress concentration) and cracks in the hub bead
      area.
      (Refer attached figure of inner (Fig. 4.1) and outer (Fig. 4.2) main wheel hub assemblies
      with typical crack locations).


                            Fig. 4.1Cracks in the inner hub area
Fig. 4.2 Cracks in the outer hub Area
        As per the available date, there is about 1 to 1.5% wheel hub rejection due to the above
        described defects in a year.


4.1.1   The inspection results of the failed main wheel hub assemblies were studied and the
        following preventive measures are suggested to minimise these failures
 (i)     Cracks between the nozzle & tie bolt holes are normally starting from the nozzle. These
         tyre charging nozzle assemblies are of hexagonal cross-section with sharp corners. The
         sharp corners of hexagonal section cause notch formation and then result in crack
         initiation. To obviate these cracks, the sharp edged at corners of the hexagonal section of
         the nozzle should be rounded-off thereby eliminating the causes of crack initiation.
 (ii)    Cracks between the tie bolt holes are traced to their unequal torquing. To obviate these
         cracks equal torquing of the tie bolts in criss-cross manner i.e. (proper sequence
         diagonal torquing) is suggested.
(iii)    Surface/Subsurface cracks of approx. 1 to 2 mm at the cooling holes of the wheel hubs
          were observed. These can be eliminated by the grinding of the crack area and restoring
          the surface finish by alodine treatment and subsequent primer/ paint of the surface.
 (iv)     Bead area cracks are mainly due to pitting and stress corrosion of the area due to high
          level of stress accompanied with some moisture in the tyre inflating nitrogen. To obviate
          these cracks, it is suggested that the tyre filling nitrogen should be moisture-free. The
          pitting of the bead area should be critically monitored and same should be removed by
          smooth grinding. The surface protection be restored by alodining and subsequent
          primer/ paint. By removing the pitting damage, we shall be eliminating the cause of the
          crack initiation. Moreover, it is suggested that a water base paint be applied in this area
          (Resin + Hardener + Water) which will give great resistance to this area against pitting
          corrosion.
 (v)      Cracks in the web area are observed at very few occasions and the matter has been taken
          up with the hub manufacturers to improve the surface treatment of the area or change in
          the alloying elements of Aluminum to improve its fatigue strength. The matter is under
          study by the hub manufacturers.


4.2      The various ultrasonic inspections were carried out on two of the different V2500 engine
         fan blades & no defect was found in any of these inspections.
4.2.1    However, after studying the shop reports of the fan blades in the last one year, I observed
         that there were few engine fan blade rejections due to their failure in dovetail root flank
         inspections. Similarly, few fan blades were rejected due to their failure in ‘C-scan’ &
         ‘Tap-test’ inspections.


         The following preventive measures are suggested on the on wing engines and during
         scheduled and unscheduled shop visits of the engines:-
 (i)      It is suggested that the subject engine fan blade NDT inspections must be done more
          frequently to detect these hidden defects. As these initial defects if not detected timely
          will propagate in service & could result in fracture of fan blade and subsequent
          extensive internal damage to the engine. These NDT inspections must be done on on-
          wing engines during all major maintenance checks of the aircraft and during scheduled
          & unscheduled shop visits of the engines in the overhaul shop.
(ii)    The special bird-strike/FOD schedules must include an item of NDT inspection relating
        to fan blades – specially the fan blade root area NDT inspections.
(iii)   Whenever any engine fan module (N1) high vibration is reported, the subject NDT
        inspections of fan blades (specially the blade root area) must be called out.
5.     CONCLUSION
(i)     After studying the various NDT techniques, their applications, advantages & limitations,
        I have concluded that NDT is a very important tool for the modern production,
        maintenance & process industry. It helps in a great way to operate these industries
        economically, safely with high reliability & produce quality end-products. This is the
        ultimate goal of any industry.
(ii)    Regarding high frequency eddy current inspection of the aircraft wheel hubs, the various
        defects observed were studied & their remedial measures have been suggested after
        studying these problem areas.
(iii)   Similarly, various ultrasonic inspections of engine fan blades can pinpoint a smallest
        possible hidden defect, the continuance of which can cause a catastrophic failure or an in
        flight shut down of the engine. As such more frequent on wing and shop NDT
        inspections of the fan blades have been suggested. These inspections have also been
        suggested during reported engine F.O.D / Bird ingestion or in case of reported high fan
        module (N1 rotor) vibrations.
(iv)    Above remedial measures if carried out scrupulously shall go a long way in improving
        the in-service reliability of aircraft wheel hub assemblies & engine fan blades.
6. REFERENCES

1. Civil Aviation Authority, U.K., Civil Aircraft Inspection Procedure Non–Destructive

   Examination – Eddy Current Methods – Chapter bl/8-8    Issue 1,   page 1-14, 1973.


2. Civil Aviation Authority, U.K., Civil Aircraft Inspection Procedure Non–Destructive

   Examination – Ultrasonic Flaw Detection – Chapter bl/8-3   Issue2,   page 1-12, 1971.


3. Non-Destructive Testing, Robert c. Mc Master, The Ronald Press Company, London,         page

   16-34, 1963.


4. Non-Destructive Testing, William e Schall, Machinery Publication Ltd., London,          page

   28-56, 1968.


5. Eddy Current & Ultrasonic Testing (snt-tc-1a), Satyakiran School of NDT, New Delhi,

   page 3-96, 1996.


6. Component Maintenance Manual of Main Wheel Assembly – A320 Airbus Aircraft., Messier

   Hispano Bugatti, Spain,   page 501-511, 2003.


7. V2500 Engine Maintenance Manual, International Aero Engines, U.S.A,      page 1-10, 1998.


8. V2500 Engine Service Bulletins & Inspection Procedures, International Aero Engines,

   U.S.A,   page 1-10, 1999.
7. APPENDIX

various nondestructive testing techniques and their inspections on aircraft structures.

  • 1.
    STUDY OF VARIOUSNON-DESTRUCTIVE TESTING TECHNIQUE & APPLICATION OF THESE TECHNIQUES TO INSPECT AIRCRAFT WHEEL HUBS & AERO ENGINE FAN BLADES & SUGGEST REMEDIAL MEASURES. By KARAN DUGGAL Under the Guidance of Professor O.P.CHAWLA DEPARTMENT OF MECHANICAL ENGINEERING INSTITUTE OF TECHNOLOGY & MANAGEMENT, GURGAON, HARYANA (AFFILIATED TO M.D. UNIVERSITY, ROHTAK, HARYANA, MARCH 2005)
  • 2.
    CERTIFICATE This is tocertify that the project entitled “Study of various non-destructive testing techniques and application of these techniques to inspect aircraft wheel hubs & aircraft engine fan blades & suggest remedial measures” is submitted by Karan Duggal as his final year major project the work is based upon his work under the supervision of Dr. O.P. Chawla and neither his project report nor any part of it has been submitted for any degree or any other academic award anywhere before. Professor O.P. Chawla Department of Mechanical Engineering, ITM, Gurgaon.
  • 3.
    ACKNOWLEDGEMENT I would liketo thank and express gratitude to my project guide Dr. O.P. Chawla for all his assistance and guidance, which came forward at the advent of our difficulties and problems. With his guidance & help and his positive approach towards furthering the problems, it would not have been possible on my part to successfully complete this project. I would like to express my gratitude to Sh. T.C. Sharma, Chief Manager Accessories Overhaul Shop, Sh. R.K. Sharma, Chief Manager Jet Engine Overhaul Shop, Sh. S.N. Garg, Sh. R.K. Arora & Sh. Vivek Inspection Engineers Accessories Overhaul & Jet Overhaul Shop, Indian Airlines Northern Region, I.G.I. Airport Terminal II, N-Delhi. With their valuable support & on the job practical guidance, I could succesfully complete this project. I would also like to thank all the engineering staff of N.D.T. Section of Accessories Overhaul & Jet Overhaul Shops, Indian Airlines, Northern Region, I.G.I Airport, Terminal II, N-Delhi for all their help and assistance which helped me to complete this project successfully. I also thank the college faculty and staff (Mechanical Engineering Department) for all their help and valuable support for helping me to execute this project successfully.
  • 4.
    ABSTRACT The aim ofthe project is to study the various Non-destructive methods being used in the modern manufacturing, overhaul & servicing industry. High Frequency Eddy Current N.D.T inspection of A320 Airbus main wheel hub assemblies were carried out to identify the surface & subsurface cracks in their critical areas. The problem areas were studied & remedial measures were suggested to minimise such failures. Ultrasonic N.D.T inspection of the fan blades of M/s IAE V2500 Turbo fan engine installed on A320 Airbus Aircraft were studied and problem area of fan blade root flank area debonding & propagation of fine cracks was identified. This subject report emphasizes the need to identify such defects in order to obviate in service failure of fan blade which adversely affects the in-service reliability of the on-wing engines. The desired suggestion emphasizes on carrying out more frequent on-wing N.D.T Inspections of these fan blades, detailed inspection of fan blades during shop visit & overhaul of these engines and their N.D.T inspections whenever any bird hit or F.O.D (Foreign Object Damage) is reported or observed.
  • 5.
    SUMMARY The subject matterfor the final year major project is the study of various non-destructive testing techniques being used in the present manufacturing, overhaul & service industry. Also, their important, applications, limitations, relative advantages & disadvantages were also studied. Further, as a specific application of NDT methods, study of High Frequency Eddy Current (H.F.E.C) inspections of A320 Airbus Aircraft main wheel Hub assemblies was carried out under the guidance of N.D.T specialists of aircraft accessories overhaul shop, Indian Airlines, N.R. The defects so observed were studied in depth & remedial actions suggested to minimize such failures in future. Continuance of these defects in service without detection could result into uncontained failure of the component endangering the safety of the aircraft in-service. Similarly an another application of NDT methods regarding Ultrasonic Inspection of Aero engine fan blades root flank area & its tap test was done to find out a debond or a crack in this area to reject such a fan blade. Continuance of this defect in service could lead to fracture of the blade from the root area causing consequent extensive internal damage to the engine and a serious flight safety problem. To prevent such in service failure, I suggested more frequent on wing engine fan blade root flank & tap test N.D.T Inspections during major maintenance checks of the aircraft. These inspections during scheduled and unscheduled shop visits of the engines were also suggested to be done scrupulously. I also suggested to carryout these NDT inspections of fan blade whenever there is any reported or observed engine bird-strike or any time high engine fan blade vibrations are reported. These preventive NDT inspections in the critical areas prone to high fatigue stresses in the areas of high stress concentration can prevent an impending failure of component/system, thereby improving the component/system in-service reliability.
  • 6.
    CONTENTS Certificate Acknowledgement Abstract Summary 1. INTRODUCTION 1.1 Non-destructive testing techniques and their importance 1.2 Application of N.D.T 1.3 Motivation behind this project 1.4 Consolidation of work 2 LITERATURE REVIEW 2.1 Review of books and journals 2.2 Different non-destructive testing techniques 2.2.1 Visual testing technique 2.2.2 Radiography technique 2.2.3 Magnetic particle inspection 2.2.4 Penetrant (Dye & inspection fluorescent) Inspection 2.2.5 Ultrasonic inspection 2.2.6 Eddy current inspection 2.3 Relative advantages & disadvantages of various NDT methods. 3. EXPERIMENTAL SETUP / SHOP TESTING 3.1 N.D.T Inspection-High Frequency Eddy Current Inspection of main wheel hubs of A-320 Airbus Aircraft 3.1.1 Instrumentation 3.1.2 Experiments 3.1.2.1 Procedure and Observations
  • 7.
    3.2 NDT Inspection-Ultrasonic Inspection of L.P. Compressor fan blade of M/s IAE V2500 Engine installed on A320 Aircraft 3.2.1 Instrumentation 3.2.2 Experiments 3.2.2.1 Procedure and Observations 4. RESULTS AND DISCUSSIONS 5. CONCLUSION 6. REFERENCES 7. APPENDIX
  • 8.
    1.1 INTRODUCTION N.D.T isthe technology of assessing the soundness & acceptability of an actual component without affecting its functional properties. Non-Destructive Testing is exactly what its name implies i.e. testing without destroying. Therefore, N.D.T. is an examination of an object or material in a way which will not impair its future usefulness. N.D.T. is the use of technology for inspecting the materials to known standard. Since Non-Destructive Testing do not in any way impair the serviceability, therefore these can be applied, if desired, on all the units produced. Consequently, there is great reliability in the production. 1.2 APPLICATION N.D.T. Tests are done for detecting discontinuities which might be inherent, develop during processing or during in-service. Inherent cast discontinuities relate to inadequate feeding, gating, excessive pouring temperature or entrapped gasses. Processing discontinuities are usually related to various manufacturing processes such as machinery, forming, extruding, rolling, welding, heat treating and plating. While service discontinuities relate to various in-service conditions such as stress corrosion, fatigue & erosion etc. and are mainly due to design deficiencies, material imperfection, processing deficiencies, assembly errors and due to in-service deterioration. Non-destruction testing is an important part of preventive maintenance programme by identifying a failure or an impending failure, NDT programmes help in the safety of the person, plant & equipment and adds to the economy by preventing a major break-down. NDT is an important tool in the present advance manufacturing, assembling, processing, overhauling and maintenance industry and plays an important role in the development and improvement in the end product of the company. NDT Techniques are useful in determining critical spots (weak) in manufacturing operations right from receiving inspection to end item inspection. It helps to establish and measure quality and acceptance limits at the various stages of manufacturing thereby useful in development and improvement of material & process for fabrication. NDT methods help in determining service life of the components. It is useful for failure analysis and suggests remedial measures to prevent such failures in future. NDT is used for in-service
  • 9.
    inspections to determinecracks due to fatigue damage/creep, corrosion damage, de- bonding/delaminating of composite materials. As a part of ‘On-Condition’ maintenance management programme, NDT methods are done in- service on complicated assemblies without their disassembly & health of such critical components is continuously monitored by carrying out these Non-destructive tests. Acceptable parts with very high fabrication cost are not lost after testing. Since these tests are rapid, quick and reliable, these are most suited for high rate production part when tests are to be done on entire batch. The success of NDT method depends upon the knowledge of various type of engineering material one comes across, the process by which the component is made of and the probable stages at which the defect may creep-in. In Non-Destructive Testing language the word ‘defect’ is correctly applied only to a condition which will interfere with the safe or satisfactory service of particular part in question. A discontinuity will be a defect only when it interferes with performance of the part or material in its intended service. Non-destruction evaluation is the art of developing NDT techniques, arriving at acceptance standard for components for which nothing is available to start with. The various defect/discontinuous which can be determined by different NDT Techniques include detection of surface and Sub-Surface Cracks, Blowholes, Weld Penetration Deficiencies, Detection of Grain Size Variations, Heat Treatment Deviations, Machining Defects, Plating Defects, Inclusions, Pits & Porosity etc. It also helps to determine chemical composition & thickness measurement of piping and pressure vessels. These defects normally arise from initial production of the raw material or during conversion of base or raw material into manufacturing components. In-service defects could arise due to components operating under extreme conditions, inadequate preventive maintenance programme of the components/systems or due to some external cause like F.O.D. (Foreign Object Damage)
  • 10.
    1.3 MOTIVATION BEHINDTHE PROJECT My major objective to select “Study of various N.D.T. Techniques” as a project is due to its vast applications in the Modern Production, Process and Maintenance Industry and to enhance my knowledge on this subject matter due to my keen interest in aviation maintenance and overhaul industry where N.D.T. Technique is a very important tool for preventive maintenance management programme. Moreover this type of industrial project work will strengthen my knowledge & confidence in the area of my choice & help me in my career growth. 1.4 CONSOLIDATION OF WORK 1. Chapter 1 deals with Non-destructive testing techniques, their importance, applications of N.D.T, motivation behind this project and finally it ends with consolidation of project work. 2. Chapter 2 deals with review of books, journals and manuals used for this project report. This report also describes about various Non-Destructive testing techniques such as Visual testing, Radiography, Magnetic particle inspection, Dye Penetrant Inspection, Ultrasonic inspection and Eddy current inspection technique. Finally, comparison of relative advantages & disadvantages of various NDT methods have been discussed briefly. 3. In chapter 3 as per the reference manuals, important details of High Frequency Eddy Current N.D.T Inspection technique of main wheel hubs of A-320 Airbus Aircraft and Ultrasonic Inspection technique of turbo fan jet engines wide-cord fan blades (Titanium Alloy Skin with Aluminium Alloy honey comb core) have been discussed in detail. In the instrumentation, various important features and working of instruments viz Defectometer and Meccasonic used in these N.D.T techniques have been described. These details also include calibration procedures of these instruments. 4. In chapter 4 results and discussions include description of various cracks/ flaws on different areas of main wheel hubs and turbo engine fan blade structure of A320 Airbus aircraft.
  • 11.
    This chapter alsodescribes about the various remedial measures suggested to minimise these failures for smooth engine performance and to improve the inservice reliability of aircraft wheel hubs. 5. Chapter 5 conclusions mentions about importance of various N.D.T techniques being used in the present manufacturing, processing and maintenance industry. It also mentions about importance of High Frequency Eddy-Current N.D.T method on aircraft wheel hubs and ultrasonic inspection technique on engine fan blades to improve the components and system reliability. 6. List of references used 7. Appendix
  • 12.
    2. LITERATURE REVIEW 2.1 Review of books and journals CIVIL AVIATION AUTHORITY, UK (1) describes about Eddy Current applications, its principles of operations, Eddy Current tests, probes types, coil arrangements and types of circuits used. This leaflet gives guidance on the use of Eddy Current equipment for detecting cracks, corrosion and heat damage detection, for measurement of coating thickness or for sorting material. Elementary theory of Eddy Currents is included to show the variables which are being measured and to indicate interpretation of results which may be necessary for particular applications. This document also describes about advantage and limitations of this NDT techniques. It also describes how the size and shape of test specimen may affect these inspection results which can be overcome by probe design, equipment calibration, frequency selection or the use of jigs to maintain the probe in a particular relationship to the material surface. This document also describes in detail effect of frequency selected and its importance while carrying out this NDT inspection. It also describes about the effect of LIFT-OFF and its compensation while accomplishing this procedure. This leaflet also describes the details of the various types of probes like surface probes, hole probes, special probes and their different usage in Eddy Current inspection. CIVIL AVIATION AUTHORITY, UK (2) gives general guidance on the application and scope of ultrasonic sound waves for detecting surface and internal flaws in material and parts and for measurement of thickness. This document describes that ultrasonic inspection is the only satisfactory NDT method when a distant defect lies parallel with the only available surface of the component. It emphasizes the need for properly trained and qualified operator for using the ultrasonic equipment. This document describes about the various applications of ultrasonic methods prior to fabrication, during manufacturing processes, during periodic preventive maintenance checks to find out fatigue cracks and other defects arising from operating conditions. It describes about how the ultrasonic waves are produced and what is piezoelectric effect. This document describes in detail about various methods of operation of ultrasonic NDT techniques like Transmission Method, Pulse Echo Method, Immersion Testing And Resonance Technique etc,. This
  • 13.
    document also describesabout the choice of frequency for carrying out this test on different material of different size and shape. This document emphasizes the most important applications of ultrasonic NDT technique for its usage for in-situ examinations and particularly for detecting corrosion damage which can be found in areas not accessible for visual examinations. It is a useful NDT method for finding delamination/debonding of non metallic composite material parts. ROBERT C Mc MASTER (3) describes NDT techniques like Fluorescent Penetrant Processes, Magnetic Flaw Detection Methods, Radiological Examination of the parts, Electromagnetic Methods, Endoscopic Methods and Ultrasonic Methods. It describes about the principle of operation of the particular NDT method, its application, advantages and limitations. It also describes how these NDT methods are extensively being used in present industries and how it will be useful in future advancement in technology. WILLIAM E SCHALL (4) describes about the various types of flaws/ defects occuring right from raw material to finish goods stage and how NDT techniques are useful at various stages of production for economical, reliable and safe operation of the industry. It defines the various types of surface and sub surface defects and appropriate NDT technique to detect such defects. It also describes about the accuracy and limitations of particular NDT method. It also describes about the need for proper training and experience to become a good NDT engineer. Above all, it also mentions about the high capital cost involved for procuring the NDT equipments and running cost involved to keep it going. In reference (5) EDDY CURRENT AND ULTRASONIC TESTING describes about the elementary theory of electromagnetic induction, principles of Eddy Current and Eddy Current Test Systems, the test frequency and distribution of Eddy Currents. This document also mentions about various methods of Eddy Current testing and their requirements. It also describes about various applications of electromagnetic testing and depth of penetration of Eddy Current for various materials. Ultrasonic inspection describes about basic characteristics of sound, principle of wave propagation and
  • 14.
    generation of Ultrasonicwaves. Various methods of Ultrasonic testing are explained in details which includes ultrasonic test equipments-ultrasonic tester, test probes, couplants, reference standards, scanning devices and recording systems. Effect of surface finish on correct movement of sound waves is also described. In reference (6) COMPONENT MAINTENANCE MANUAL, MESSIER HISPANO BUGATI, ITALY describes in details about the inspection procedure of all the parts of main wheel assembly which includes inner and outer hub assemblies. It specifies the need of thorough cleaning of the parts before their detailed visual inspection and mandatory use of 10X magnifying glass for this method of inspection. This document specifies the type of damage and area of damage expected during this inspection such as dents, nicks, scores, notches, corrosions or cracks. Besides it also specifies the need of carrying out NDT inspections of the critical areas of the inner and outer hub assemblies. This document also specifies the requirement of additional items of inspection in case of tyre burst, tyre deflation/ overheating etc. In reference (7) V2500 ENGINE MAINTENANCE MANUAL describes about the general inspection of flaws, debonding and wall thickness measurements using Ultrasonic Inspection. This document describes about the safety precautions, the equipment required (viz High Frequency Ultrasonic Tester, Meccasonic D125 BJ or D325 BJ, 25 MHz Focused Immersion Probe, Calibration Standard Specimen, Visual Display Units, etc,.) for this method of N.D.T. It also decribes in details the calibration and inspection procedure using the above test equipments. Finally, this document emphasizes the need for proper training and experience for carrying out the above inspections and interpretations of test results. In reference (8) V2500 ENGINE SERVICE BULLETINES AND INSPECTION PROCEDURES describes about following inspections/ checks of engine low pressure compressor fan blades:-
  • 15.
    (i) Examination of engine fan blades internally using Transient Acoustic Propagation (TAP) tester. (Reference 8) (ii) Procedure for Ultrasonic inspection of root debond of engine low pressure compressor fan blades (Reference 8).. (iii) Procedure for the C-SCAN inspection of the engine low pressure compressor fan blades (Reference 8). The subject document gives in detail, the equipment and material required for carrying out the particular item of inspection as described above. The procedure for carrying out the above inspection items have been given in details. Finally the document describes about the analysis of results so obtained including the criterion of the acceptance or rejection of the part under test.
  • 16.
    2.2 Different types of Non-Destructive testing methods:- 2.2.1 Visual Testing Technique (3) Visual aids can be employed to detect many types of different defects such as surface cracks & their orientation, weld defects, potential sources of weakness such as notches or misalignment and oxide film formation etc. The commonly used visual aids to detect these flaws are mirrors, magnifying lenses, microscopes, telescopes, enlarging projectors, Comparators, Boroscopes, Photoelectric Systems, Fibre Optics, Image intensifier and Closed Circuit Television (C.C.T.V.) etc. Some of these special visual aids are explained herebelow:- (i) Boroscope (3):- These are instruments designed to enable an observer to inspect inside of a narrow tube, bore or a chamber. These are precision built optical systems with arrangements of prisms and lenses to provide light with maximum efficiency. (ii) Fibre Optic Scanners (3):- Fibre optic scanning tubes are used to examine inaccessible areas & areas of dangerous environments. Optical fibres transmit light by the phenomenon of total internal reflection. (iii) Miniature C.C.T.V. (3):- A technique of inspection of turbine blades, turbofans, turboshafts and other components 'In-situ' without any disassembling. Direct viewing through Boroscope inserted through parts in the engine assembly mounted on wing or on test rig requires prolonged inspection often under difficult and uncomfortable conditions. An improvement has been introduced of miniature C.C.T.V. camera equipment coupled with boroscope & light sources appropriate to the type of engine. The results may be transmitted to remote monitors of video recorders.
  • 17.
    2.2.2 RADIOGRAPHY TECHNIQUES (3&4) 2.2.2.1 RADIOGRAPHY GAMMA RAY INSPECTION (3&4) It is projecting a three dimensional object on a plane with the help of GAMMA RAYS penetrating radiations resulting from disintegration of radioactive materials. Gamma- radiations is not in the same form as X-rays and consists of one or more discrete wavelengths in what is known as a 'line spectrum'. The relative intensities of each wavelength are always the same for a particular material. The four mostly used isotopes are Cobalt60, Iridium192 and Thulium170 etc. Radioactive gamma ray sources consist of a circular disc or cylinder of radioactive material encased in a sealed Aluminium or Stainless Steel Capsule. The capsule is kept in a container made of lead or deplated Uranium which will substantially reduce the emission of Gamma rays. This technique is normally used when there is lack of space or access for X-ray equipment. 2.2.2.2 RADIOGRAPHY X-RAY INSPECTION (3&4) This particular form of electromagnetic radiation is produced when electron travelling at high speed collide with matter in any form. The basic requirements for the production of X-rays are a source of electrons, a means of accelerating the electrons to high speed and a target to emit the X-rays. The X-ray tube in an evacuated chamber in which the electrons are derived from a filament, set in a focussing cup & heated to incandescence by a low voltage current, electrons are released and form 'space charge' around the filament. When a high potential is applied, electrons accelerate from the filament (the cathode) to the anode and strike the target which then emits the X-rays (refer fig 2.1 for typical circuit of an X-ray production set) The films used in radiography are very similar to those used in photography except that the emulsion covers both sides of the flexible transparent base. The emulsion is sensitive to X-rays, Gamma rays & light and when exposed to these radiations a change takes place in its physical structure. When treated with developer, a chemical reaction results in formation of black metallic silver which comprises of the image. Both the radiographic techniques are used to detect internal defects and variations, porosity, inclusion, cracks, lack of fusion geometry variations, corrosion damage, thickness measurement, determining mis-assembly and mal-alignment. It is used for the
  • 18.
    inspection of boilertube thinning due to corrosion or erosion in power plants, castings, weldments, and small thin complex wrought products. It is also used to check for dis bonding/ delamination of non metallic, electrical assemblies, composites, solid propellant rocket motors and water entrapment in the honeycomb structures. Gamma Ray Inspection is often used for examination of internal features of turbine engines such as the main rotor shaft and turbine hot section inspection of Nozzle Guide vanes and rotor blades. FIG 2.1 Circuit diagram of X-Ray N.D.T Technique
  • 19.
    2.2.3 MAGNETIC PARTICLE INSPECTION (4) This NDT process is normally applied to homogeneous ferromagnetic materials which can be easily magnetized. This NDT method is suitable for detecting surface and subsurface cracks. If a component is subjected to a magnetic flux, any discontinuity in the material will distort the magnetic field and cause local leakage fields at the surface. Particles of magnetic material applied to the surface of the magnetised component will be attracted to the flux leakage areas and reveal the presence of the discontinuity. The sensitivity of magnetic flaw detection depends largely on the orientation of the defect in relation to the magnetic flux and is highest when the defect is at 900 to the flux path. Sensitivity is considerably reduced when the angle between the defect and the flux path is less than 450 so that two tests are normally required with each component, the flux path in first test being at 900 to the flux path in the second test. Components of complex shape may require tests in several different directions. A component may be magnetised either by passing a current through it or by placing it in the magnetic circuit of a permanent magnet or electromagnet. The magnetic particles used to reveal defects are either in the form of a dry powder or suspended in a suitable liquid. They may be applied by spray, pouring or immersion depending on the type of component. Fluorescent inks are also used where high sensitivity is required. Inspection of the component, to which fluorescent inks has been applied, should be carried out under ultraviolet light. Particles of magnetic ink are attracted to flux leakage fields and these may occur at defects, brazed joints and heat affected zone in welds. Cracks are revealed as sharply defined lines on the surface of the specimen, the magnetic particles often building up into a ridge. So if a discontinuity is present at or near the surface, the magnetic field is deflected and forms a leakage field. Detection of this field by particle application forms the basis of this inspection. Finally, the tested component must be demagnetised after this NDT method is completed. This method is used for determining surface and subsurface
  • 20.
    cracks, seams, porosityand inclusions. It is extremely sensitive for locating small tight cracks of ferromagnetic materials, bars forging, weldments and extrusions. 2.2.4 PENETRANT (DYE & FLUORESCENT) INSPECTION (4) Penetrant dye processes are used mainly for the detection of flaws in non-ferrous & non- magnetic ferrous alloys but may also be used for ferrous parts where magnetic flow detection techniques are not specified or are not possible. The processes can be divided into two main groups. One group involves the use of penetrants containing an emulsifying agent (water washable process) whilst in the other group a dye solvent has to be applied separately after the penetration time has elapsed if the surplus dye is to be removed by water wash operation. Basically, this process consist of applying a red penetrant dye to the surface of the part to be tested, removing after the predetermined time the dye which remains on the surface and then applying a developer, the purpose of which is to draw to the surface the dye that has entered into defects, the resultant stains indicating the position of the defects. Surface preparation is most important for this method of NDT. The surface to be tested must be free from oil, grease paint, rust, scale, welding flux and carbon deposit etc. The penetrant dye can be applied to the surface by dipping, spraying or brushing, the method used depending largely on the size, shape and of quantity of parts to be examined. The dye penetration time is normally in the range of 5 minutes to 1 hour, the smaller the defect the longer the time necessary. Any dye remaining on the surfaces of the parts after expiry of penetration time should be removed as thoroughly as possible but without disturbing the dye which would have found its way into any defects present. The developer is usually very fine absorbent white powder suspended in volatile carrier liquid which rapidly evaporates and the action of absorbent powder is to draw out the dye from the surface defects, thus indicating their position by the resulting stain. Normally, the position of defects will be indicated by red marks appearing on the whitened surface.
  • 21.
    All parts withnon-absorbing surfaces (forging, weldments and castings) can be subjected to this NDT inspection for detecting defects open to the surface in solids and essentially non porous materials.URRENT INSPECTION 2.2.5 ULTRASONIC INSPECTION (2&5) 2.2.5.1 BASIC CHARACTERISTICS OF SOUND (5) (i) Frequency, sound velocity and wave length How does the sound travel from an oscillating membrane (e.g. loud-speaker) as transmitter to our ear as receiver? The oscillating membrane excites the neighbouring air particles into oscillations and pressure fluctuations occur. As the air particles are not rigidly but elastically connected to each other, we can use balls connected by springs as a model (fig. 2.2). With reference (fig. 2.3) zero (1st row) balls are at rest. The oscillating process is started by pushing the left ball to the left, moment I. As the left ball is connected to the neighbouring ball by a spring the movement is slowed down up to moment III and finally reversed. Due to the spring connection also the second and then successively all other balls at the right are being moved. A wave motion develops. Another examination of the figure shows that each ball oscillates around its rest position by a certain amount, i.e. merely the condition of oscillation propagates along the direction of propagation, Only the energy and not the mass is transported, In the period from moment III to moment XV the particle has carried out one complete oscillation. Fig. 2.2
  • 22.
    Fig. 2.3 Fig. 2.4 Figures depicting Propagation of wave The time required is the period of oscillation T. On the momentary representation XV we can see that particles zero and twelve are just experiencing their max. deflection to the left, i.e. they are in the same condition of oscillation, The distance between two particles which are in the same condition of oscillation is the wave length λ. With reference (fig. 2.4) shows that the condition of oscillation has propagated by the distance λ in the period T. Thus the following formula applies to the propagation velocity c: C=λ/T From the period of oscillation T the number of oscillations per second can be calculated by the formula F=1/T
  • 23.
    f is thefrequency of the oscillation, its unit is "number of oscillation/second". The unit is named after the physicist H. Hertz and is abbreviated Hz. Thus the following formula applies to the propagation velocity of the wave: C=fλ = 1/T * λ This equation (wave equation) applies to all wave processes. (ii) Definition of the term ultrasound The frequency of a sound impression (tone) is a direct measure for the pitch of a tone. The higher the frequency the higher the tone. The pitch of a tone which can be received by the human ear has an upper limit. For young people the limit is approximately 20,000 Hz = 20 kHz. Sound having higher frequencies is called ultrasound. Audible sound: f= 20 -20,000 Hz Ultrasound: f> 20,000 Hz = 20 kHz. As we have learned from the spring model an energy transport through a sound wave is possible only when constituent particles are connected to each other by elastic forces. In the case of the sound transmission from the loud-speaker to our ear, the air molecules serve as transmitting medium. Liquids and solid matter are also suitable media for the sound transmission, In the vacuum (space) no matter exists and thus no sound transmission is possible. The satisfactory sound conductivity of liquids and solid matter is nowadays technically utilised in various sectors. 2.2.5.2 PRINCIPLES OF WAVE PROPAGATION (5) (i) Types of Oscillations The sound propagation demonstrated by the spring model is possible in all media, It is characterized by the fact that the direction of oscillation of the particles runs along the direction of propagation of the wave. Thus zones with small particle distance and zones with large particle distance are created, Therefore, this type of wave is called compression wave or longitudinal wave. If we do not look at the momentary representation but at the dynamic process of the propagation of the longitudinal wave, we
  • 24.
    see that thecompressions and diminishing move through the test object at an unchanging distance. The velocity at which they move is the sound velocity C L of the longitudinal wave. This sound velocity is a matter constant, i. e. in a test object completely made of same material it can be considered constant. e. g. for steel: CL= 5920 m/s for aluminum: CL = 6300m/s In solid matter the density is very high as compared with that of liquids and gases, i.e. the distance between the atoms or molecules is very small. Moreover, they are arranged in a crystal lattice and the elastic linkage forces between the atoms (molecules) are particularly strong, Due to these two facts the sound can propagate in various ways in solid matter. We already became acquainted with one type of wave, namely the longitudinal wave. Another type of wave is called shear wave or transverse wave, In the case of a transverse wave the particle oscillate vertically to the direction of propagation of the wave. Now we look again at the spring chain. The wave is not excited into the direction of the chain but in cross direction. The springs pull the balls back into their starting position but due to their movement they oscillate over their rest position. At the same time these transverse oscillations are transmitted to the two neighbouring balls which also start oscillating, These oscillations are continued to be transmitted to the neighbouring balls due to the spring connections. Looking at the dynamic process of the wave train, we find out that both wave crests and wave toughs move through the test object at an unchanging distance. The distance between two neighbouring wave crests is the wave length. The energy trasmission of the transverse wave is lower due to the transverse oscillation of the atoms than that of the longitudinal wave. Therefore the propagation velocity of the transverse wave is considerably lower than that of the longitudinal wave, e.g. Steel: CL = 5920 m/s CT = 3250 m/s The velocity of the transverse wave, too, is a matter constant which is characteristic for the corresponding work piece.
  • 25.
    Longitudinal and transversewaves can propagate only through the whole volume of a workpiece. At the interfaces or surfaces of the work pieces further types of waves may occur. The surface wave or Rayleigh wave propagates only at the surface of the workpiece. 2.2.5.3. GENERATION OF ULTRASONIC WAVES (5) (i) Piezoelectricity Ultrasonic transmitters and receivers are mainly made from small plates cut from certain crystals (piezoelectric crystals) as shown in (fig. 2.5). If no external forces act upon such a small plate electric charges are arranged in a certain crystal symmetry and thus compensate each other. Due to external pressure the thickness of the small plate is changed and thus the symmetry of the charge. An electric field develops and at the silver-coated faces of the crystal, voltage can be tapped off. This effect is called direct piezoelectric effect. Pressure fluctuations and thus also sound waves are directly converted into electric voltage variations by this effect : the small plate serves as receiver. The direct piezoelectrical effect is reversible (reciprocal piezoelectrical effect). If voltage is applied to the contact face of the crystal the thickness of the small plate changes according to the polarity of the voltage the plate becomes thicker or thinner. Due to an applied high – frequency a.c. voltage the crystal oscillates at the frequency of the a.c. voltage. A short voltage pulse of less than 1/1 000,000 second (1 second) and a voltage of 300-1000 V excites the crystal into oscillations at its natural frequency (resonance) which depends on the thickness and the material of the small plate. The thinner the crystal the higher its resonance frequency. Therefore it is possible to generate an ultrasonic signal with a defined primary frequency. The thickness of the crystal is calculated from the required resonance frequency f0 according to the following formula: d= λ/2 = c/2f0
  • 26.
    c=sound velocity ofthe crystal f0=resonance frequency of the crystal d=thickness of the crystal λ=wave length Fig. 2.5 Piezoelectric Crystals A piezoelectric crystal occuring naturally is the quartz (rock crystal) which was used as crystal material in the beginning of ultrasonic testing. Depending on whether longitudinal waves or transverse waves are to be generated the quartz plates have either been saved vertically to the X-axis of the crystal (X-cut) or vertically to the Y-axis (Y- cut) out of the rock crystal. In modern probes quartz is hardly used, instead sintered ceramics or artificially produced crystals are employed. The most important material for ultrasonic crystal as well as their characteristics are stated in the Table 2.1 below : Lead zirconate Barium Lead Lithium Quart Lithium titanate titanate metaniobate sulphate z niobate sound velocity 4000 5100 3300 5460 5740 7320 acoustic impedance 30 27 20.5 11.2 15.2 34 z 106 kg/m2 electromechanic 0.6 – 0.7 0.45 0.4 0.38 0.1 0.2 coupling factor k piezoelectric modulus d 150-593 125-19 85 15 2.3 6 (Transmission/generatio 0 n) piezoelectric 1.8 – 4.6 1.1– 1.9 8.2 4.9 6.7 deformation constant H 1.6
  • 27.
    coupling factor for 0.5 – 0.6 0.3 0.07 0 0.1 - radial oscillations kp Table 2.1 Characteristics of various ultrasonic crystals The efficiency during the conversion from electrical into mechanical energy and vice versa differs according to the crystal material used. The corresponding features are characterised by the piezoelectric constants and the coupling factor. The constant d (piezoelectric modulus) is a measure for the quality of the crystal material as ultrasonic transmitter. The constant H (piezoelectric deformation constant) is a measure for the quality as receiver. The table shows that lead zirconate- titanate has the best transmitter characteristics and lithium sulphate the best receiver characteristics. The constant k (theoretical value) shows the efficiency for the conversion of electric voltage into mechanical displacement and vice versa. This value is important for the pulse echo operation as the crystal acts as transmitter and receiver. Here the values for lead zirconate-titanate, barium-titanate and lead meta niobate lie in a comparable order. As in the case of direct contact as well as immersion testing a liquid couplant with low acoustic impedance z is required the crystal material should have an acoustic impedance of the same order in order to be able to transmit as much sound energy as possible. Thus the best solution would be to use lead meta-niobate and lithium sulphate as they have the lowest acoustic impedance. A satisfactory resolution power requires that the constant kp (coupling factor for radial oscillations) is as low as possible. kp is a measure for the appearance of disturbing radial oscillation which widen the signals. From this point of view lead meta-niobate and lithium sulphate are the best crystal materials. The characteristics of the crystal materials described here show that no ideal crystal material exists. As lithium sulphate presents additional difficulties due to its water solubility the most common materials are lead zirconate- titanate, barium-titanate and lead meta-niobate. 2.2.5.4 Set-up of the probe (5)
  • 28.
    For the practicalapplication in the material testing, probes are used into which the piezoelectric crystal are installed. In order to protect the crystals against damage they are pasted on a plane-parallel or wedge-shaped plastic delay block; the shape of the delay block depends on whether the sound wave is to be transmitted perpendicularly or angularly into the workpiece to be tested. The rear of the crystal is closely connected with the damping element which dampens the natural oscillations of the crystal as quickly as possible. In this way the short pulses required for the pulse echo method are generated. The unit comprising crystal, delay block and damping element are installed into a robust plastic or metal housing and the crystal contacts are connected with the connector socket. Probes transmitting and receiving the sound pulses perpendicularly to the surface of the workpiece are called normal beam probes or straight beam probes. If the crystal is equipped with a wedge-shaped delay block an angle beam probe is concerned which transmits/receives the sound pulses at a fixed probe angle into/from the workpiece to be tested. In both probe types the crystal serves for the both the transmission and reception of the sound pulses. A third probe type comprises two electrically and acoustically separated crystal units of which one only transmits and the other receives the sound pulses. This probe is called Transmitter-Receiver Probe or twin crystal probe (fig 2.6). Due to its design and functioning, it is used for the testing of this material or detection of material flaws located near the surface of the workpiece. Fig. 2.6 Twin Crystal Probe 2.2.5.5 ULTRASONIC TEST EQUIPMENT (5)
  • 29.
    (i) Principle of the ultrasonic test instrument So far we know that, with the probe, we can transmit ultrasonic pulses into the workpiece. If this has two plane-parallel surfaces, the sound pulse will be reflected on the surface opposite to the probe and return to it. Our interest concerns the measurement of the pulse transit time. This time is too short to be measured mechanically. We therefore use a cathode ray tube or Braun tube as measuring instrument. The Braun tube contains a heater coil which brings the cathode K to glow whereby the so “eveporating” electrons are accelerated by a voltage between between cathode K and anode A. The result is an electron beam. The voltage at the wehnelt cylinder W focuses the electron beam and so makes it appear on the fluorescent screen F as a light spot. As the electrons travel to the CRT-screen, they pass two pairs of deflecting plates which are arranged perpendicularly to each other. If one applies a voltage to the horizontally orientated pair of plates then the electron beam will be reflected vertically. Analogue to this, the vertically oriented pair of plates serves for the horizontal deflection. (a) A-scan representation The standard application of the pulse echo method normally uses ultrasonic flaw detectors having a CRT-screen with A-scan representation. The A-screen shows the amplitudes of the echo signals in the vertical Y direction and the distance of the corresponding reflectors are represented in the horizontal X-direction. This allows a direct allocation between the echoes on the screen and the depths of the associated reflectors. (b) B-scan representation Especially for semi or fully automatic tests, the ultrasonic testing technique uses special instruments which allow a special type of displaying the test results. Instruments with B-scan representation display a cross-section of the test object on the screen after the probe has been moved on a scanning track running across the test object. The probe movement is mostly displayed in the X-direction while the distance of occurring reflectors is displayed in the Y-direction. (c) C-scan representation
  • 30.
    If the wholevolume of a workpiece is to be covered it is necessary to scan at least one surface completely. E.g. an automatic plate testing machine scans the whole plate using a great number of probes and a measuring scanning track. The test results can then be displayed by the C-scan representation for which one normally uses an X-Y recorder or a printer. The workpiece is represented in a top view in which the flaw locations can then be marked true-to-scale. The use of printer allows the indication of further information (e.g. the depths of reflectors, echo amplitudes) by means of various symbols. Fig. 2.7 C-Scan 2.2.5.6 Monitor function In a case of a manual test using an Ultrasonic Flaw Detector, the operator scans the workpiece with the probe and simultaneously observes the CRT-screen thereby concentrating on echo indications which originate from the interior of workpiece or, in other words, from the flaw expectancy range. The start and end of the flaw expectancy range can be there by be marked by means of a step on the base line of the screen or an additionally displayed bar on the screen. If now an echo appears within this range then this releases a visible and/or audible alarm signal. The response threshold of the monitor is also variable so that an echo indication only releases the alarm when it has reached a certain height. In addition to the monitor function, most of these instruments have a control output which can be used to further process the information.
  • 31.
    As soon asan echo appears within the monitor threshold, a voltage is fed to the control output which is proportional to the echo height and which can be immediately used for automatic recording. By means of this monitor function together with a path pick-up which is fixed onto the probe, C-scans of workpieces can be easily printed on an X-Y recorder. They can be regarded as test reports and filed. 2.2.5.7 Test mechanism (5) (Fig. 2.8) All cases where continuously large amounts of equal parts are tested are suitable for automatic testing machines. These consist essentially of one or several probes which are coupled to the test specimen by a control unit and are moved across the test object according to a predetermined scanning pattern. The ultrasonic signals are processed by the evaluation unit (e.g. an ultrasonic flaw detector) and displayed on a CRT-screen if available. All measured data are fed to a computer where they are further processed and evaluated. At the same time information about the probe position is also fed to the computer. The test report is produced by means of a printer. The computer controls additionally the marking and sorting device which marks the flaw locations on test objects. Test objects which have unacceptable flaws are rejected. A further task of the computer is to control the transport of the workpiece and to signal defined test conditions.
  • 32.
    Fig. 2.8 AutomaticUltrasonic testing machines (Block diagram) 2.2.5.7 METHODS OF ULTRASONIC TESTING (5) Fig. 2.9 Block diagram of ultrasonic testing technique Today, Non-destructive ultrasonic testing is applied. on a great variety of materials of different processing conditions and geometries. Refer Fig. 2.9 for a typical setup for ultrasonic test set.
  • 33.
    In order totest a certain workpiece for certain flaws it is not only important to choose a suitable probe but also the right testing method. (i) Direct contact testing Almost all non-automatic tests employ direct coupling, i.e. The operator moves the probe manually in direct contact over the surface of the test object. The acoustic coupling agent are oil, water, glycerine, wall paper glue, etc,. (ii) Straight-beam testing If a probe, which contains an X-cut crystal, is coupled to a workpiece a longitudinal wave pulse will be generated and transmitted into the workpiece. Straight-beam probes transmit the sound pulse perpendicular to the surface of the workpiece into the material (Refer Fig. 2.10). If the pulse that passes through the workpiece has plane-parallel surfaces then the reflected pulse returns to the probe and generates a signal (backwall echo) on the CRT-screen of the instrument. Only a small portion of the reflected pulse returns to the probe itself while the greater portion is reflected on the surface and passes through the workpiece a second time. This generates further backwall echoes on the CRT-screen. The speed at which the electron beam travels across the CRT-screen from the left to the right is set in accordance with a defined proportion to the sound velocity of the workpiece. If this proportion is known then the thickness of the workpiece can be directly read off by the distance between two sequential backwall echoes on the CRT- screen (Refer Fig. 2.11). To be able to set the above speed ratio the instrument must be calibrated. Fig. 2.10 Normal & Alternate Transmission Technique
  • 34.
    Fig. 2.11 PulseEcho Technique (a) Calibration: By means of the calibration it is possible to allocate the whole width of the CRT-screen to a defined distance range in the material to be tested. This distance range is designated the test range. For the calibration we use a plane-parallel calibration block which has a known thickness and must be made of the same material as the test object. (iii) Locating- reflectors: To test the workpiece we couple the probe onto its surface. If we have chosen a suitable test range we should now obtain the first backwall echo on the screen. If the first backwall echo is preceded by another echo then this echo comes from a reflector in the workpiece. For the evaluation we only use that range before the first backwall echo because in the range behind it secondary echoes may occur due to split transverse waves thus simulating a reflector in the workpiece. The operator's task is now to exactly determine the location of the reflector. By slightly moving the probe on the surface of the workpiece the reflector echo can be optimised (or maximised). At the probe position with the highest echo amplitude the reflector stands exactly on the central axis of the sound beam, i.e. perpendicular under the centre point of the probe. The last step is to determine the exact depth position of the reflector. The sound beam should strike reflectors perpendicularly If this condition is fulfilled the result will be a maximum echo.
  • 35.
    Using a straight-beamprobe it is impossible to detect reflectors which run inclined or perpendicular to the surface because the sound is not directly reflected to the probe. To be able to detect and evaluate this type of flaw one uses angle-beam probes. To transmit ultrasonic pulses inclined to the surface we glue an X-cut crystal, which generates longitudinal waves, onto a wedge-shaped perspex delay block. That sound portion which is reflected by the sole of the probe strikes a damping element which absorbs this unwanted sound portion. At the interface of the perspex wedge to the workpiece, the sound waves are refracted which may also cause a splitting of transverse waves so that, in this case, there can be two types of waves in the workpiece, namely longitudinal and transverse waves. Both of these two wave types are converted again into a longitudinal wave as they return to the probe. That means, every echo returning to the probe, regardless from which type of wave it originates, is always received by the crystal as a longitudinal wave echo so that it is impossible to decide whether it comes from a transverse or a longitudinal wave. However, due to this it would then also be impossible to locate a reflector since both types of wave propagate in the material in different directions and at different velocities. We therefore use a constructive trick to ensure that only one type of wave may occur in the testpiece. We choose an angle of incidence for the longitudinal wave in the probe so large that a longitudinal wave can no longer occur in steel where by βL is greater than 90° (total reflection). (iv) Testing with twin crystal probes (TR technique) Straight-beam and angle-beam probes are equipped with only one crystal which has both the transmitting and receiving function. Depending on the length of the delay line, this has the effect that the initial pulse is displayed either fully or partially on the CRT- screen, and, consequently, echoes from near-surface flaws are not definitely traceable (dead zone, initial pulse influential zone). In practical testing, however, we often meet
  • 36.
    with situations werewe have to test thin parts or where especially near-surface flaws are to be detected. In these cases, we use a probe with 2 crystal units which are electrically and acoustically separated, i.e. one only transmits sound pulses and the other one has only a receiver function. Each TR Probe crystal unit consists of a perspex delay line having the shape of a semi- cylinder. The crystal, which is semi-circular, is bonded to the delay line. Both crystal units, separated from each other by an acoustic separation layer, are built into a probe housing and are connected with 2 electrically separated sockets. An additional increase in sensitivity within the near-surface zone is attained by a slight inclination of the crystals towards each other. This angle of inclination, which we also call roof angle, varies in size from 00 to approx. 120 depending on the purpose of application and probe. If we wish to operate a TR probe in connection with an ULTRASONIC FLAW DETECTOR then the instrument must be switched to TR-operation (twin crystal operation). At one connection socket stands the initial pulse and at the other connection socket is the input of the amplifier (receiver). The ultrasonic pulses are generated in transmitter part of the probe and transmitted into the delay line. Echoes from the delay line, however, are not displayed on the CRT-screen due to the fact that the transmitter crystal has no receiving function. If we now couple the probe onto a plane parallel plate we then receive an echo because the sound pulse, being reflected on the backwall, is directed into the receiver part of the probe. The remaining wall thickness measurement on tubes and containers which are exposed to corrosion or erosion is one of the principal fields of application: The main advantage is the fact that the installations or plants to be tested do not need to be put out of operation and therefore no standstill losses will occur. The measuring accuracy is 1/10 mm with wall thickness from 0.5 mm onwards and measurements are possible on systems which have temperatures of up to approx. 5000 C.
  • 37.
    Twin crystal probesare often operated in combination with digital wall thickness gages. After coupling the probe a digital display indicates directly the wall thickness in mm, or inch. Due to the high sensitivity of twin crystal probes regarding the near-surface zone they are also suitable to trace very small flaw locations from a depth of approx. 0.6 mm. Twin crystal probes arc therefore employed for flaw detection on thin parts. (v) Through transmission The through transmission technique is the oldest method applied in ultrasonic testing. One probe is used to transmit sound into the test object and the other side receives it. Using this method we compare the sound intensity from a flaw-free zone with that from a flawed zone. A flaw in the sound field shades a portion of the sound energy off, so that the intensity measured at the receiver is lower as compared with a flaw-free zone. A disadvantage of this method is that no statement can be made regarding the depth and the extension of the flaw. Despite this disadvantage, the through transmission method is still in use, mainly for testing thin plates or saucer type test objects which are accessible on both sides and have flat flaws extending parallel to the surface. This concerns mainly plates of whole thickness range which have laminar defects, and short tubular bodies such as bearing bushes, laminated plastics and platting. To avoid high coupling variations these objects are normally tested in the immersion technique. If the test objects are not accessible on both sides but have plane-parallel surfaces, one can also employ the V-through transmission or make use of the lamb wave transmission. (vi) Immersion technique With the immersion technique (Fig. 2.12) both the testpiece and the probe are totally immersed in water. This guarantees a continuously good coupling effect. As a rule we use water to which we admix an anticorrosion agent, fungicides as well as an additive to reduce the surface tension of the water. The water should stand for a longer time to de-aerate, i.e. to reduce disturbing air bubbles to a minimum. The immersion type
  • 38.
    probes differ fromthe straight-beam probes for direct contact only insofar that they are watertight moulded including the cable connection. The probes are mounted in a holder so that they are oriented perpendicular to the testing surface. Between the probe and the surface of the workpiece is a water delay line which has a defined length. Fig. 2.12 Immersion Testing Technique (vii) Resonance Method All technique described before arc based on the pulse echo method. A continuous ultrasonic wave, however, can also be used in non-destructive testing. A continuous ultrasonic wave which is transmitted into a plane parallel plate can excite natural oscillations of the plate. A pre requirement for this is that the plate can freely oscillate on either side, i.e. on both sides of the plate must be a medium with small acoustical impedance.
  • 39.
    Fig. 2.13 StandingWave The ultrasonic wave is reflected on both interfaces thus traveling through the plate in two different directions whereby the forward wave and the reflected wave superimpose each other. Depending on the wave length in relation to the plate thickness amounts exactly to a multiple of the half wave length. In this case the wave crests of the forward wave meet the wave crests of the reflected wave and a standing wave develops (Refer Fig. 2.13). Such a wave is characterised by the fact that inside the plate there are locations where the particles are always stationary while on other locations the particles always oscillate with the maximum amplitude. Those frequencies which generate standing waves in the plate are designated natural frequencies of the plate. If the plate is excited in one of its natural frequencies then we refer to resonance vibration of the plate. For the detection of flaws the resonance method is difficult to apply. In addition, the flaws must have a surface of ¼ or ½ of the crystal surface in order to be detectable at all. The described disadvantages of this method are the reason why the resonance techniques were replaced by the pulse echo method.
  • 40.
    2.2.6 EDDY CURRENT INSPECTION TECHNIQUES (1&5) 2.2.6.1 PRINCIPLES OF EDDY CURRENT (5) Eddy Current and Its Properties When magnetic flux through a conductor changes, induced currents are set up in closed paths on the surface of the conductor. These currents are in a direction perpendicular to the magnetic flux and are called “Eddy Current”, Figure given below illustrate this. Fig. 2.14 Eddy Current Basic arrangement for producing Eddy Current in a conducting material is shown in Figure given below: Fig. 2.15 Generation of Eddy Current When an alternating current is passed through a coil, an electromagnetic field is set up around it. The direction of magnetic field changes with each cycle of alternating current. If a conductor is brought near this field, eddy currents are induced in it. The direction of eddy current changes with the change in direction of magnetic flux during the cycle of alternating current.
  • 41.
    The induced eddycurrent produces its own magnetic field (or flux) in a direction opposite to the inducing primary magnetic field. The secondary magnetic field due to eddy currents interacts with the primary magnetic field and changes the overall magnetic field and magnitude of the current flowing through the coil. In other words, the impedance of the coil is altered due to influence of eddy current. During non- destructive testing, using eddy current, change in impedance is displayed either on a meter or on a cathode ray tube screen. 2.2.6.2 FACTORS AFFECTING EDDY CURRENT (5) The magnitude and distribution of eddy current in a given conductor is influenced by conductivity of the material, the magnitude of primary magnetic field of the coil, Permeability of the conductor, Geometrical variations of the part, In homogeneities and discontinuities, Test frequency and Skin effect. Some of these important factors are discussed herebelow:- (i) Effect of Geometrical variation of the part: The shape, thickness and presence of conducting materials in close proximity of the part affect distribution of eddy current and associated magnetic field. Edges, corners and radii, obstruct the circular pattern of eddy current. This limits the volume of eddy current and changes the magnitude and distribution of eddy current and consequently the associated magnetic field is also effected. This is called ‘edge effect’.
  • 42.
    (ii) Effect of in homogeneities and discontinuities: The inhomogeneities and discontinuities like cracks, inclusions, voids, etc. in conducting materials also effect the circular pattern of eddy current and its associated magnetic field, fig. below illustrates the effect of inhomogeneities / discontinuities on distribution of eddy current. (iii) Effect of magnetic coupling:- Magnetic coupling refers to the interaction of varying magnetic field of the test coil with the test object. The effect of the primary magnetic field of the coil in inducing eddy current on the surface of a conductor is strongly influenced by the distance of the test coil from the surface of the conductor. This effect is illustrated in fig. below. Effect of Discontinuity of Effect of distance of test Eddy Current Coil from the part Fig. 2.16 Coupling is said to be effective when the distance of separation of the coil from the test object is small, it is said to be poor when the distance of separation between the test coil and test object is large. It is easy to realize that coupling is influenced by configuration and geometry of the test object, Surface condition and Coating on the surface of the test object
  • 43.
    (iv) Effect of Test Frequency: The magnitude of induced eddy current in an object increases with frequency of the inducing magnetic field, it has been observed that higher intensity of eddy current results in stronger secondary magnetic field opposing the primary magnetic field. This results in low depth of penetration of eddy current as in case of high conductivity or higher magnetic permeability of the test object as shown in Fig. Eddy current concentration is found to be greater at the surface of conductor and decreases as the depth increases. As the frequency of magnetizing field increases. As the frequency of magnetizing field increases, the concentration of eddy current near the surface also increases and depth of penetration decreases. Increasing magnetic permeability and conductivity of the material further Accentuates this effect. The depth at which the eddy current density is reduced to about 37% of its intensity on the surface, us called standard depth of penetration. This depth is given by 1 Standard depth of penetration = πf µrσ Where f = frequency µr = relative permeability σ = electrical conductivity. The fig. below illustrates the relationship between depths of penetration against frequencies for various materials.
  • 44.
    Fig. 2.17 Depthof Penetration-Frequency for Various Materials. 2.2.6.3 EDDY CURRENT TEST SYSTEM (5) Basic Test System An eddy current test system consists of : (i) An oscillator to provide alternating current of required frequency for exciting the test coil. (ii) Test coil-test object combination which brings out desired information in the form of an electrical signal. (iii) Signal processing (iv) Signal display.
  • 45.
    The following figuregives the block diagram. OSCILLATOR TEST COIL TEST PART BRIDGE CIRCUIT SINGLE PROCESSING CIRCUITS READ OUT Fig. 2.18 Block Diagram of Eddy Current Test System Here an Oscillator provides alternating current of required frequency to the test coil, which generates eddy current in the test object. The test object variables, like conductivity, permeability, discontinuities, etc. modulate the test coil impedance. The modulated impedance signal is processed and displayed over a readout mechanism. The commercially available eddy current equipment falls in the following two categories: (1) amplitude detector and amplitude – phase detector; and (2) special purpose equipment like conductivity meters, thickness measuring equipment for conductive materials and for non-conductive coating on conductive materials, flaw detector/metallurgical condition monitors, etc. 2.2.6.4 SENSING ELEMENTS TYPES AND ARRANGEMENTS (5) In most of the non-destructive inspection equipment applications of eddy current, the test coil (also called sensing element) serves as the main link
  • 46.
    between the testinstrument and test object. It serves two main functions. The first one is to establish a varying electromagnetic field which induces eddy current in the test object and induces increased magnetic effect in magnetic materials. The second purpose is to sense the current flow and magnetic effect within the test object and feed the information to signal analysis system. Factors that influence selection of a test coil are:- (i) Nature of the test specimen, e.g. Flat (sheet & plates), cylindrical (rods, wires, tubes and pipes), spherical (ball). (ii) type of information required and likely distribution of variables, e.g. Crack detection, conductivity variation, permeability variation, etc. (iii) accessibility, e.g. complexity of shape can make a test location on a component very difficult and the test may require a special configuration coil for testing. (iv) quantum of inspection: Depending on the production rate of a component and percentage inspection or service monitor needs, the selection of coil is made. 2.2.6.5 TYPES OF COILS (5): (i) Encircling Coil: An encircling coil is a coil arrangement in which the coil is in the form of a solenoid into which the test part is placed. With this arrangement the entire outside circumferential surface of the test part covered by the coil is scanned at a time. Its main advantages are Evaluating entire circumference at one time, High speed of testing and No coil wear problem. Main disadvantages are that it does not identify the exact location or point of defect in the circumference. (ii) Inside Coil: An inside coil is a coil arrangement in which the coil is in the form of a winding over as bobbin, which passes though the parts like tube, bolt holes, etc., to be tested and this arrangement scans the entire inside circumferential surface of the tube or bolt hole at a time. The main advantages are evaluation of the entire internal circumference at a time, which is otherwise not accessible to any other
  • 47.
    optical method ofinspection. Main disadvantages are inability to identify the exact location or point of defect over the circumferencential inspection and more Wear and tear of the test coil. (iii) Surface Coil: Surface coil is a type of coil arrangement in the form of a spring mounted flat probe or a pointed pencil type probe which scans the surface or selected location and this arrangement is very useful in exactly locating the defect. In surface probes, the distance between the probe and the specimen is very critical and this must be taken care of in probe design or in equipment design, to compensate for this ‘lift-off’ effect. In some surface probes, the coil is spring mounted, such that independent of the pressure applied, a constant spring pressure is applied to the coil and holds it firmly against the specimen. Main advantage of this coil is that it pin points the defect and disadvantages are speed of testing is slow being manual and lift-off and edge effect create problems. 2.2.6.6 TEST COIL FUNCTION AND SIGNAL FORMATION (5) Although the same coil can be used for excitation and for supplying the response signal, this is not necessary and often not desirable. One coil can be used for excitation purposes with a second coil or multiple coils used for monitoring the electromagnetic field conditions. The use of separate coils for excitation and sensing gives greater flexibility in meeting the test system requirement. For example, the primary electromagnetic field may be established by the use of a few turns of relatively large wire driven from a low impedance generator and the number of turns not the sensing coil can be adjusted to meet the input impedance requirements of sensing circuits. If desired, sensing circuits having very high input impedance can be used and the sensing coil may be wound with many turns of small wire gives a simple illustration of a sensing coil inside an excitation coil. As a simplified case, let ‘I’ be the current flowing through the excitation loop. Let us consider an element current Idl at ‘A’ in the excitation loop. Because of this elemental current at point ‘A’ there will be an induced voltage E1 at Point ‘B’ in the sensing loop and E 2 at a point ‘P’ in the test material. The induced electric field E2 at P causes a current Im to flow in the test object at point ‘P’. This current in turn causes induction resulting in a electric field Em at point ‘B’ in the sensing coil. Thus in the above simplified
  • 48.
    case at point‘B’ in the sensing element, there is an induction field due to current element Idl in the primary exciting loop and another filed Em due to the current intensity at point ‘P’ in the conductive object. Hence the total current intensity at ‘B’ in the sensing coil due to a current element Idl flowing at point ‘A’ is given by ET = El + Em. Similarly, each elemental point around ‘P’ in the part contributes its own filed and hence the information carried by the sensing coil is a cumulative field information which is a complex factor when contribution of ‘I’ though the excitation loop is considered as a whole. This resultant field intensity is fed to analyzing circuit. The test coil’s output signal is shown in the phasor diagram. The curved locus ABCD represents the test coil output signal locus for variation of conductivity of test object. A standard test object might have the conductivity represented by signal point D. The signal phasor OD represents the test coil output for this standard condition. Now let us assume that the original test object is replaced by a second test object which has a lower conductivity than the first one. This might give a test coil signal represented by a phasor OC. These two cases give distinct difference in readings as shown in fig illustrated below. Fig. 2.19 Coil Output Shown on Impedance Diagram 2.2.6.7 TEST COIL SELECTION CONSIDERATIONS (5) Selection of test coil depends on the nature and shape of the specimens to be tested, the type of information sought, the location of information sought, the distribution of information during the course of testing and the magnitude of testing required. Normally to achieve satisfactory test results, test coils are
  • 49.
    selected to suita specific test situation. This is done depending upon the shape of the test object, the sensitivity and resolution required in a test situation. The depth of eddy current penetration depends on test frequency, conductivity and permeability. Hence selection of frequency for a test situation on part of known conductivity and permeability is one of the main considerations. Each test requirements requires high duty cycle system. High production rate testing like tube, wires, etc. requires a specific test system. High production rate testing like tubes wires, etc. requires high duty cycle system with a good mechanical, electrical and thermal stability. The system should have least vibration between coil and job, whereas in a scanning type surface coil testing, good resolution and sensitivity are very essential. The test object conductivity varies due to temperature. Power dissipation in coil-object combination would result in temperature variation leading to change in conductivity. This thermal drift effect is troublesome, only when the coil assembly scans the same location of the test part for more duration. 2.2.6.8 TEST FREQUENCY AND DISTRIBUTION OF EDDY CURRENT (5) (i) Effect of Frequency on Eddy Current Testing: Eddy current testing is based on the principle of electromagnetic induction, wherein the test object is placed under the influence of varying magnetic field of a test coil driven by an alternating current of required frequency. In general, the test coil is characterized by a change in impedance which consists of two electrical impedance parameters. Impedance change due to magnetic variable causes a change in inductive reactance component ‘XL’. Alternatively, a change in electrical variable causes a change in resistive component ‘R’ of the impedance. In the case of inductive reactance XL (2πfL) the test coil’s inductive reactance is frequency dependent since ‘f’ is the frequency of the applied A.C. field. Since the inductive reactance is directly proportional to the frequency of the test coil, it plays an important role in eddy current testing.
  • 50.
    There are basicallythree approaches to eddy current testing: (i) Impedance testing: (ii) Phase analysis: and (iii) Modulation analysis. These methods can identify changes in conductivity, permeability or dimensional variations of the test specimen cumulatively or separately. A change in any one or more of the above characteristics, or a test part will be identified accordingly, depending upon the test requirement and choice of the method. Similarly important instrument characteristics which influence the eddy current testing are: (i) frequency of the A.C. applied to the test coil; (ii) size and shape of the test coil; and (iii) distance of the test coil from the object or electromagnetic coupling (lift-off/fill factor). Basic factors which influence the eddy current testing are (i) the effective permeability (µeff.). Which is determined by the frequency ration f/fg ; (ii) the limit frequency fg which is a function of physical characteristics of the test object such as conductivity (σ), relative permeability (µrel.). Diameter (d) for round specimens; (iii) test frequency f, and (iv) electromagnetic coupling (fill factor in case of cylindrical test object–encircling coil combination). The optimum test frequency for a specific test problem is determined by theory or experiment to provide the highest sensitivity to detect variation in conductivity, dimensions or permeability. 2.2.6.9 SELECTION OF TEST FREQUENCY (5) Generally, test frequencies used in eddy current inspection range from 200 Hz to 6 MHz. Frequency has a direct relationship with the ability of any eddy current test system to accurately and reliably measure the desired property of the test object. Frequencies can be selected to provide a maximum response signal caused by the variable. Usually lower frequencies of the order of 1 KHz are used for magnetic materials and relatively higher frequencies for non- magnetic materials. Actual frequency used for any specific case/instrument depends upon the thickness of test material, desired depth of penetration, degree of sensitivity/resolution required and the purpose of the inspection. For example, mid range frequency (say 100 KHz) might be used to detect surface cracks in stainless steel plate. Higher frequencies (1MHz) provide less sensitivity to cracks and greater sensitivity to lift off/ dimensional variations.
  • 51.
    Lower frequencies (1KHz)may provide poor sensitivity to the surface cracks but have good sensitivity to conductivity variations in the base material. Selection of frequency is a compromise so that penetration is sufficient to reach any sub-surface flaw. At lower frequencies, penetration is greater, but at the same time sensitivity to flaw decreases. Therefore, inspection frequency as high as possible that is still compatible with the required depth of penetration is selected. Generally, small flaws remain undetected as the depth increases. Optimum frequencies are often determined experimentally. Frequency selection can be within a range since often there will be wide band frequencies, which produces nearly the same results. The following Fig. gives a general guideline for frequency selection for different purposes. Ferrous Crack Detection & Coating Sorting Non-Ferrous Sorting Cladding Low Freq. Med. Freq. High Freq. 1Hz 10Hz 100Hz 1KHz 10KHz 100KHz 1MHz 10MHz Frequency Fig. 2.20 Frequency Distribution 2.2.6.10 EDDY CURRENT DISTRIBUTION (5) In eddy current testing, the coil’s field intensity decreases as the distance from the coil surface increases. The amount of eddy current generated in a specimen increases as the field intensity increases. If we consider an empty test coil, the filed would have a constant intensity across the coil’s inside diameter. When the test coil carrying A.C. is placed near a conductor, the electrons in the conductor move back and forth generating eddy current which follow circular path. This path will always be parallel to the surface of the specimen. The eddy current generated near the surface will be more. As the depth from the surface increases eddy current intensity decreases. The reason is that the flow of eddy current generates a secondary magnetic field decreases the intensity of the coils’ magnetic field. Near the surface, the test coils’ full intensity is applied and
  • 52.
    hence eddy currentof higher intensity is generated. In the subsequent layer the intensity is decreased due to the nullifying effect of the secondary magnetic field due to eddy current. Thereby the eddy current produced in subsequent layers below will be less than the previous upper layer. This phenomenon continues until the eddy current intensity becomes negligible. Thus at the center of a circular conductor of reasonable diameter, eddy current intensity will be almost negligible. Distribution of field strength or eddy current density within the test object determines the sensitivity of the test method. At higher f/fg ratio, eddy currents concentrate near the surface which results in sensitivity restricted to surface cracks with reduction in sensitivity to conductivity variations. Too low test frequencies, no doubt, would have greater penetration but are less sensitive. At very high f/fg ratio (say 100), the eddy current density fails off very rapidly as indicated by a steep falling trend of the curve. At f/fg of 4, the intensity falls off gradually indicating the presence of eddy current even at lower depths. The rate of reduction of the field strength decreases and the percentage of fields strength decreases. The eddy current density at the surface decreases as the frequency is decreased. As the frequency is increased, the eddy current concentrates near the surface and decreases as the depth increases with virtually no field strength at the center. Stronger the eddy current, more sensitive is the system for detection of discontinuities and sensitivity is always greater near the surface. Inhomogeneities and discontinuities act to obstruct the passage of eddy current, thereby distorting the circular path. This changes the effective conductivity of a test piece by concentration of eddy current into a relatively small volume. This results in lowering the effective conductivity of the specimen. Further, the response to surface cracks and discontinuities is greatly reduced at low f/fg ratios. If the magnetizing field strength is increased, the eddy current density also increases proportionately. But if very high eddy current is developed, it heats up the test sample which is turn changes the electrical conductivity of the test specimen resulting in erroneous test results.
  • 53.
    2.2.6.11 GENERAL GUIDELINEFOR FREQUENCY SELECTION (5) Application Frequency Range Ferrous Sorting 1 to 400 Hz Crack detection & 400 Hz to 8 MHz Non ferrous sorting Coating & Cladding 1 MHz & above Thickness Table 2.2 Frequency selection for different materials 2.2.6.12 EDDY CURRENT TEST SYSTEM REQUIREMENTS (5) Basically any electromagnetic test system consists of :- (i) a generator to provide a.c. to required frequency which will excite the test coil. (ii) A modulating device consisting of test coil – test object combination. Varying property of the component modulates the impedance magnitude of the coil. (iii) A signal preparation unit consisting of bridge / null balancer, filters, amplifiers, etc. (iv) Demodulation and signal analysis unit consisting of phase discriminators, compensators, etc. (v) Read out mechanism like meters, CRT, relays, recorders, etc. Equipment design consideration depends upon the nature and requirement of the test conducted. Mostly impedance magnitude type equipments are used when the change in the coils impedance is displayed over a meter or CRT screen. The deflection of meter reading is proportional to the magnitude of variation in the
  • 54.
    sample. Since theimpedance magnitude test cannot separate, allowed tolerance diameter change effects from conductivity changes, it is having limited scope in practice. Four basic types of instruments are :- (i) measuring the change of magnitude of the total impedance of the test coil regardless of phase. (ii) measurement of the resistive component of the test coil impedance (core loss). (iii) measurement of the reactive component of the coil impedance. (iv) Phase sensitive measurements which separate the resistive and reactive components of the coil impedance, as required. Eddy current instrumentation system is designated to sense and indicate variations in the output of the coil assembly resulting from changes in electromagnetic field caused by discontinuities in the part under test. The detection system may include an adjustable phase selective system as well as filter circuit for the purpose of enhancing the response to specific kind of variations present in the output of test coil assembly and reducing unimportant variations. When such selective methods are present, means must be provided to ensure that their correct adjustments are achieved. This is done by the use of calibrated controls. The stability of eddy current system should be such that repeatable results are obtained when a calibration standard is passed through the test system at various times. 2.2.6.13 READ OUT (DISPLAY) MECHANISMS (5): An important part of eddy current inspection system is the readout system used to display the demodulated signals for interpretation. The display device may be an integral part of the system or a replaceable plug-in module type. The readout mechanism should be of required speed and accuracy to meet the test requirement depending upon production speed and variable of interest. A single test requirement may have more than one device. There are various types of display devices available.
  • 55.
    (i) Uncalibrated Meter: This is otherwise known as analog meter and gives continuous reading over a wide range. They are rapid in operation and the scale can be calibrated for any specific parameter by having standard specimen with known parameter. The accuracy of such meters is ±1% of full scale. (ii) Calibrated Meters: These types of equipment have a meter with a needle, over which calibrated scales for specific variables to be measured (usually coating thickness, etc.) is attached. For each measurement different scales are attached and the needle reading against the calibrated scale given the test parameter directly. (iii) Digital Meters: These provide greater accuracy than analog meters. Here the chance of operator error is negligible, since the reading is direct and no interpretation is involved. This system is faster than direct meter type. (iv) Audio and Video Alarm: Both these two system alert the operator that the test parameter level has exceeded the pre-set level. These two systems can be set to any threshold level by adjusting as potentiometer type control. If any input signal exceeds the set level an automatic warning alerts the operator by way of a blinking lamp or a buzzer. (v) X-Y Recorder: Here the output signal activates a pen which records continuous line as a chart. When scanning long specimens like rod, tube, etc. the recording reveals position of a given flaw in one co-ordinate (the longitudinal direction of the specimen) in the form of a ‘go’ and ‘no-go’ trace or proportional trace. X-Y recorders makes it possible to simulate on a stationary sheet of chart, the scanning movement of
  • 56.
    the coil intwo co-ordinates. The X-Y recording is done by means of an ink filled stylus which is activated by the output signal voltage. (vi) Storage Oscilloscope: This is similar in principle to X-Y recorder but is comparatively fast. The storage pattern is available over a long persistence fluorescent screen of CRT as along as desired by the operator, but can be cleared when the interpretation is completed. (vii) Magnetic Tape Recorder: The output signal can be recorded in a magnetic tape at a good speed and can be played back and analyzed later at any time. (viii) Computers: These types of mechanisms are very useful for complex test variables and the output signals from various channels are fed to a high speed computer. These mechanisms are highly useful in high production rate process lines. The computer separates parameters and isolates the variable of interest and significance, catalog data, print the summaries of the result and store them on tape for reference in future study. 2.2.6.14 APPLICATION OF ELECTROMAGNETIC TESTING (5) Eddy current method of non-destructive testing is put to variety of applications. Broadly, eddy current application can be grouped into (i) Conductivity measurement (sorting, hardness, heart-treatment, & alloy segregation, carburization, etc.); (ii) Discontinuity testing (cracks, dimensional charges, surface conditions, etc.); (iii) Thickness measurement (coating, platting, sheet metal gauging, etc.).
  • 57.
    2.2.6.15 FLAW DETECTION(5) Inhomogeneities in electrically conducting materials appreciably alter the normal circular eddy current flow pattern and can be detected by eddy current test coils. The inhomogeneities include crack, inclusions, voids, seams, laps etc. and are termed as discontinuities. Single surface probe coil with defectometer is normally employed for detection of crack depth in forgings, castings, extrusions which are electrically conductive. The system is balanced with the probe in air and further balanced to a zero value on sound material of the same composition, heat- treatment and surface conditions as the component under test. Alternatively, a known defect can also be used for balance calibration. Flaw suspected areas of the surface are scanned with the probe which searches for imbalance due to flaw. The indications for defective component, in meter type, ellipse type and vector point type presentations are shown in fig. below. For wires, solid and hollow cylindrical parts, rods, etc. encircling coil is used.
  • 58.
    Phase Response fromCracks: Phase changes are unique for several eddy current inspection parameters. By determining the phase change of an eddy current response, it is possible to isolate the response of a specific variable such as conductivity, lift-off, thickness, permeability and cracks (Refer Fig. 2.21) Fig. 2.21 Defect Indication in Various Displays In most applications of eddy current inspection, difference in phase between lift-off response and crack response is essential for the detection of cracks. When conductivity, magnetic permeability, frequency, etc. are low and crack size is small, the phase angle response between lift-off and crack indication will be small. As the magnitude of one or more of the above variables increases, the phase angle increases. When the crack length increases, the phase angle approaches more closely the phase angle for conductivity changes.
  • 59.
    2.2.6.16 Effects of Material and Inspection variable on sensitivity and thickness. (5) Increase in Variable Effect of Sensitivity Range of Measurement Conductivity, Material (1) Increases for thin metallic (1) Decreases for permeability and test parts and platings metallic materials. Frequency (2) Increases for thick metallic parts and platings (2) Increases for non- (3) Increases for non conductive conductive coatings coatings. Probe diameter (1) Increases for thick metallic Increases for metallic parts and platings. parts platings and non- (2) Increases for non-conductive conductive coatings. coatings. Table 2.3 Effects of Material and Inspection variable on sensitivity and thickness. (5) The above table gives the effects of material and inspection variable on sensitivity and thickness and also their range of measurements. Generally alloy sorting, heat treatment checks (non-magnetic materials), cladding thickness, plating thickness, etc. fall under conductivity measurement. Magnetic material alloy sorting, plating thickness, case depth, heat-treat control, fall under magnetic permeability measurement. Measurement of thin foil thickness fall under geometry measurement. Detection of cracks, seams, inclusion, etc. fall under flaw detection. Insulation thickness, non-metallic coating thickness measurements, etc. fall under magnetic coupling (lift-off/fill factor) variation measurement. Table 2.4 given below shows the effective depth of penetration for various frequencies for different materials.
  • 60.
    Material Permeability Conductivity Depth of Penetration (mm) at (σ) % frequency 1 KHz 10KHz 30 KHz 100 KHz Copper 1 100 2.00 0.63 0.31 0.20 Aluminum 1 65 2.80 0.84 0.48 0.25 Magnesium 1 39 3.30 1.02 0.58 0.33 Brass 1 55 4.30 1.36 0.78 0.43 Mild Steel 500 2.1 0.25 0.10 0.05 0.025 (Normal) Mild Steel 1 2.1 6.90 2.27 1.34 0.76 (Saturated) Austenitic 1 2.1 13.40 4.30 2.45 1.34 Stainless Steel Table 2.4 Depth of Penetration for various materials and frequencies. 2.2.6.15 STANDARDIZATION AND CALIBRATION (5) Eddy current method of inspection can only be applied on a ‘GO’/’NO GO’ basis by calibrating the test system against a pre-fabricated standard with known magnitude of variation, desired to be measured in a specimen which is identical to the test component except the parameter being measured. Artificially fabricated standards may contain notches, slots, holes etc. Their types, advantage, limitations and applicability has been shown in the table 2.5 below.
  • 61.
    Type Advantage Limitation Applicability Drilled Holes (1) Easy to fabricate. Maximum response (1) For small crack in Al (2) Good dimensional difficult to detect. & Ti. tolerance. (2) Not for small crack in sheet. Saw Notches Easy to fabricate in field. Precise dimensional Good for crack standard tolerance possible in in Al, Ti and Steel. field. Conductivity (1) Easy to use in field. (1) Response varies (1) Not for small cracks. Difference (2) No tools/ labour with type of probe. (2) For instrument involved. (2) Primarily for non- operation checking. ferrous alloys. (3) Not for use with steels. Slots in foils (1) Easy for field (1) Dimensional Not for small cracks. (Razor cuts) fabrication. control difficult. (2) Formed to curved (2) Not for harder surface. metals. (3) Response repeatability poor. E.D.M. Notches (1) Good dimensional (1) Cannot be For small cracks in Al, Ti (Electrical tolerance. fabricated in field and Steel. discharge (2) Response similar in fabrication machining) phase to crack. (2) Expensive E.D.M. slots in (1) Good dimensional (1) Expensive. Not for small cracks. foils control. (2) Difficult for field (2) Formed to curved fabrication. surface. (3) Response repeatability poor. Shrink fit plugs For surface and bolt Off scale gross (1) Not for small cracks. holes. indication. (2) For checking instrument operation. Milled Notches Less expensive than (1) Response varies (1) Not for small cracks. E.D.M. notches with type of probe. (2) For checking (2) Difficult for field instrument operation. fabrication. Table 2.5 Commonly used Reference Standards
  • 62.
    2.3 RELATIVE ADVANTAGE & DISADVANTAGES OF VARIOUS NDT METHODS :- Name of the Method Advantages Disadvantages (A) (i) Low Initial Cost (i) Trained operator (ii) Permanent needed. RADIOGRAPH Records (ii) Cost related to Y (GAMMA (iii) Portable source size. RAYS AND X- (iv) Small Sources (iii) Depth of defect RAYS) can be placed not shown. INSPECTION with small (iv) High initial cost openings. (v) Source decays (v) Panoramic radiation hazard. imaging (iv) Sensitivity possible (X- decreases with Ray) increase in (vi) High sensitivity scattered to density radiation. changes. (vii) Nocouplant required. (viii) Geometry variation doesn't effect direction of X-ray beams. B. ULTRASONIC (i) Most sensitive (i) Couplant INSPECTION to cracks. required (ii) Test results (ii) Small Thin & known complex parts immediately. difficult to test. (iii) High penetration (iii) Reference capability. standard (iv) Automation and required. permanent (iv) Trained operator record required. capability. (v) Special probes required
  • 63.
    C. EDDY (i) No special (i) Conductive CURRENT operator skill material alone INSPECTION required can be tested (ii) Low cost (ii) Shallow depth of (iii) Automation penetration possible for (iii) False indication symmetrical due to variation parts in part geometry (iv) Permanent (iv) Reference record possible standard required (v) No couplant (v) Permeability required variation causes difficulties. D. MAGNETIC (i) Advantage over (i) Low sensitivity PARTICLE penetrant that it due thick surface INSPECTION indicates sub- coatings. surface defects – (ii) Alignment of particularly magnetic field is inclusions. critical. (ii) Relatively fast (iii) Demagnetization inspections. of parts required (iii) Low cost. after test. Must (iv) Portable & Fixed be cleaned both types before and after available the test. E. PENETRANT (i) Portable (i) Surface Films (DYE AND (ii) Low cost such as coatings, FLUORESCEN (iii) Indications may scales, smeared T be further metal prevent INSPECTION) examined detection of visually defect. (iv) Results easily (ii) Parts must be interpreted. cleaned before and after inspection. (iii) Defects must be open to surface.
  • 64.
    3. EXPERIMENTAL SETUP 3.1 HIGH FREQUENCY EDDY CURRENT INSPECTION OF A320 AIRBUS WHEEL HUB ASSEMBLIES (6) 3.1.1 INSTRUMENTATION (i) Eddy Current Inspection Defectometer Model H 2.835 (ii) Eddy Current Inspection Non-ferrous surface probe (Shielded) (iii) Eddy Current Inspection reference standard for calibration Fig. 3.1 Defectometer Model H 2.835 3.1.1.1 Defectometer Model H 2.835 has the following features (Refer Fig. 3.1): (i) On/Off switch “O/I” (ii) “Ready” display (iii) Pushbutton “L” Lift-Off compensation (iv) Pushbutton “Z” zero compensation (v) Pushbutton “M” material-Type (Fe, NFe, Aust.) (vi) Pushbutton “*” open lock (vii) Pushbutton “” to increase sensitivity (viii) Pushbutton “” to decrease sensitivity (ix) Five LED’s “DEFECT” (x) Analog instrument “crack severity” (xi) Threshold switch (xii) “ZERO” compensation
  • 65.
    (xiii) Symbols for “Lift-Off” compensation (xiv) “Ready” symbol to indicate operability (xv) Symbol for Material type 3.1.1.2 Eddy Current Tester Calibration Procedure (i)Lift-Off compensation Lift-Off may be defined as the change in impedance of a coil when the coil is moved away from the surface of the specimen. This produces a large indication on the test equipment. L Flashing of the symbol indicates that Lift-Off compensation must be carried out. For this purpose raise the test probe from the testpiece and depress the push button “L”. This stops flashing of “L” in the display and symbol remains for upto 3.5 seconds whilst Lift-Off compensation is carried out. The “L” is extinguished and “Z” beings to flash with the symbol (Refer Fig. 3.2) . Fig 3.2 Eddy Current Tester Calibration Procedure (ii)Selection of Test Probe The test probes are either Ferrous, Non-ferrous or austenitic, depending upon the type of material to be tested. For Non-ferrous mode the test frequency is approx. 2 MHz and for ferrous and austenitic mode it is approx. 4 MHz. Special probes can be obtained for very special inspections as per the test requirements. There are surface probes which are used for detecting surface or
  • 66.
    sub-surface cracks. Thereare hole probes used to detect radial cracks in round fastener holes (Cracks inside the fastener holes). Calibration Standard is supplied along with the apparatus as per the material to be tested and test probe being used. In order to calibrate the equipment, standard reference pieces, manufactured from a material similar to that being tested, are necessary. These pieces should contain defects of known size and shape, so that the change in coil impedance against a known defect could be used as an acceptance limit. 3.1.2 EXPERIMENTS (6) 3.1.2.1 PROCEDURE AND OBSERVATIONS As a part of On-Condition (O.C) preventive maintenance programme of A-320, main wheel assemblies, High frequency eddy current inspection is carried out during every shop visit of the wheel assemblies (Shop visit is mainly due to worn out tyres requiring tyre change or wheel assemblies overhaul). I associated in carrying out A320 aircraft main wheel hub assemblies high frequency eddy current inspection in the wheel-bay section of Accessories overhaul shop. The details of which are given herebelow & copies of their work sheets are enclosed for ready reference. First I calibrated the defectometer with the help of the testpiece. After connecting the test probe to the probe socket, the defectometer is switched on. The display indicates the sensitivity values and the type of material of the last test. For the test to be carried out one should make sure the displayed material type (Fe, NFe, Aust.) agrees with that of the test probe. 12.5 seconds after the appearance of the “READY” all push buttons are locked with the exception of the button “Z” and “L” thus preventing inadvertent changes to the selected settings. The defectometer is now ready for use. The crack severity display of the unit can be set with the help of test flaws in the testpiece. The sensitivity can be modified between 0 and 19.5 db in the steps of 0.5 db. An audible flaw signal can also be obtained in addition to the visual signal. The audio generator incorporated in this defectometer can be set with the threshold switch as a threshold value to 20, 40, 60, 80 and 100 scale divisions of instruments corresponding to 5 flaw thresholds.
  • 67.
    Testing is extremelysimple. The test probe is lowered onto the test piece and smoothly guided over zone to be tested. If the material is flawless, the pointer merely flutters around the scale reference point due to the inaccuracy of the manual probe guidance. On the other hand cracks on the surface of the material cause a deflection of the pointer which is proportional to the depth. The display increases as the crack depth increases. As the calibrated threshold is reached, an audible signal is given along with large deflection of the pointer on the scale. If testing is to be carried out in transition from plane surface to an acutely curved surface undesirable displays appears on the unit. This situation is eliminated by means of following described calibration method. For testing curved surfaces, the instrument pointer can be set to the centre of the scale with the zero control after switching on the unit. To test concave surfaces, Lift-Off compensation is carried out by placing the probe on the level surface and Zero compensation is carried out in the curve. To test convex surface, Lift-Off compensation is carried out on the curve and Zero compensation is carried out on the level surface. The defectometer is now ready to test the curved surface after “READY” appears on the display. After testing few of the main wheel hub assemblies, the following five Main wheel hub assemblies were found to have defects, the details of which are given herebelow: Fig. 3.3 Eddy Current test Procedure (i). Main wheel assemblies serial no. AM442 removed from A320 aircraft VT-EPO durng its ‘4A’ check on 8/1/05 due to uneven wear of the tyre. During shop checks & as per item A of the WORKSHEET of A320 aircraft Main wheel assembly
  • 68.
    servicing/overhaul schedule, highfrequency eddy current inspection of inner & outer half hubs of main wheel assembly serial no. AM-442 was carried out in association with shop inspection engineers using non-ferrous surface probe & defectometer. Inner half of hub was found to have a crack of approx ¾” on the web near flange attachment area. Outer half of the hub was found satisfactory (Refer Fig. 3.4) Fig 3.4 Crack on the web near flange attachment area of the hub Refer Appendix I for Shop Inspection Report of Main Wheel Assembly S.No. AM442 Hub Assemblies (ii). Main wheel assembly serial no. AM 398 removed from A320 aircraft VT-EPM on 8/10/04 during night halt inspection due to its tyre wear. During shop investigation, H.F.E.C inspection of inner & outer half hubs carried out using non-ferrous surface probe & defectometer, a circumferential crack of ½” length observed between the tie bolt holes of outer hub. H.F.E.C inspection of inner hub found satisfactory. (Refer Fig. 3.5)
  • 69.
    Fig. 3.5 Circumferentialcrack between the tiebolt holes. Refer Appendix II for Shop Inspection Report of Main Wheel Assembly S.No. AM398 Hub Assemblies. (iii). Main wheel assembly serial no. AM208 removed from A-320 aircraft VT-EPC on 20/10/04 during preflight inspection due to uneven wear of the tyre. During shop investigation, High frequency eddy current inspection of outer & inner wheel hubs carried out & inner half hub found to have a longitudinal crack of approx. 0.4 inch near the drive block area (The web area). H.F.E.C of the outer half hub satisfactory (Refer Fig. 3.6)
  • 70.
    Fig. 3.6 Longitudinalcrack in the drive block area Refer Appendix III for Shop Inspection Report of Main Wheel Assembly S.No. AM208 Hub Assemblies. (iv). Main wheel assembly serial no. AM201 removed from A320 aircraft VT-EPR on 3/1/03 during night halt inspection due tyre worn-out. During shop, investigation, outer half of the hub having a crack of approx. ¼ inch between spoke hole area. Inner half of the hub satisfactory (Refer Fig. 3.7) .
  • 71.
    Fig. 3.7 Crackbetween the spoke hole area Refer Appendix IV for Shop Inspection Report of Main Wheel Assembly S.No. AM201 Hub Assemblies. (v). Main wheel assembly serial no. AM493 removed from A320 aircraft VT-EPI on 21/9/04 during ‘2A’ check as wheel assembly was due for overhaul. During shop investigation, outer half of the hub having a circumferential crack of approx. 0.7 inch between the tie bolt holes & approx. 0.5 inch diagonal crack at the nozzle hole. H.F.E.C of inner hub – satisfactory (Shop NDT report enclosed) (Refer Fig. 3.8).
  • 72.
    Fig. 3.8 Cracksbetween nozzle hole and tiebolt hole Refer Appendix V for Shop Inspection Report of Main Wheel Assembly S.No. AM493 Hub Assemblies. 3.2 ULTRASONIC INSPECTION OF L.P COMPRESSOR FAN BLADE OF M/s IAE V2500 ENGINE INSTALLED ON A320 AIRCRAFT. (7&8) 3.2.1 INSTRUMENTATION (i) High Frequency Ultrasonic Testing Instrument Meccasonic D125BJ or Meccasonic D325BJ (Refer Fig. 3.9)
  • 73.
    Fig. 3.9 MeccasonicUltrasonic Tester (ii) 25 MHz focussed testing probe Meccasonic ‘Blueface’ probe 1001225 or equivalent as per Overhaul Manual (iii) Calibration standard to be made from the same material or a material with same acoustic velocity as the part to be tested. (iv) Ultrasonic Couplant Ultragel II Fig. 3.10Ultrasonic Tester Calibration Ultrasonic Tester Calibration Procedure Model D325BJ unit (Refer Fig. 3.10) (i) Switch the set on. (ii) Set the vertical movement control to mid-setting and push in the vertical control. (iii) Set the horizontal movement control to mid-setting. (iv) Set the outer thickness control to position 1 and centre thickness control to its mid position. (v) Turn the brightness control to get a trace of necessary brightness and focus the trace.
  • 74.
    (vi) If necessary control the display with vertical and horizontal controls. (vii) Set amplitude control to its mid position. (viii) Select calibrate position on interface trigger button. (ix) Turn delay control fully anti-clockwise (x) Turn horizontal control clockwise to position first pulse at far left of screen. (xi) Position applicable calibration piece and first multiple echo must be monitored at mid- screen on the time-base. (xii) Set thickness control to position 5. (xiii) Turn delay control clockwise the first pulse will go out of view to the left. Continue to turn until the first multiple echo is at the far left of the screen but no part of the pattern is off screen. (xiv) Push IF button into LOCK position. No multiple echo should be seen at this phase. Slowly and continuously increase IF LEVEL control from 0 until echo pattern jams and locks on to the left of the screen. (xv) Tilt calibration piece to reduce the interface echo amplitude and get the most stable display possible on the smallest interface echo. (xvi) Set thickness control to position 3. (xvii) Using centre THICKNESS control and horizontal control calibrate screen as necessary. The video display must calibrated from at least the first and second backwall echo’s. Adjust amplitude control to produce a first backwall echo ½ to ¾ screen height. Selection of Test Probe The test probe consists of a transducer mounted in a damping material and connected electrically to the test set. For any particular application it may be necessary to use a probe of particular design so that a sound beam is injected into the material at an angle normal to the expected defect. In certain applications a wheel probe, consisting of a transducer mounted inside an oil- filled plastic tyre, has been found suitable for high speed automatic scanning. Reference Standards Reference standards are used for: (i) Calibration of ultrasonic testing equipment
  • 75.
    (ii) Compare test indications of ultrasonic inspection material against defects (real or artificial) of known size must be specified with the applicable reference number. 3.2.2 EXPERIMENTS(7&8) 3.2.2.1 PROCEDURE AND OBSERVATIONS Ultrasonic testing is a non-destructive procedure looking for defects or breaks within materials which can transmit sound at high frequency in these materials, land quality, voids, cracks, inclusions, porosity can be found throughout the work piece. As described earlier, in ultrasonic testing an electric pulse is applied to a piezo-electric crystal, which causes it to vibrate. When this vibration is applied to a sound transmitting material, a mechanical wave is caused in the material until stopped or reflected by a break or edge. The reflected energy is found by the same or a different crystal. These detected signals are applied to an amplifier & visually presented on a cathode ray tube. This presentation is then analysed to give the size, location & other property of the break or edge. The above NDT method was employed to check internal health of V2500 engine fan blades. These fan blades are Hollow Titanium Hives with Aluminium Honeycomb Core which are bonded together to form integral structure & are of Wide Cord type for improved aerodynamic efficiency & for improved F.O.D resistance. I associated in carrying out ultrasonic inspection on two of such fan blades in the jet overhaul shop & their detailed inspection reports are as follows. (I). Engine fan blade part no. 6A7650 serial no. 23475 removed from V2500 engine serial no. V0079 following shop visit inspections were carried out.
  • 76.
    (A)After thoroughly cleaningthe fan blade, I carried out ultrasonic inspection of fan blade dovetail root flank (M/s IAE engine manual task 72-00-00-200-011). The following procedure was employed after calibrating the ultrasonic testing equipment COMAT 06-148 ultrasonic couplant was applied to the concave surface of blade root flank. (i) Ultrasonic probe was positioned at front of the leading edge of concave blade root flank & the probe was moved along full cord width of the blade. The signal was monitored carefully on the display to ensure that signal greater than 60% of screen height between 4.5 & 5.5 division lines on time base is not produced which is criterion for blade rejection. (ii) Same procedure was repeated for convex blade root flank. (iii) Both concave & convex blade root flank inspection were found satisfactory. Fig. 3.11 Ultrasonic C-scan Inspection
  • 77.
    (B) I Carriedout C-scan inspection of fan blade aerofoil (M/s IAE engine manual task 72-00-00-200-013). The following procedure was employed after calibrating the C-scan ultrasonic equipment as follows (Refer Fig. 3.11).: (i) Switched on the system & 30 minutes system warm up time given (ii) Entered relevant details of engine & blade serial no. & logged on to the system (iii) Checked the probe alignment as follows: a) Checked the front face of the probe holder is parallel to the end of the tank, by placing a ruler on the front face of the end of the tank. If not parallel, loosen the grub screw & twist the holder to correct the error. b) Checked for air bubbles under the probe as follows: c) Removed the probe from the holder & whilst the probe is in the water gently wipe the probe face & holder to remove any air bubbles d) Selected the CALIBRATE icon. e) Loaded the calibration blade QC6808 f) Scanned the calibration blade QC6808 g) Typed ‘TEST’ in the serial number box & then selected ‘CALIBRATION BLADE’ from the BLADE TYPE box & scanned the calibration blade again. The system will now reject the calibration blade. h) Every four hours, the calibration blade was loaded & tested to ensure the system has not drifted, then the aerofoil of the L.P Compressor blade was examined as follows: i) V2500 blade to be inspected was selected. j) Entered the details of blade to be scanned like serial no., part no., engine serial no. k) Scanning of the blade done l) Scanning accepted the blade & as such passed the subject inspection. m) If the blade is rejected in the C-scan, the system prompts the archive of the blade C-scan data to an archive directory for future records.
  • 78.
    Fig. 3.12Ultrasonic TapTest Technique (C) I Carried out TAP Test of the subject fan blade (Transient Acoustic Propagation) to examine the fan blade internally (M/s IAE engine manual task 72-00-00-200-010) using Transient Accoustic propagation (TAP) tester as follows (Refer Fig. 3.12): (i) Carried out the system check of the TAP tester by connecting the dedicated probe to the tester. Carried out the functional check of the TAP test set ensuring the TAP test block value shown on the tester display is in the range of values engraved on the side of the tap test block. (ii) Applied small quantity of COMAT 06-148 ultrasonic couplant to the lower convex aerofoil adjacent to the annulus filler line & attached the probe to the fan blade. Pressed the ‘ON’ switch & then pressed the ‘EXE’ switch (Execute). The display showed the value within approx. 4 seconds. The number displayed was 490 db/sec. Hence blade ‘passed’ the TAP test. If the number displayed is > 700 db/sec, the blade is to be rejected. Refer Appendix VI for Inspection Report of Fan Blade S.No. 23475 (II) Similarly, Engine fan blade part number 6A7649 serial no. 43786 removed from engine serial no V0072 shop inspection were carried out & the ultrasonic inspection of dovetail root flank of the blade, C-Scan and tap test inspection of the blade were carried
  • 79.
    & all thetests were satisfactory. As such this blade also passed all the ultrasonic inspection checks. (Copies of inspection schedules of both the blades are enclosed for ready reference). Refer Appendix VII for Inspection Report of Fan Blade S.No. 43786
  • 80.
    4. RESULT ANDDISCUSSION 4.1 While carrying out H.F.E.C. inspection of the main wheel assembly hubs, the various types of sub-surface and surface flaws observed are crack at the hub flange attachment holes, crack between the wheel nozzle hole and flange attached hole, sub surface/surface crack at the blending area of the vent holes of the hub, fine crack initiation at the groove formed by the circlip flange, crack at the corner formed by flange and the web (Area of sudden change of cross section causing stress concentration) and cracks in the hub bead area. (Refer attached figure of inner (Fig. 4.1) and outer (Fig. 4.2) main wheel hub assemblies with typical crack locations). Fig. 4.1Cracks in the inner hub area
  • 81.
    Fig. 4.2 Cracksin the outer hub Area As per the available date, there is about 1 to 1.5% wheel hub rejection due to the above described defects in a year. 4.1.1 The inspection results of the failed main wheel hub assemblies were studied and the following preventive measures are suggested to minimise these failures (i) Cracks between the nozzle & tie bolt holes are normally starting from the nozzle. These tyre charging nozzle assemblies are of hexagonal cross-section with sharp corners. The sharp corners of hexagonal section cause notch formation and then result in crack initiation. To obviate these cracks, the sharp edged at corners of the hexagonal section of the nozzle should be rounded-off thereby eliminating the causes of crack initiation. (ii) Cracks between the tie bolt holes are traced to their unequal torquing. To obviate these cracks equal torquing of the tie bolts in criss-cross manner i.e. (proper sequence diagonal torquing) is suggested.
  • 82.
    (iii) Surface/Subsurface cracks of approx. 1 to 2 mm at the cooling holes of the wheel hubs were observed. These can be eliminated by the grinding of the crack area and restoring the surface finish by alodine treatment and subsequent primer/ paint of the surface. (iv) Bead area cracks are mainly due to pitting and stress corrosion of the area due to high level of stress accompanied with some moisture in the tyre inflating nitrogen. To obviate these cracks, it is suggested that the tyre filling nitrogen should be moisture-free. The pitting of the bead area should be critically monitored and same should be removed by smooth grinding. The surface protection be restored by alodining and subsequent primer/ paint. By removing the pitting damage, we shall be eliminating the cause of the crack initiation. Moreover, it is suggested that a water base paint be applied in this area (Resin + Hardener + Water) which will give great resistance to this area against pitting corrosion. (v) Cracks in the web area are observed at very few occasions and the matter has been taken up with the hub manufacturers to improve the surface treatment of the area or change in the alloying elements of Aluminum to improve its fatigue strength. The matter is under study by the hub manufacturers. 4.2 The various ultrasonic inspections were carried out on two of the different V2500 engine fan blades & no defect was found in any of these inspections. 4.2.1 However, after studying the shop reports of the fan blades in the last one year, I observed that there were few engine fan blade rejections due to their failure in dovetail root flank inspections. Similarly, few fan blades were rejected due to their failure in ‘C-scan’ & ‘Tap-test’ inspections. The following preventive measures are suggested on the on wing engines and during scheduled and unscheduled shop visits of the engines:- (i) It is suggested that the subject engine fan blade NDT inspections must be done more frequently to detect these hidden defects. As these initial defects if not detected timely will propagate in service & could result in fracture of fan blade and subsequent extensive internal damage to the engine. These NDT inspections must be done on on- wing engines during all major maintenance checks of the aircraft and during scheduled & unscheduled shop visits of the engines in the overhaul shop.
  • 83.
    (ii) The special bird-strike/FOD schedules must include an item of NDT inspection relating to fan blades – specially the fan blade root area NDT inspections. (iii) Whenever any engine fan module (N1) high vibration is reported, the subject NDT inspections of fan blades (specially the blade root area) must be called out.
  • 84.
    5. CONCLUSION (i) After studying the various NDT techniques, their applications, advantages & limitations, I have concluded that NDT is a very important tool for the modern production, maintenance & process industry. It helps in a great way to operate these industries economically, safely with high reliability & produce quality end-products. This is the ultimate goal of any industry. (ii) Regarding high frequency eddy current inspection of the aircraft wheel hubs, the various defects observed were studied & their remedial measures have been suggested after studying these problem areas. (iii) Similarly, various ultrasonic inspections of engine fan blades can pinpoint a smallest possible hidden defect, the continuance of which can cause a catastrophic failure or an in flight shut down of the engine. As such more frequent on wing and shop NDT inspections of the fan blades have been suggested. These inspections have also been suggested during reported engine F.O.D / Bird ingestion or in case of reported high fan module (N1 rotor) vibrations. (iv) Above remedial measures if carried out scrupulously shall go a long way in improving the in-service reliability of aircraft wheel hub assemblies & engine fan blades.
  • 85.
    6. REFERENCES 1. CivilAviation Authority, U.K., Civil Aircraft Inspection Procedure Non–Destructive Examination – Eddy Current Methods – Chapter bl/8-8 Issue 1, page 1-14, 1973. 2. Civil Aviation Authority, U.K., Civil Aircraft Inspection Procedure Non–Destructive Examination – Ultrasonic Flaw Detection – Chapter bl/8-3 Issue2, page 1-12, 1971. 3. Non-Destructive Testing, Robert c. Mc Master, The Ronald Press Company, London, page 16-34, 1963. 4. Non-Destructive Testing, William e Schall, Machinery Publication Ltd., London, page 28-56, 1968. 5. Eddy Current & Ultrasonic Testing (snt-tc-1a), Satyakiran School of NDT, New Delhi, page 3-96, 1996. 6. Component Maintenance Manual of Main Wheel Assembly – A320 Airbus Aircraft., Messier Hispano Bugatti, Spain, page 501-511, 2003. 7. V2500 Engine Maintenance Manual, International Aero Engines, U.S.A, page 1-10, 1998. 8. V2500 Engine Service Bulletins & Inspection Procedures, International Aero Engines, U.S.A, page 1-10, 1999.
  • 86.