SlideShare a Scribd company logo
UV-VIS
SPECTROSCOPY
Khadeja Mahmud Al-masri.
Department of Physics, Al-Najah University
Experimental Physics 422595
Prof. Issam Ashqar
15 July 2020
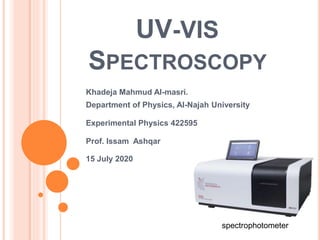
spectrophotometer
ABSTRACT
 Spectroscopy is the study of interaction of electromagnetic radiation
with matter.1
 Basic principle of spectroscopy is the Beer-Lambert’s law.
 In UV-VIS Spectroscopy, a continuum range of wavelengths from
200nm to 900nm is used.2
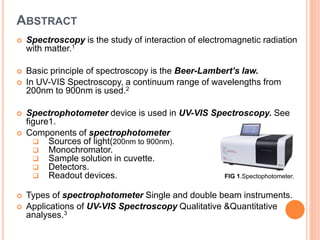
 Spectrophotometer device is used in UV-VIS Spectroscopy. See
figure1.
 Components of spectrophotometer
 Sources of light(200nm to 900nm).
 Monochromator.
 Sample solution in cuvette.
 Detectors.
 Readout devices.
 Types of spectrophotometer Single and double beam instruments.
 Applications of UV-VIS Spectroscopy Qualitative &Quantitative
analyses.3
FIG 1.Spectophotometer.
INTRODUCTION
 Spectroscopy is the branch of science which deals
with interaction of electromagnetic radiation with
materials. In other words it is an analytical method for
qualitative and quantitative analysis by use of light.
 The Lambert Beer law in 1852 made the basis for the
quantitative evaluation of absorption measurements.2
 This led firstly to colorimetry, then to photometry
and finally to spectrophotometry.
 This evolution was along with the development of
detectors for measuring light intensities, i.e. silicon
photo-diode detector.
 Spectroscopy is widely used as an exploratory tool
in the fields of physics, , and chemistry, for
determination of composition, physical structure
and electronic structure of matter at atomic scale,
molecular scale, and macro scale.4
1.SPECTROSCOPY
 When an Electromagnetic radiation is incident on a
matter, phenomena like reflection, transmission,
absorption ,are occurring.4
 Spectroscopy is the study of interaction of
electromagnetic radiation with matter based on the
Bohr-Einstein frequency relationship E=hv , here h
is the proportionality constant called Planck’s
constant (6.626 x 10⁻³⁴ J s) and v is frequency.
 Measurement of radiation intensity as a function of
wavelength is described by spectroscopy, as shown in
figure 2.
 All forms of spectroscopy use part of the
electromagnetic radiation to give us information about the
materials.
FIG.2.Spectroscopy graph.
1.1 SPECTRUM
 The spectrum is formed by electromagnetic waves
and the wavelength is varies. See figure 3.
 When a narrow beam of light is allowed to pass
through a prism/grating, it is dispersed into seven
colors from red to violet and the
band is called Spectrum..
See figure 4.
FIG.3.Electromagnatic spectrum.
FIG.4.Glase prism dispersion
1.2 PRINCIPLE
Basic principle of spectroscopy is the Beer-Lambert’s law.2
1.2.1 BEER LAW
 Beer's law stated that absorbance is proportional to the
concentrations of the material sample.
1.2.2 LAMBERT LAW
 Lambert's law stated that absorbance of a material is
directly proportional to its thickness (path length).
 The modern derivation of the Beer–Lambert law combines the
two laws and correlates the absorbance to both the
concentrations and the thickness of the material.
FIG 5. Beer–Lambert law.
2. UV-VISIBLE SPECTROSCOPY
 Ultraviolet–visible spectrum can be generated when
ultraviolet light and visible light(200-900nm) are
absorbed by materials. The spectrum can be used to
analyze the composition and the structure of the
materials. For a particular wavelength in the ultraviolet–
visible ranges, the absorption degree is proportional to
the components of the materials. Therefore, the
characteristics of the materials are quantitatively
reflected by the spectrum, which changes with the
wave-length.1
 Ultraviolet–visible spectrum consists of an
absorption spectrum. An absorption spectrum gives
information about the molar absorptivity, concentration
of the sample, optical bath length. See figure6, in
previous slid.
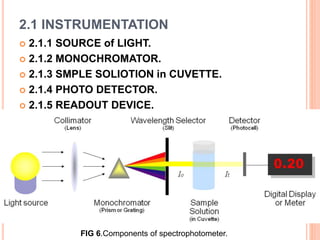
2.1 INSTRUMENTATION
 2.1.1 SOURCE of LIGHT.
 2.1.2 MONOCHROMATOR.
 2.1.3 SMPLE SOLIOTION in CUVETTE.
 2.1.4 PHOTO DETECTOR.
 2.1.5 READOUT DEVICE.
FIG 6.Components of spectrophotometer.
2.1.1 SOURCE OF LIGHT
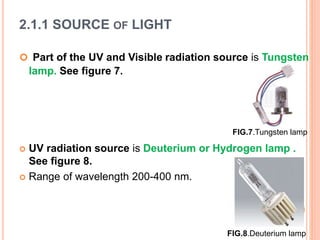
 Part of the UV and Visible radiation source is Tungsten
lamp. See figure 7.
 UV radiation source is Deuterium or Hydrogen lamp .
See figure 8.
 Range of wavelength 200-400 nm.
FIG.7.Tungsten lamp
FIG.8.Deuterium lamp
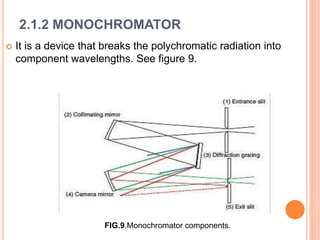
2.1.2 MONOCHROMATOR
 It is a device that breaks the polychromatic radiation into
component wavelengths. See figure 9.
FIG.9.Monochromator components.
The monochromator unit consists of :
•Entrance slit: defines narrow beam of radiation from
source.
•Collimating mirror:(polished surface) collimates the
lights.
•Diffraction grating or Prism (make of quartz):
disperses the light into specific wavelength.
•Focusing mirror: captures the dispersed light &
sharpens the same to the sample via exit slit
•Exit slit: allows the corrected wavelength of light to the
sample .
2.1.3 SMPLE SOLIOTION IN CUVETTE
 liquid sample is usually contained in a cell called a cuvette.
See figure10.
 Fingerprints and droplets of water disrupt light rays during
measurement.
 Cuvette from Quartz can be used in UV as well as in visible
spectroscopy.
 Cuvette from Glass is suitable for visible but not for UV
spectroscopy because it absorbs UV radiation.
FIG 10.sample solution in cuvette
2.1.4 PHOTO DETECTOR
 A photo detector is a semiconductor device which converts
light energy to electrical energy. It consists of a simple P-N
junction diode and is designed to work in reverse biased
condition. The photons approaching the diode are absorbed
by the photodiode and current is generated.4 See figure 11.
FIG 11. Photodiode
2.1.5 READOUT DEVICE.
 Digital screen to record an uv spectrograph with
absorbance against the wavelength.
------------------------------------------------
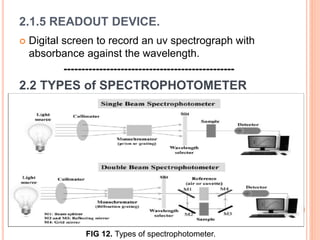
2.2 TYPES of SPECTROPHOTOMETER
FIG 12. Types of spectrophotometer.
 UV-Vis spectroscopy is used heavily in many different
research areas to identify or quantify a sample.3
 Chemical field:
1. Detection of impurities.
2. Structure of organic compounds (single or double bond,
presence or absence of functional group).
3. Kinetics of reaction.
4. Manufacturing drugs.
 Biological fields
1. quantify the amount of protein and DNA in a sample
2. quantify the amount of bacterial cells in a cell culture
2.3 APPLICATIONS OF UV-VIS SPECTROSCOPY.
CONCLUSION
 Major advantages of uv-vis spectroscopy are:
1. High sensitivity.
2. Require only small volume of sample.
3. Linearity over wide range of concentration.
4. Can be used with gradient elution.4
 Major disadvantages of uv-vis spectroscopy are:
1. Not linear for high concentration.
2. Does not work with compounds that do not absorb light
at this wavelength region.
3. Generates significant heat and requires external
cooling.4
REFERENCES
 1 H.H. Perkampus. UV-VIS Spectroscopy and its Applications,(2013),pp. 15-20.
 2 J.Q .Brown,and G.M .Palmer. Advances in quantitative UV–visible spectroscopy
for clinical and pre-clinical application in cancer,(2009), pp.30-42.
 3 M.M. Giusti, and R.E. Wrolstad. Characterization and measurement of
anthocyanins by UV‐visible spectroscopy,(2001),pp.57-60.
 4N.M.Kutty, UV-Visible spectroscopy, WWW Document
(http://reports.ias.ac.in/report/19397/uv-visible-spectroscopy)
ACKNOWLEDGEMENTS
 First of all, I am thankful to my guide, then to Dr. Issam Ashqar, who has guided me
throughout this course and made this project better.
QUESTIONS FOR SELF-
EVALUATION
 what is uv spectroscopy?
 What are the components of uv spectroscopy?
 What are the principles of uv spectroscopy?
 what are the applications of uv spectroscopy?

More Related Content

Similar to UVSpectroscopy.pptx

Spectrophotometry
Spectrophotometry Spectrophotometry
Spectrophotometry KHITISHNAIK
 
UV ray spectrophotometer
UV ray spectrophotometerUV ray spectrophotometer
UV ray spectrophotometerGoa App
 
UV rays
UV rays UV rays
UV rays Goa App
 
UV Spectroscopy.pptx FINAL YEAR SEVENTH SEM
UV Spectroscopy.pptx FINAL YEAR SEVENTH SEMUV Spectroscopy.pptx FINAL YEAR SEVENTH SEM
UV Spectroscopy.pptx FINAL YEAR SEVENTH SEMDhanashree Kad
 
performance and specifications of spectrophotometer
performance and specifications of spectrophotometerperformance and specifications of spectrophotometer
performance and specifications of spectrophotometerPulak Das
 
Application Of Biochemical Tools And Techniques.
Application Of Biochemical Tools And Techniques.Application Of Biochemical Tools And Techniques.
Application Of Biochemical Tools And Techniques.Ashley Carter
 
Instrumentation of UV- Visible Spectroscopy.pptx
Instrumentation of UV- Visible Spectroscopy.pptxInstrumentation of UV- Visible Spectroscopy.pptx
Instrumentation of UV- Visible Spectroscopy.pptxHariomjaiswal14
 
biophysics 1 spectroscopy
biophysics 1 spectroscopy biophysics 1 spectroscopy
biophysics 1 spectroscopy MSCW Mysore
 
Ultraviolet and visible spectroscopy
Ultraviolet and visible  spectroscopyUltraviolet and visible  spectroscopy
Ultraviolet and visible spectroscopyGeetaraniLoushigam
 
Design of spectrophotometry
Design of spectrophotometryDesign of spectrophotometry
Design of spectrophotometrykanthasamy
 

Similar to UVSpectroscopy.pptx (20)

Spectrophotometry
Spectrophotometry Spectrophotometry
Spectrophotometry
 
UV-VISIBLE SPECTROSCOPY.pptx
UV-VISIBLE SPECTROSCOPY.pptxUV-VISIBLE SPECTROSCOPY.pptx
UV-VISIBLE SPECTROSCOPY.pptx
 
UV ray spectrophotometer
UV ray spectrophotometerUV ray spectrophotometer
UV ray spectrophotometer
 
Spectrophotometer introducing
Spectrophotometer  introducingSpectrophotometer  introducing
Spectrophotometer introducing
 
spectrophotometer 2.pdf
spectrophotometer 2.pdfspectrophotometer 2.pdf
spectrophotometer 2.pdf
 
UV rays
UV rays UV rays
UV rays
 
UV Spectroscopy.pptx FINAL YEAR SEVENTH SEM
UV Spectroscopy.pptx FINAL YEAR SEVENTH SEMUV Spectroscopy.pptx FINAL YEAR SEVENTH SEM
UV Spectroscopy.pptx FINAL YEAR SEVENTH SEM
 
Single beam spectrophotometer
Single beam spectrophotometer Single beam spectrophotometer
Single beam spectrophotometer
 
UV-VIS SPECTROSCOPY
UV-VIS SPECTROSCOPYUV-VIS SPECTROSCOPY
UV-VIS SPECTROSCOPY
 
Spectroscopy.pptx
Spectroscopy.pptxSpectroscopy.pptx
Spectroscopy.pptx
 
UV SPECTROSCOPY ppt.pptx
UV SPECTROSCOPY ppt.pptxUV SPECTROSCOPY ppt.pptx
UV SPECTROSCOPY ppt.pptx
 
UV SPECTROSCOPY ppt.pptx
UV SPECTROSCOPY ppt.pptxUV SPECTROSCOPY ppt.pptx
UV SPECTROSCOPY ppt.pptx
 
performance and specifications of spectrophotometer
performance and specifications of spectrophotometerperformance and specifications of spectrophotometer
performance and specifications of spectrophotometer
 
Application Of Biochemical Tools And Techniques.
Application Of Biochemical Tools And Techniques.Application Of Biochemical Tools And Techniques.
Application Of Biochemical Tools And Techniques.
 
Instrumentation of UV- Visible Spectroscopy.pptx
Instrumentation of UV- Visible Spectroscopy.pptxInstrumentation of UV- Visible Spectroscopy.pptx
Instrumentation of UV- Visible Spectroscopy.pptx
 
biophysics 1 spectroscopy
biophysics 1 spectroscopy biophysics 1 spectroscopy
biophysics 1 spectroscopy
 
Uv spectroscopy
Uv spectroscopyUv spectroscopy
Uv spectroscopy
 
Ultraviolet and visible spectroscopy
Ultraviolet and visible  spectroscopyUltraviolet and visible  spectroscopy
Ultraviolet and visible spectroscopy
 
Design of spectrophotometry
Design of spectrophotometryDesign of spectrophotometry
Design of spectrophotometry
 
Spetrophotometer
SpetrophotometerSpetrophotometer
Spetrophotometer
 

More from ARUNNT2

biologics and biosimilars.pptx
biologics and biosimilars.pptxbiologics and biosimilars.pptx
biologics and biosimilars.pptxARUNNT2
 
Session-3-Status-of-the-Biosimilar-Market-–-Approvals-Challenges-and-Outlook-...
Session-3-Status-of-the-Biosimilar-Market-–-Approvals-Challenges-and-Outlook-...Session-3-Status-of-the-Biosimilar-Market-–-Approvals-Challenges-and-Outlook-...
Session-3-Status-of-the-Biosimilar-Market-–-Approvals-Challenges-and-Outlook-...ARUNNT2
 
59500-275_Slides.pptx
59500-275_Slides.pptx59500-275_Slides.pptx
59500-275_Slides.pptxARUNNT2
 
6405732.ppt
6405732.ppt6405732.ppt
6405732.pptARUNNT2
 
4440642.ppt
4440642.ppt4440642.ppt
4440642.pptARUNNT2
 
3Slide_Presentation_for_Lee_Ferguson,_Ph.D.,_Duke_University.ppt
3Slide_Presentation_for_Lee_Ferguson,_Ph.D.,_Duke_University.ppt3Slide_Presentation_for_Lee_Ferguson,_Ph.D.,_Duke_University.ppt
3Slide_Presentation_for_Lee_Ferguson,_Ph.D.,_Duke_University.pptARUNNT2
 
Day 1 MSMS theory.ppt
Day 1 MSMS theory.pptDay 1 MSMS theory.ppt
Day 1 MSMS theory.pptARUNNT2
 

More from ARUNNT2 (8)

biologics and biosimilars.pptx
biologics and biosimilars.pptxbiologics and biosimilars.pptx
biologics and biosimilars.pptx
 
Session-3-Status-of-the-Biosimilar-Market-–-Approvals-Challenges-and-Outlook-...
Session-3-Status-of-the-Biosimilar-Market-–-Approvals-Challenges-and-Outlook-...Session-3-Status-of-the-Biosimilar-Market-–-Approvals-Challenges-and-Outlook-...
Session-3-Status-of-the-Biosimilar-Market-–-Approvals-Challenges-and-Outlook-...
 
Session-3-Status-of-the-Biosimilar-Market-–-Approvals-Challenges-and-Outlook-...
Session-3-Status-of-the-Biosimilar-Market-–-Approvals-Challenges-and-Outlook-...Session-3-Status-of-the-Biosimilar-Market-–-Approvals-Challenges-and-Outlook-...
Session-3-Status-of-the-Biosimilar-Market-–-Approvals-Challenges-and-Outlook-...
 
59500-275_Slides.pptx
59500-275_Slides.pptx59500-275_Slides.pptx
59500-275_Slides.pptx
 
6405732.ppt
6405732.ppt6405732.ppt
6405732.ppt
 
4440642.ppt
4440642.ppt4440642.ppt
4440642.ppt
 
3Slide_Presentation_for_Lee_Ferguson,_Ph.D.,_Duke_University.ppt
3Slide_Presentation_for_Lee_Ferguson,_Ph.D.,_Duke_University.ppt3Slide_Presentation_for_Lee_Ferguson,_Ph.D.,_Duke_University.ppt
3Slide_Presentation_for_Lee_Ferguson,_Ph.D.,_Duke_University.ppt
 
Day 1 MSMS theory.ppt
Day 1 MSMS theory.pptDay 1 MSMS theory.ppt
Day 1 MSMS theory.ppt
 

Recently uploaded

Sectors of the Indian Economy - Class 10 Study Notes pdf
Sectors of the Indian Economy - Class 10 Study Notes pdfSectors of the Indian Economy - Class 10 Study Notes pdf
Sectors of the Indian Economy - Class 10 Study Notes pdfVivekanand Anglo Vedic Academy
 
The Art Pastor's Guide to Sabbath | Steve Thomason
The Art Pastor's Guide to Sabbath | Steve ThomasonThe Art Pastor's Guide to Sabbath | Steve Thomason
The Art Pastor's Guide to Sabbath | Steve ThomasonSteve Thomason
 
How to Create Map Views in the Odoo 17 ERP
How to Create Map Views in the Odoo 17 ERPHow to Create Map Views in the Odoo 17 ERP
How to Create Map Views in the Odoo 17 ERPCeline George
 
Basic_QTL_Marker-assisted_Selection_Sourabh.ppt
Basic_QTL_Marker-assisted_Selection_Sourabh.pptBasic_QTL_Marker-assisted_Selection_Sourabh.ppt
Basic_QTL_Marker-assisted_Selection_Sourabh.pptSourabh Kumar
 
aaaaaaaaaaaaaaaaaaaaaaaaaaaaaaaaaaaaaaaaa
aaaaaaaaaaaaaaaaaaaaaaaaaaaaaaaaaaaaaaaaaaaaaaaaaaaaaaaaaaaaaaaaaaaaaaaaaaaaaaaaaa
aaaaaaaaaaaaaaaaaaaaaaaaaaaaaaaaaaaaaaaaasiemaillard
 
Jose-Rizal-and-Philippine-Nationalism-National-Symbol-2.pptx
Jose-Rizal-and-Philippine-Nationalism-National-Symbol-2.pptxJose-Rizal-and-Philippine-Nationalism-National-Symbol-2.pptx
Jose-Rizal-and-Philippine-Nationalism-National-Symbol-2.pptxricssacare
 
GIÁO ÁN DẠY THÊM (KẾ HOẠCH BÀI BUỔI 2) - TIẾNG ANH 8 GLOBAL SUCCESS (2 CỘT) N...
GIÁO ÁN DẠY THÊM (KẾ HOẠCH BÀI BUỔI 2) - TIẾNG ANH 8 GLOBAL SUCCESS (2 CỘT) N...GIÁO ÁN DẠY THÊM (KẾ HOẠCH BÀI BUỔI 2) - TIẾNG ANH 8 GLOBAL SUCCESS (2 CỘT) N...
GIÁO ÁN DẠY THÊM (KẾ HOẠCH BÀI BUỔI 2) - TIẾNG ANH 8 GLOBAL SUCCESS (2 CỘT) N...Nguyen Thanh Tu Collection
 
Open Educational Resources Primer PowerPoint
Open Educational Resources Primer PowerPointOpen Educational Resources Primer PowerPoint
Open Educational Resources Primer PowerPointELaRue0
 
[GDSC YCCE] Build with AI Online Presentation
[GDSC YCCE] Build with AI Online Presentation[GDSC YCCE] Build with AI Online Presentation
[GDSC YCCE] Build with AI Online PresentationGDSCYCCE
 
Basic Civil Engg Notes_Chapter-6_Environment Pollution & Engineering
Basic Civil Engg Notes_Chapter-6_Environment Pollution & EngineeringBasic Civil Engg Notes_Chapter-6_Environment Pollution & Engineering
Basic Civil Engg Notes_Chapter-6_Environment Pollution & EngineeringDenish Jangid
 
Keeping Your Information Safe with Centralized Security Services
Keeping Your Information Safe with Centralized Security ServicesKeeping Your Information Safe with Centralized Security Services
Keeping Your Information Safe with Centralized Security ServicesTechSoup
 
Gyanartha SciBizTech Quiz slideshare.pptx
Gyanartha SciBizTech Quiz slideshare.pptxGyanartha SciBizTech Quiz slideshare.pptx
Gyanartha SciBizTech Quiz slideshare.pptxShibin Azad
 
Basic phrases for greeting and assisting costumers
Basic phrases for greeting and assisting costumersBasic phrases for greeting and assisting costumers
Basic phrases for greeting and assisting costumersPedroFerreira53928
 
50 ĐỀ LUYỆN THI IOE LỚP 9 - NĂM HỌC 2022-2023 (CÓ LINK HÌNH, FILE AUDIO VÀ ĐÁ...
50 ĐỀ LUYỆN THI IOE LỚP 9 - NĂM HỌC 2022-2023 (CÓ LINK HÌNH, FILE AUDIO VÀ ĐÁ...50 ĐỀ LUYỆN THI IOE LỚP 9 - NĂM HỌC 2022-2023 (CÓ LINK HÌNH, FILE AUDIO VÀ ĐÁ...
50 ĐỀ LUYỆN THI IOE LỚP 9 - NĂM HỌC 2022-2023 (CÓ LINK HÌNH, FILE AUDIO VÀ ĐÁ...Nguyen Thanh Tu Collection
 
How to Manage Notification Preferences in the Odoo 17
How to Manage Notification Preferences in the Odoo 17How to Manage Notification Preferences in the Odoo 17
How to Manage Notification Preferences in the Odoo 17Celine George
 
Research Methods in Psychology | Cambridge AS Level | Cambridge Assessment In...
Research Methods in Psychology | Cambridge AS Level | Cambridge Assessment In...Research Methods in Psychology | Cambridge AS Level | Cambridge Assessment In...
Research Methods in Psychology | Cambridge AS Level | Cambridge Assessment In...Abhinav Gaur Kaptaan
 

Recently uploaded (20)

Sectors of the Indian Economy - Class 10 Study Notes pdf
Sectors of the Indian Economy - Class 10 Study Notes pdfSectors of the Indian Economy - Class 10 Study Notes pdf
Sectors of the Indian Economy - Class 10 Study Notes pdf
 
The Art Pastor's Guide to Sabbath | Steve Thomason
The Art Pastor's Guide to Sabbath | Steve ThomasonThe Art Pastor's Guide to Sabbath | Steve Thomason
The Art Pastor's Guide to Sabbath | Steve Thomason
 
How to Create Map Views in the Odoo 17 ERP
How to Create Map Views in the Odoo 17 ERPHow to Create Map Views in the Odoo 17 ERP
How to Create Map Views in the Odoo 17 ERP
 
Basic_QTL_Marker-assisted_Selection_Sourabh.ppt
Basic_QTL_Marker-assisted_Selection_Sourabh.pptBasic_QTL_Marker-assisted_Selection_Sourabh.ppt
Basic_QTL_Marker-assisted_Selection_Sourabh.ppt
 
Operations Management - Book1.p - Dr. Abdulfatah A. Salem
Operations Management - Book1.p  - Dr. Abdulfatah A. SalemOperations Management - Book1.p  - Dr. Abdulfatah A. Salem
Operations Management - Book1.p - Dr. Abdulfatah A. Salem
 
aaaaaaaaaaaaaaaaaaaaaaaaaaaaaaaaaaaaaaaaa
aaaaaaaaaaaaaaaaaaaaaaaaaaaaaaaaaaaaaaaaaaaaaaaaaaaaaaaaaaaaaaaaaaaaaaaaaaaaaaaaaa
aaaaaaaaaaaaaaaaaaaaaaaaaaaaaaaaaaaaaaaaa
 
Jose-Rizal-and-Philippine-Nationalism-National-Symbol-2.pptx
Jose-Rizal-and-Philippine-Nationalism-National-Symbol-2.pptxJose-Rizal-and-Philippine-Nationalism-National-Symbol-2.pptx
Jose-Rizal-and-Philippine-Nationalism-National-Symbol-2.pptx
 
GIÁO ÁN DẠY THÊM (KẾ HOẠCH BÀI BUỔI 2) - TIẾNG ANH 8 GLOBAL SUCCESS (2 CỘT) N...
GIÁO ÁN DẠY THÊM (KẾ HOẠCH BÀI BUỔI 2) - TIẾNG ANH 8 GLOBAL SUCCESS (2 CỘT) N...GIÁO ÁN DẠY THÊM (KẾ HOẠCH BÀI BUỔI 2) - TIẾNG ANH 8 GLOBAL SUCCESS (2 CỘT) N...
GIÁO ÁN DẠY THÊM (KẾ HOẠCH BÀI BUỔI 2) - TIẾNG ANH 8 GLOBAL SUCCESS (2 CỘT) N...
 
Open Educational Resources Primer PowerPoint
Open Educational Resources Primer PowerPointOpen Educational Resources Primer PowerPoint
Open Educational Resources Primer PowerPoint
 
B.ed spl. HI pdusu exam paper-2023-24.pdf
B.ed spl. HI pdusu exam paper-2023-24.pdfB.ed spl. HI pdusu exam paper-2023-24.pdf
B.ed spl. HI pdusu exam paper-2023-24.pdf
 
[GDSC YCCE] Build with AI Online Presentation
[GDSC YCCE] Build with AI Online Presentation[GDSC YCCE] Build with AI Online Presentation
[GDSC YCCE] Build with AI Online Presentation
 
Basic Civil Engg Notes_Chapter-6_Environment Pollution & Engineering
Basic Civil Engg Notes_Chapter-6_Environment Pollution & EngineeringBasic Civil Engg Notes_Chapter-6_Environment Pollution & Engineering
Basic Civil Engg Notes_Chapter-6_Environment Pollution & Engineering
 
Keeping Your Information Safe with Centralized Security Services
Keeping Your Information Safe with Centralized Security ServicesKeeping Your Information Safe with Centralized Security Services
Keeping Your Information Safe with Centralized Security Services
 
Gyanartha SciBizTech Quiz slideshare.pptx
Gyanartha SciBizTech Quiz slideshare.pptxGyanartha SciBizTech Quiz slideshare.pptx
Gyanartha SciBizTech Quiz slideshare.pptx
 
NCERT Solutions Power Sharing Class 10 Notes pdf
NCERT Solutions Power Sharing Class 10 Notes pdfNCERT Solutions Power Sharing Class 10 Notes pdf
NCERT Solutions Power Sharing Class 10 Notes pdf
 
Basic phrases for greeting and assisting costumers
Basic phrases for greeting and assisting costumersBasic phrases for greeting and assisting costumers
Basic phrases for greeting and assisting costumers
 
50 ĐỀ LUYỆN THI IOE LỚP 9 - NĂM HỌC 2022-2023 (CÓ LINK HÌNH, FILE AUDIO VÀ ĐÁ...
50 ĐỀ LUYỆN THI IOE LỚP 9 - NĂM HỌC 2022-2023 (CÓ LINK HÌNH, FILE AUDIO VÀ ĐÁ...50 ĐỀ LUYỆN THI IOE LỚP 9 - NĂM HỌC 2022-2023 (CÓ LINK HÌNH, FILE AUDIO VÀ ĐÁ...
50 ĐỀ LUYỆN THI IOE LỚP 9 - NĂM HỌC 2022-2023 (CÓ LINK HÌNH, FILE AUDIO VÀ ĐÁ...
 
How to Manage Notification Preferences in the Odoo 17
How to Manage Notification Preferences in the Odoo 17How to Manage Notification Preferences in the Odoo 17
How to Manage Notification Preferences in the Odoo 17
 
Research Methods in Psychology | Cambridge AS Level | Cambridge Assessment In...
Research Methods in Psychology | Cambridge AS Level | Cambridge Assessment In...Research Methods in Psychology | Cambridge AS Level | Cambridge Assessment In...
Research Methods in Psychology | Cambridge AS Level | Cambridge Assessment In...
 
Introduction to Quality Improvement Essentials
Introduction to Quality Improvement EssentialsIntroduction to Quality Improvement Essentials
Introduction to Quality Improvement Essentials
 

UVSpectroscopy.pptx

  • 1. UV-VIS SPECTROSCOPY Khadeja Mahmud Al-masri. Department of Physics, Al-Najah University Experimental Physics 422595 Prof. Issam Ashqar 15 July 2020 spectrophotometer
  • 2. ABSTRACT  Spectroscopy is the study of interaction of electromagnetic radiation with matter.1  Basic principle of spectroscopy is the Beer-Lambert’s law.  In UV-VIS Spectroscopy, a continuum range of wavelengths from 200nm to 900nm is used.2  Spectrophotometer device is used in UV-VIS Spectroscopy. See figure1.  Components of spectrophotometer  Sources of light(200nm to 900nm).  Monochromator.  Sample solution in cuvette.  Detectors.  Readout devices.  Types of spectrophotometer Single and double beam instruments.  Applications of UV-VIS Spectroscopy Qualitative &Quantitative analyses.3 FIG 1.Spectophotometer.
  • 3. INTRODUCTION  Spectroscopy is the branch of science which deals with interaction of electromagnetic radiation with materials. In other words it is an analytical method for qualitative and quantitative analysis by use of light.  The Lambert Beer law in 1852 made the basis for the quantitative evaluation of absorption measurements.2
  • 4.  This led firstly to colorimetry, then to photometry and finally to spectrophotometry.  This evolution was along with the development of detectors for measuring light intensities, i.e. silicon photo-diode detector.  Spectroscopy is widely used as an exploratory tool in the fields of physics, , and chemistry, for determination of composition, physical structure and electronic structure of matter at atomic scale, molecular scale, and macro scale.4
  • 5. 1.SPECTROSCOPY  When an Electromagnetic radiation is incident on a matter, phenomena like reflection, transmission, absorption ,are occurring.4  Spectroscopy is the study of interaction of electromagnetic radiation with matter based on the Bohr-Einstein frequency relationship E=hv , here h is the proportionality constant called Planck’s constant (6.626 x 10⁻³⁴ J s) and v is frequency.
  • 6.  Measurement of radiation intensity as a function of wavelength is described by spectroscopy, as shown in figure 2.  All forms of spectroscopy use part of the electromagnetic radiation to give us information about the materials. FIG.2.Spectroscopy graph.
  • 7. 1.1 SPECTRUM  The spectrum is formed by electromagnetic waves and the wavelength is varies. See figure 3.  When a narrow beam of light is allowed to pass through a prism/grating, it is dispersed into seven colors from red to violet and the band is called Spectrum.. See figure 4. FIG.3.Electromagnatic spectrum. FIG.4.Glase prism dispersion
  • 8. 1.2 PRINCIPLE Basic principle of spectroscopy is the Beer-Lambert’s law.2 1.2.1 BEER LAW  Beer's law stated that absorbance is proportional to the concentrations of the material sample. 1.2.2 LAMBERT LAW  Lambert's law stated that absorbance of a material is directly proportional to its thickness (path length).
  • 9.  The modern derivation of the Beer–Lambert law combines the two laws and correlates the absorbance to both the concentrations and the thickness of the material. FIG 5. Beer–Lambert law.
  • 10. 2. UV-VISIBLE SPECTROSCOPY  Ultraviolet–visible spectrum can be generated when ultraviolet light and visible light(200-900nm) are absorbed by materials. The spectrum can be used to analyze the composition and the structure of the materials. For a particular wavelength in the ultraviolet– visible ranges, the absorption degree is proportional to the components of the materials. Therefore, the characteristics of the materials are quantitatively reflected by the spectrum, which changes with the wave-length.1  Ultraviolet–visible spectrum consists of an absorption spectrum. An absorption spectrum gives information about the molar absorptivity, concentration of the sample, optical bath length. See figure6, in previous slid.
  • 11. 2.1 INSTRUMENTATION  2.1.1 SOURCE of LIGHT.  2.1.2 MONOCHROMATOR.  2.1.3 SMPLE SOLIOTION in CUVETTE.  2.1.4 PHOTO DETECTOR.  2.1.5 READOUT DEVICE. FIG 6.Components of spectrophotometer.
  • 12. 2.1.1 SOURCE OF LIGHT  Part of the UV and Visible radiation source is Tungsten lamp. See figure 7.  UV radiation source is Deuterium or Hydrogen lamp . See figure 8.  Range of wavelength 200-400 nm. FIG.7.Tungsten lamp FIG.8.Deuterium lamp
  • 13. 2.1.2 MONOCHROMATOR  It is a device that breaks the polychromatic radiation into component wavelengths. See figure 9. FIG.9.Monochromator components.
  • 14. The monochromator unit consists of : •Entrance slit: defines narrow beam of radiation from source. •Collimating mirror:(polished surface) collimates the lights. •Diffraction grating or Prism (make of quartz): disperses the light into specific wavelength. •Focusing mirror: captures the dispersed light & sharpens the same to the sample via exit slit •Exit slit: allows the corrected wavelength of light to the sample .
  • 15. 2.1.3 SMPLE SOLIOTION IN CUVETTE  liquid sample is usually contained in a cell called a cuvette. See figure10.  Fingerprints and droplets of water disrupt light rays during measurement.  Cuvette from Quartz can be used in UV as well as in visible spectroscopy.  Cuvette from Glass is suitable for visible but not for UV spectroscopy because it absorbs UV radiation. FIG 10.sample solution in cuvette
  • 16. 2.1.4 PHOTO DETECTOR  A photo detector is a semiconductor device which converts light energy to electrical energy. It consists of a simple P-N junction diode and is designed to work in reverse biased condition. The photons approaching the diode are absorbed by the photodiode and current is generated.4 See figure 11. FIG 11. Photodiode
  • 17. 2.1.5 READOUT DEVICE.  Digital screen to record an uv spectrograph with absorbance against the wavelength. ------------------------------------------------ 2.2 TYPES of SPECTROPHOTOMETER FIG 12. Types of spectrophotometer.
  • 18.  UV-Vis spectroscopy is used heavily in many different research areas to identify or quantify a sample.3  Chemical field: 1. Detection of impurities. 2. Structure of organic compounds (single or double bond, presence or absence of functional group). 3. Kinetics of reaction. 4. Manufacturing drugs.  Biological fields 1. quantify the amount of protein and DNA in a sample 2. quantify the amount of bacterial cells in a cell culture 2.3 APPLICATIONS OF UV-VIS SPECTROSCOPY.
  • 19. CONCLUSION  Major advantages of uv-vis spectroscopy are: 1. High sensitivity. 2. Require only small volume of sample. 3. Linearity over wide range of concentration. 4. Can be used with gradient elution.4  Major disadvantages of uv-vis spectroscopy are: 1. Not linear for high concentration. 2. Does not work with compounds that do not absorb light at this wavelength region. 3. Generates significant heat and requires external cooling.4
  • 20. REFERENCES  1 H.H. Perkampus. UV-VIS Spectroscopy and its Applications,(2013),pp. 15-20.  2 J.Q .Brown,and G.M .Palmer. Advances in quantitative UV–visible spectroscopy for clinical and pre-clinical application in cancer,(2009), pp.30-42.  3 M.M. Giusti, and R.E. Wrolstad. Characterization and measurement of anthocyanins by UV‐visible spectroscopy,(2001),pp.57-60.  4N.M.Kutty, UV-Visible spectroscopy, WWW Document (http://reports.ias.ac.in/report/19397/uv-visible-spectroscopy) ACKNOWLEDGEMENTS  First of all, I am thankful to my guide, then to Dr. Issam Ashqar, who has guided me throughout this course and made this project better.
  • 21.
  • 22. QUESTIONS FOR SELF- EVALUATION  what is uv spectroscopy?  What are the components of uv spectroscopy?  What are the principles of uv spectroscopy?  what are the applications of uv spectroscopy?