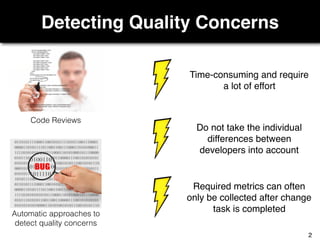
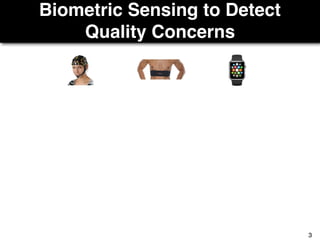
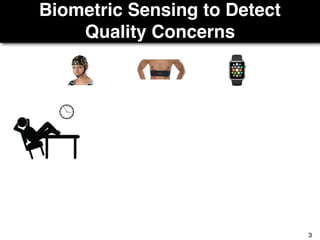
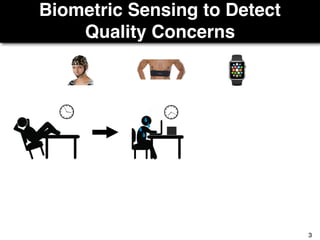
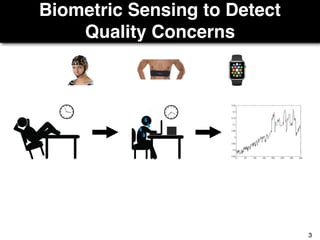
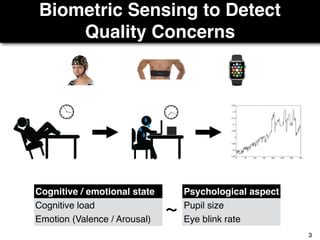
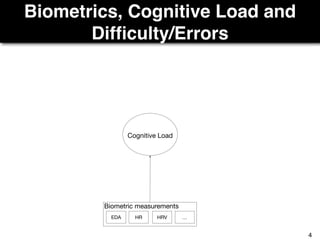
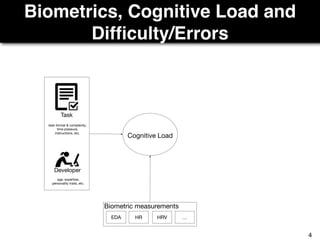
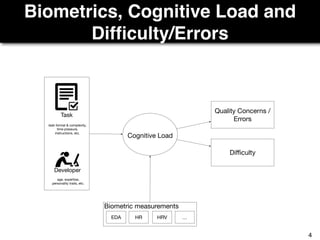
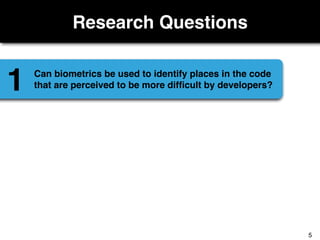
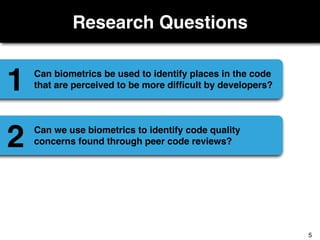
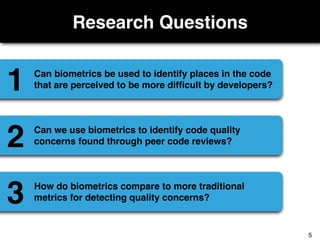
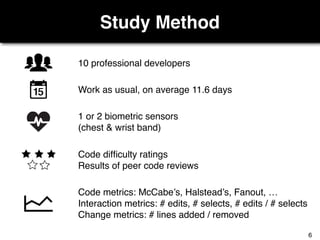
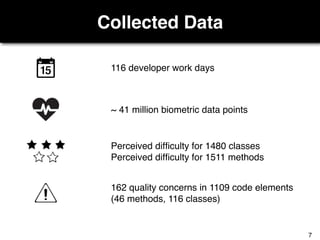
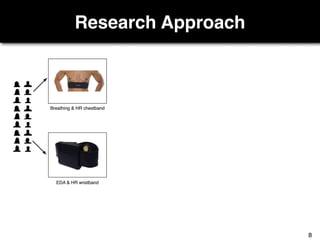
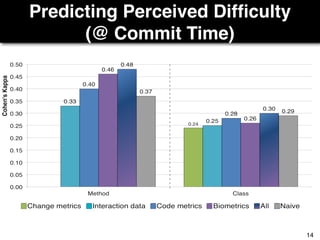
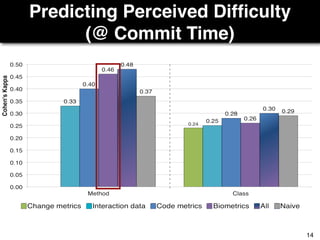
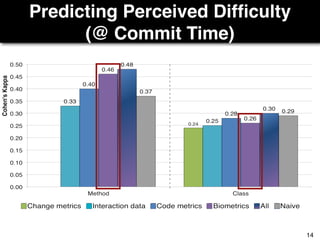
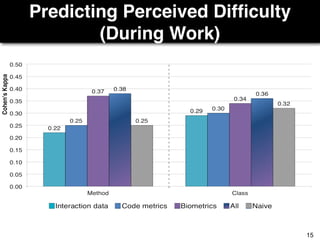
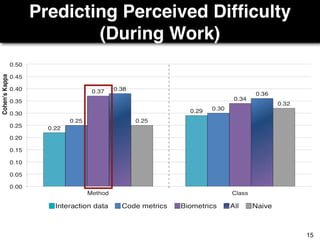
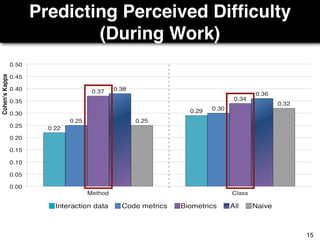
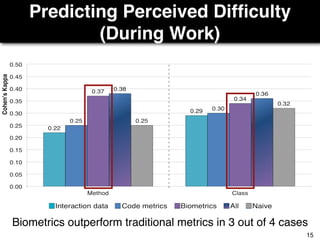
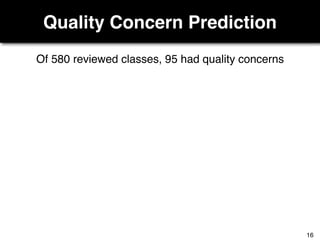
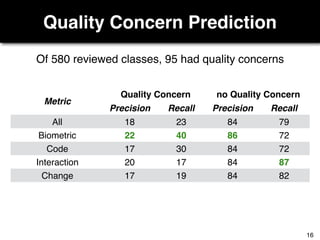
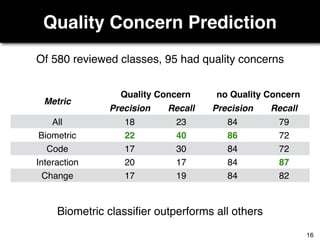
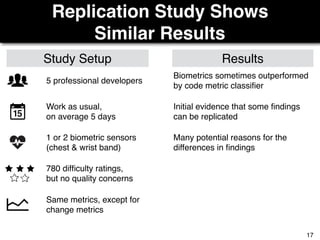
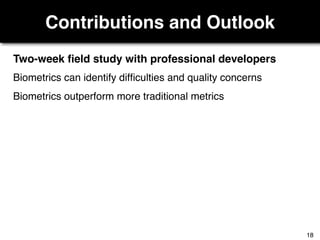
Using (Bio)Metrics to Predict
Code Quality Online
Sebastian Müller & Thomas Fritz
University of Zurich
“Every minute spent on not-quite-right
code counts as interest on that debt.”
Ward Cunningham
1
Detecting Quality Concerns
Code Reviews
Automatic approaches to
detect quality concerns
2
Detecting Quality Concerns
Code Reviews
Automatic approaches to
detect quality concerns
Required metrics can often
only be collected after change
task is completed
Do not take the individual
differences between
developers into account
Time-consuming and require
a lot of effort
2
Biometric Sensing to Detect
Quality Concerns
3
Biometric Sensing to Detect
Quality Concerns
3
Biometric Sensing to Detect
Quality Concerns
3
Biometric Sensing to Detect
Quality Concerns
3
Biometric Sensing to Detect
Quality Concerns
3
Biometric Sensing to Detect
Quality Concerns
Cognitive / emotional state Psychological aspect
Cognitive load Pupil size
Emotion (Valence / Arousal) Eye blink rate
3
EDA HR …HRV
Biometric measurements
Cognitive Load
Biometrics, Cognitive Load and
Difficulty/Errors
4
EDA HR …HRV
Biometric measurements
Cognitive Load
Task
Developer
task format & complexity,
time pressure,
instructions, etc.
age, expertise,
personality traits, etc.
Biometrics, Cognitive Load and
Difficulty/Errors
4
EDA HR …HRV
Biometric measurements
Cognitive Load
Task
Developer
task format & complexity,
time pressure,
instructions, etc.
age, expertise,
personality traits, etc.
Quality Concerns /
Errors
Difficulty
Biometrics, Cognitive Load and
Difficulty/Errors
4
Research Questions
5
Research Questions
Can biometrics be used to identify places in the code
that are perceived to be more difficult by developers?1
5
Research Questions
Can biometrics be used to identify places in the code
that are perceived to be more difficult by developers?1
Can we use biometrics to identify code quality
concerns found through peer code reviews?2
5
Research Questions
Can biometrics be used to identify places in the code
that are perceived to be more difficult by developers?1
Can we use biometrics to identify code quality
concerns found through peer code reviews?2
How do biometrics compare to more traditional
metrics for detecting quality concerns?3
5
Study Method
10 professional developers
Work as usual, on average 11.6 days
1 or 2 biometric sensors

(chest & wrist band)
Code difficulty ratings
Results of peer code reviews
Code metrics: McCabe’s, Halstead’s, Fanout, …
Interaction metrics: # edits, # selects, # edits / # selects
Change metrics: # lines added / removed
6
Collected Data
116 developer work days
162 quality concerns in 1109 code elements

(46 methods, 116 classes)
Perceived difficulty for 1480 classes
Perceived difficulty for 1511 methods
~ 41 million biometric data points
7
Research Approach
0 50 100 150 200 250 300 350
2.85
2.9
2.95
3
3.05
3.1
3.15
3.2
3.25
* *
*
0 50 100 150 200 250 300 350
-600
-400
-200
0
200
400
600
Developers’ perceived difficulty
& quality concerns
Data recording
Data cleaning
(e.g. noise canceling,
filtering invalid data)
Feature extraction
(e.g. normalization with baseline,
calculation of features)
Machine learning
(e.g. labelling, splitting, classification)
Breathing & HR chestband
EDA & HR wristband
Breathing data
Phasic EDA
8
Research Approach
Developers’ perceived difficulty
& quality concerns
Data recording
Data cleaning
(e.g. noise canceling,
filtering invalid data)
Feature extraction
(e.g. normalization with baseline,
calculation of features)
Machine learning
(e.g. labelling, splitting, classification)
8
Research Approach
Developers’ perceived difficulty
& quality concerns
Data recording
Data cleaning
(e.g. noise canceling,
filtering invalid data)
Feature extraction
(e.g. normalization with baseline,
calculation of features)
Machine learning
(e.g. labelling, splitting, classification)
Data Cleaning
Biometric data is notoriously noisy
Applied noise cleaning techniques
9
Research Approach
Developers’ perceived difficulty
& quality concerns
Data recording
Data cleaning
(e.g. noise canceling,
filtering invalid data)
Feature extraction
(e.g. normalization with baseline,
calculation of features)
Machine learning
(e.g. labelling, splitting, classification)
Feature Extraction
Feature extraction following established methods
{Min, Max}PeakAmpl; ∆NumPhasicPeaks/Min, …
EDA
Skin temperature
MeanTemp; ∆MeanTemp, …
HR(V)
∆MeanHR; ∆VarianceHR, …
RR
∆MeanRR; ∆Log10VarianceRR, …
9
Research Approach
Developers’ perceived difficulty
& quality concerns
Data recording
Data cleaning
(e.g. noise canceling,
filtering invalid data)
Feature extraction
(e.g. normalization with baseline,
calculation of features)
Machine learning
(e.g. labelling, splitting, classification)
Data Labelling and Splitting
Assign difficulty ratings to code elements
Segment biometric data
9
Data Labelling
time
1 2 3 4 5 6
10
Data Labelling
time
Mean
HeartRate
1 2 3 4 5 6
89 87
80
105 106
110
beats
per min
10
Data Labelling
time
Mean
HeartRate
1 2 3 4 5 6
Rating 1 Rating 2 Rating 3
89 87
80
105 106
110
beats
per min
10
Data Labelling
time
Mean
HeartRate
1 2 3 4 5 6
Rating 1 Rating 2 Rating 3
89 87
80
105 106
110
beats
per min
10
Data Labelling
time
Perceived
Difficulty
Mean
HeartRate
1 5
1 2 3 4 5 6
Rating 1 Rating 2 Rating 3
89 87
80
105 106
110
beats
per min
3 1 5 5
10
Research Approach
Developers’ perceived difficulty
& quality concerns
Data recording
Data cleaning
(e.g. noise canceling,
filtering invalid data)
Feature extraction
(e.g. normalization with baseline,
calculation of features)
Machine learning
(e.g. labelling, splitting, classification)
Data Labelling and Splitting
Assign difficulty ratings to code elements
Segment biometric data
11
Research Approach
Developers’ perceived difficulty
& quality concerns
Data recording
Data cleaning
(e.g. noise canceling,
filtering invalid data)
Feature extraction
(e.g. normalization with baseline,
calculation of features)
Machine learning
(e.g. labelling, splitting, classification)
Data Labelling and Splitting
Assign difficulty ratings to code elements
Segment biometric data
Machine Learning Classification
Leave-one-out approach with Random Forest
One classifier per metric and one for all
CE 1 CE 2 CE n-2 CE n-1 CE n
P01
…
11
Results
Developers’ Perceived Difficulty
easy
2073 (69.3%)
medium
829 (27.7%)
difficult
89 (3.0%)
Only few code elements are difficult
Difficulty perception changes over time,

despite code metrics do not change
13
Predicting Perceived Difficulty

(@ Commit Time)
14
Predicting Perceived Difficulty

(@ Commit Time)
14
Predicting Perceived Difficulty

(@ Commit Time)
14
Predicting Perceived Difficulty
(During Work)
15
Predicting Perceived Difficulty
(During Work)
15
Predicting Perceived Difficulty
(During Work)
15
Predicting Perceived Difficulty
(During Work)
Biometrics outperform traditional metrics in 3 out of 4 cases
15
Quality Concern Prediction
Of 580 reviewed classes, 95 had quality concerns
16
Quality Concern Prediction
Metric
Quality Concern no Quality Concern
Precision Recall Precision Recall
All 18 23 84 79
Biometric 22 40 86 72
Code 17 30 84 72
Interaction 20 17 84 87
Change 17 19 84 82
Of 580 reviewed classes, 95 had quality concerns
16
Quality Concern Prediction
Metric
Quality Concern no Quality Concern
Precision Recall Precision Recall
All 18 23 84 79
Biometric 22 40 86 72
Code 17 30 84 72
Interaction 20 17 84 87
Change 17 19 84 82
Of 580 reviewed classes, 95 had quality concerns
Biometric classifier outperforms all others
16
Replication Study Shows
Similar Results
5 professional developers
Work as usual,

on average 5 days
1 or 2 biometric sensors
(chest & wrist band)
780 difficulty ratings,
but no quality concerns
Study Setup
Same metrics, except for
change metrics
Results
Initial evidence that some findings
can be replicated
Biometrics sometimes outperformed
by code metric classifier
Many potential reasons for the
differences in findings
17
Contributions and Outlook
Two-week field study with professional developers
Biometrics can identify difficulties and quality concerns
Biometrics outperform more traditional metrics
18
Contributions and Outlook
Two-week field study with professional developers
New opportunities for developer support
Biometrics can identify difficulties and quality concerns
Biometrics outperform more traditional metrics
Support / intervene when developers experience difficulties
Identify quality concerns early on
Use new sensors to collect better data even less invasively
18

Using (Bio)Metrics To Predict Code Quality Online

  • 1.
    Using (Bio)Metrics toPredict Code Quality Online Sebastian Müller & Thomas Fritz University of Zurich
  • 2.
    “Every minute spenton not-quite-right code counts as interest on that debt.” Ward Cunningham 1
  • 3.
    Detecting Quality Concerns CodeReviews Automatic approaches to detect quality concerns 2
  • 4.
    Detecting Quality Concerns CodeReviews Automatic approaches to detect quality concerns Required metrics can often only be collected after change task is completed Do not take the individual differences between developers into account Time-consuming and require a lot of effort 2
  • 5.
    Biometric Sensing toDetect Quality Concerns 3
  • 6.
    Biometric Sensing toDetect Quality Concerns 3
  • 7.
    Biometric Sensing toDetect Quality Concerns 3
  • 8.
    Biometric Sensing toDetect Quality Concerns 3
  • 9.
    Biometric Sensing toDetect Quality Concerns 3
  • 10.
    Biometric Sensing toDetect Quality Concerns Cognitive / emotional state Psychological aspect Cognitive load Pupil size Emotion (Valence / Arousal) Eye blink rate 3
  • 11.
    EDA HR …HRV Biometricmeasurements Cognitive Load Biometrics, Cognitive Load and Difficulty/Errors 4
  • 12.
    EDA HR …HRV Biometricmeasurements Cognitive Load Task Developer task format & complexity, time pressure, instructions, etc. age, expertise, personality traits, etc. Biometrics, Cognitive Load and Difficulty/Errors 4
  • 13.
    EDA HR …HRV Biometricmeasurements Cognitive Load Task Developer task format & complexity, time pressure, instructions, etc. age, expertise, personality traits, etc. Quality Concerns / Errors Difficulty Biometrics, Cognitive Load and Difficulty/Errors 4
  • 14.
  • 15.
    Research Questions Can biometricsbe used to identify places in the code that are perceived to be more difficult by developers?1 5
  • 16.
    Research Questions Can biometricsbe used to identify places in the code that are perceived to be more difficult by developers?1 Can we use biometrics to identify code quality concerns found through peer code reviews?2 5
  • 17.
    Research Questions Can biometricsbe used to identify places in the code that are perceived to be more difficult by developers?1 Can we use biometrics to identify code quality concerns found through peer code reviews?2 How do biometrics compare to more traditional metrics for detecting quality concerns?3 5
  • 18.
    Study Method 10 professionaldevelopers Work as usual, on average 11.6 days 1 or 2 biometric sensors
 (chest & wrist band) Code difficulty ratings Results of peer code reviews Code metrics: McCabe’s, Halstead’s, Fanout, … Interaction metrics: # edits, # selects, # edits / # selects Change metrics: # lines added / removed 6
  • 19.
    Collected Data 116 developerwork days 162 quality concerns in 1109 code elements
 (46 methods, 116 classes) Perceived difficulty for 1480 classes Perceived difficulty for 1511 methods ~ 41 million biometric data points 7
  • 20.
    Research Approach 0 50100 150 200 250 300 350 2.85 2.9 2.95 3 3.05 3.1 3.15 3.2 3.25 * * * 0 50 100 150 200 250 300 350 -600 -400 -200 0 200 400 600 Developers’ perceived difficulty & quality concerns Data recording Data cleaning (e.g. noise canceling, filtering invalid data) Feature extraction (e.g. normalization with baseline, calculation of features) Machine learning (e.g. labelling, splitting, classification) Breathing & HR chestband EDA & HR wristband Breathing data Phasic EDA 8
  • 21.
    Research Approach 0 50100 150 200 250 300 350 2.85 2.9 2.95 3 3.05 3.1 3.15 3.2 3.25 * * * 0 50 100 150 200 250 300 350 -600 -400 -200 0 200 400 600 Developers’ perceived difficulty & quality concerns Data recording Data cleaning (e.g. noise canceling, filtering invalid data) Feature extraction (e.g. normalization with baseline, calculation of features) Machine learning (e.g. labelling, splitting, classification) Breathing & HR chestband EDA & HR wristband Breathing data Phasic EDA 8
  • 22.
    Research Approach 0 50100 150 200 250 300 350 2.85 2.9 2.95 3 3.05 3.1 3.15 3.2 3.25 * * * 0 50 100 150 200 250 300 350 -600 -400 -200 0 200 400 600 Developers’ perceived difficulty & quality concerns Data recording Data cleaning (e.g. noise canceling, filtering invalid data) Feature extraction (e.g. normalization with baseline, calculation of features) Machine learning (e.g. labelling, splitting, classification) Breathing & HR chestband EDA & HR wristband Breathing data Phasic EDA 8
  • 23.
    Research Approach Developers’ perceiveddifficulty & quality concerns Data recording Data cleaning (e.g. noise canceling, filtering invalid data) Feature extraction (e.g. normalization with baseline, calculation of features) Machine learning (e.g. labelling, splitting, classification) 8
  • 24.
    Research Approach Developers’ perceiveddifficulty & quality concerns Data recording Data cleaning (e.g. noise canceling, filtering invalid data) Feature extraction (e.g. normalization with baseline, calculation of features) Machine learning (e.g. labelling, splitting, classification) Data Cleaning Biometric data is notoriously noisy Applied noise cleaning techniques 9
  • 25.
    Research Approach Developers’ perceiveddifficulty & quality concerns Data recording Data cleaning (e.g. noise canceling, filtering invalid data) Feature extraction (e.g. normalization with baseline, calculation of features) Machine learning (e.g. labelling, splitting, classification) Feature Extraction Feature extraction following established methods {Min, Max}PeakAmpl; ∆NumPhasicPeaks/Min, … EDA Skin temperature MeanTemp; ∆MeanTemp, … HR(V) ∆MeanHR; ∆VarianceHR, … RR ∆MeanRR; ∆Log10VarianceRR, … 9
  • 26.
    Research Approach Developers’ perceiveddifficulty & quality concerns Data recording Data cleaning (e.g. noise canceling, filtering invalid data) Feature extraction (e.g. normalization with baseline, calculation of features) Machine learning (e.g. labelling, splitting, classification) Data Labelling and Splitting Assign difficulty ratings to code elements Segment biometric data 9
  • 27.
  • 28.
    Data Labelling time Mean HeartRate 1 23 4 5 6 89 87 80 105 106 110 beats per min 10
  • 29.
    Data Labelling time Mean HeartRate 1 23 4 5 6 Rating 1 Rating 2 Rating 3 89 87 80 105 106 110 beats per min 10
  • 30.
    Data Labelling time Mean HeartRate 1 23 4 5 6 Rating 1 Rating 2 Rating 3 89 87 80 105 106 110 beats per min 10
  • 31.
    Data Labelling time Perceived Difficulty Mean HeartRate 1 5 12 3 4 5 6 Rating 1 Rating 2 Rating 3 89 87 80 105 106 110 beats per min 3 1 5 5 10
  • 32.
    Research Approach Developers’ perceiveddifficulty & quality concerns Data recording Data cleaning (e.g. noise canceling, filtering invalid data) Feature extraction (e.g. normalization with baseline, calculation of features) Machine learning (e.g. labelling, splitting, classification) Data Labelling and Splitting Assign difficulty ratings to code elements Segment biometric data 11
  • 33.
    Research Approach Developers’ perceiveddifficulty & quality concerns Data recording Data cleaning (e.g. noise canceling, filtering invalid data) Feature extraction (e.g. normalization with baseline, calculation of features) Machine learning (e.g. labelling, splitting, classification) Data Labelling and Splitting Assign difficulty ratings to code elements Segment biometric data Machine Learning Classification Leave-one-out approach with Random Forest One classifier per metric and one for all CE 1 CE 2 CE n-2 CE n-1 CE n P01 … 11
  • 34.
  • 35.
    Developers’ Perceived Difficulty easy 2073(69.3%) medium 829 (27.7%) difficult 89 (3.0%) Only few code elements are difficult Difficulty perception changes over time,
 despite code metrics do not change 13
  • 36.
  • 37.
  • 38.
  • 39.
  • 40.
  • 41.
  • 42.
    Predicting Perceived Difficulty (DuringWork) Biometrics outperform traditional metrics in 3 out of 4 cases 15
  • 43.
    Quality Concern Prediction Of580 reviewed classes, 95 had quality concerns 16
  • 44.
    Quality Concern Prediction Metric QualityConcern no Quality Concern Precision Recall Precision Recall All 18 23 84 79 Biometric 22 40 86 72 Code 17 30 84 72 Interaction 20 17 84 87 Change 17 19 84 82 Of 580 reviewed classes, 95 had quality concerns 16
  • 45.
    Quality Concern Prediction Metric QualityConcern no Quality Concern Precision Recall Precision Recall All 18 23 84 79 Biometric 22 40 86 72 Code 17 30 84 72 Interaction 20 17 84 87 Change 17 19 84 82 Of 580 reviewed classes, 95 had quality concerns Biometric classifier outperforms all others 16
  • 46.
    Replication Study Shows SimilarResults 5 professional developers Work as usual,
 on average 5 days 1 or 2 biometric sensors (chest & wrist band) 780 difficulty ratings, but no quality concerns Study Setup Same metrics, except for change metrics Results Initial evidence that some findings can be replicated Biometrics sometimes outperformed by code metric classifier Many potential reasons for the differences in findings 17
  • 47.
    Contributions and Outlook Two-weekfield study with professional developers Biometrics can identify difficulties and quality concerns Biometrics outperform more traditional metrics 18
  • 48.
    Contributions and Outlook Two-weekfield study with professional developers New opportunities for developer support Biometrics can identify difficulties and quality concerns Biometrics outperform more traditional metrics Support / intervene when developers experience difficulties Identify quality concerns early on Use new sensors to collect better data even less invasively 18