Downloaded 14 times

![Overview
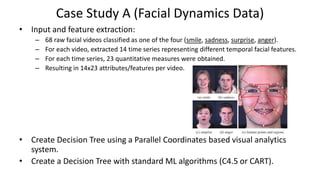
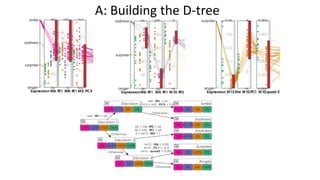
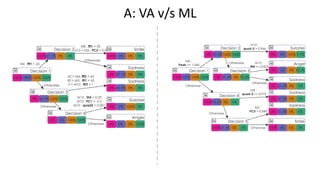
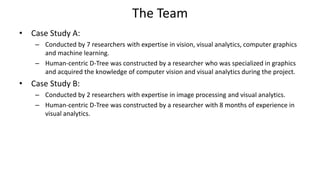
• Consider two classification case studies.
• Create a decision tree classifier applying standard ML algorithms.
• Create a decision tree classifier using visual analytics guided by “soft
knowledge” of a human model-developer.[1]
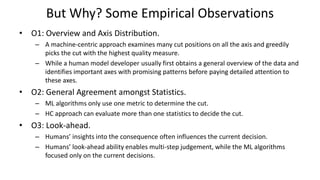
• Using Information theory explain why the human centric approach
performs better than the ML approach.
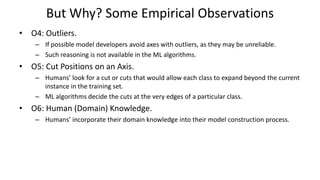
• Quantify the “soft knowledge” that a human centric approach takes
advantage of.
[1]: “Visualization of Time-Series Data in Parameter Space for Understanding Facial Dynamics”, G.K.L. Tam, H. Fang, A. J.
Aubrey, P.W. Grant, D. Marshall, M. Chen. Eurovis2011.](https://image.slidesharecdn.com/ananalysisofmachineandhumananalyticsinclassification-161210045903/85/An-analysis-of_machine_and_human_analytics_in_classification-3-320.jpg)
![Information Theoretic Analysis
• Estimated World Population : 7.4 billion
• Consider each person have 5 variations for each of the 4 expressions.
• The number of possible scenarios to capture : 148 billion
• The maximal entropy is 37.1 bits.
• We only know 68 cases(the raw training video)
• That is 1.7 x 10-8 bits. (a drop in the ocean)
• [ML] Optimistically, assuming the categorization retains 50% mutual
information. That leaves us with 8.5 x 10-9 bits of information.](https://image.slidesharecdn.com/ananalysisofmachineandhumananalyticsinclassification-161210045903/85/An-analysis-of_machine_and_human_analytics_in_classification-17-320.jpg)
![Information Theoretic Analysis
• [VA] Model developer may know some 200 people reasonably well, and
can recall their 5 variations of 4 expressions at ease. Conservatively, that is
equivalent to 4068 videos instead of 68. Representing 1.0 x 10-6 bits of
known information.
• [VA]When given an arbitrary facial image, the developer can also
reconstruct an expression using imagination e.g at least 1 variation per
expression. This ability accounts to 29.6 billion videos, representing 7.4
bits of known information. (This ability shows up in determining outliers).
• 7.4 bits v/s 8.5 x 10-9 bits . That is roughly 871 million times more
information content.](https://image.slidesharecdn.com/ananalysisofmachineandhumananalyticsinclassification-161210045903/85/An-analysis-of_machine_and_human_analytics_in_classification-18-320.jpg)

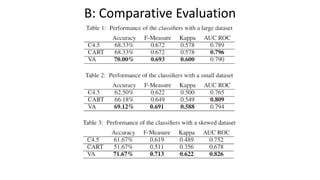
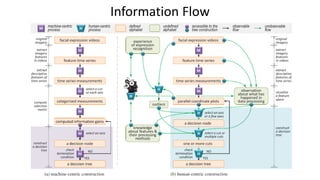
1) An analysis of machine learning and human-analytics classification models that found human-guided models performed better due to incorporating "soft knowledge" unavailable to machine models. 2) Two case studies were conducted comparing decision trees from visual analytics with human guidance to those from standard machine learning algorithms. 3) Humans were able to leverage soft knowledge like imagining outliers, looking ahead to future decisions, and incorporating domain expertise to construct superior classification models.