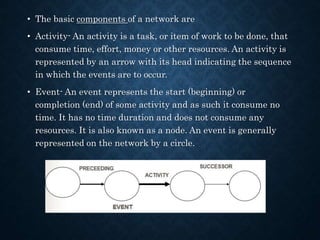
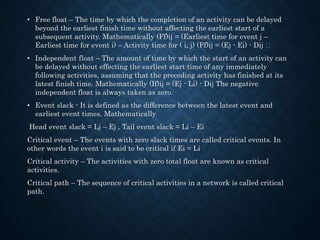
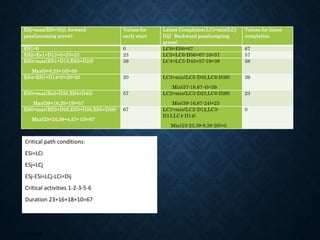
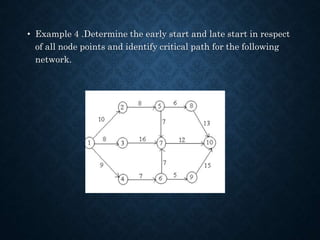
This document provides information about project management applications including definitions of a project, project life cycle, and examples of projects. It also discusses network planning techniques such as Program Evaluation and Review Technique (PERT) and Critical Path Method (CPM). The key steps in CPM including forward and backward passes to determine earliest and latest start/finish times are explained. Formulas for calculating total float, free float, and independent float are provided. An example problem demonstrates drawing a network diagram and identifying the critical path and project duration.


![• Forward Pass computation
• Step 1 :The computation begins from the start node and move
towards the end node. Set E1 = 0 to indicate that the project
starts at time 0
• Step 2
• i. Earliest starting time of activity (i, j) is the earliest event
time of the tail end event i.e. (Es)ij = Ei
• ii. Earliest finish time of activity (i, j) is the earliest starting
time + the activity time i.e. (Ef)ij = (Es)ij + Dij or (Ef)ij = Ei +
Dij
• iii. Earliest event time for event j is the maximum of the
earliest finish times of all activities ending in to that event i.e.
Ej = max [(Ef)ij for all immediate predecessor of (i, j)] or Ej
=max [Ei + Dij]](https://image.slidesharecdn.com/unit2-networkoptimization-210612173851/85/Unit2-network-optimization-14-320.jpg)
![• Backward Pass computation (for latest allowable time)
• Step 1 :For ending event assume E = L. (Remember that all E’s
have been computed by forward pass computations)to indicate that
the earliest and latest occurrences of the last node of the project
are the same.
• Step 2 :Latest finish time for activity (i, j) is equal to the latest
event time of event j i.e. (Lf)ij = Lj
• Step 3 :Latest starting time of activity (i, j) = the latest completion
time of (i, j) – the activity time or (Ls)ij =(Lf)ij - Dij or (Ls)ij = Lj –
Dij
• Step 4 :Latest event time for event ‘i’ is the minimum of the latest
start time of all activities originating from that event i.e. Li = min
[(Ls)ij for all immediate successor of (i, j)] = min [(Lf)ij - Dij] = min
[Lj - Dij]](https://image.slidesharecdn.com/unit2-networkoptimization-210612173851/85/Unit2-network-optimization-15-320.jpg)


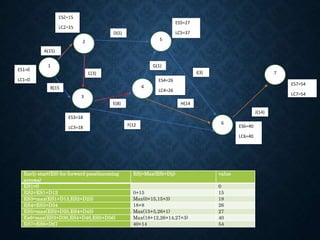


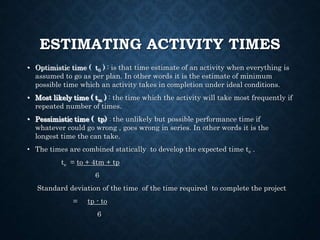

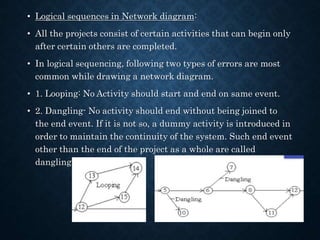
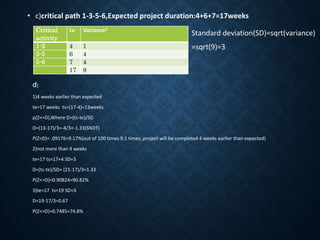
![Activity To tm tp Te=(to+4tm+
tp)/6
Variance 2 =[(tp-to)/6]2
1-2 1 1 7 12/6=2 6/6=(1)2=1
1-3 1 4 7 24/6=4 6/6=1
2-4 2 2 8 18/6=3 6/6=1
2-5 1 1 1 6/6=1 0
3-5 2 5 14 36/6=6 12/6= (2)2 =4
4-6 2 5 8 30/6=5 6/6=1
5-6 3 6 15 42/6=7 12/6=(2)2=4
6
4
5
3
2
1
A(2)
B(4)
C(3)
D(1)
E(6)
F(5)
G(7)
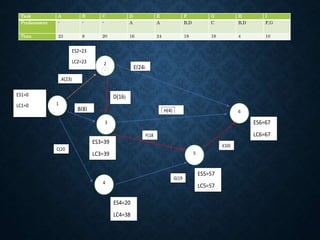
ES1=0
LC1=0
ES2=2
LC2=9
ES3=4
LC3=4
ES4=5
LC4=12
ES5=10
LC5=10
ES6=17
LC6=17
ESj=max(ESi+Dij)
LCi=min(LCj-Dij)](https://image.slidesharecdn.com/unit2-networkoptimization-210612173851/85/Unit2-network-optimization-36-320.jpg)
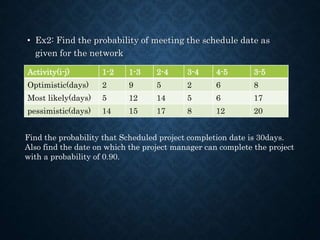
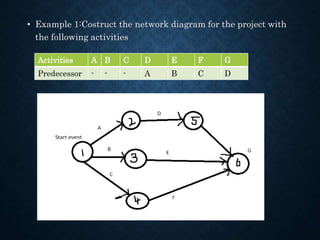
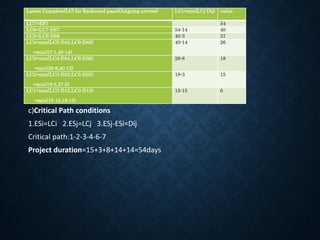
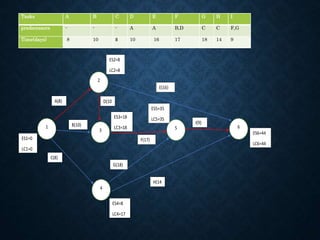
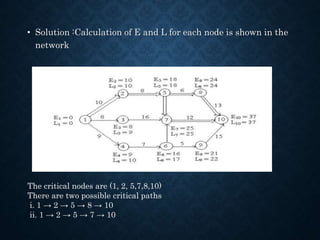
![Activity to tm tp Te=(to+4tm+tp)/6 Variance 2=[(tp-to)/6]2
1-2 2 5 14 36/6=6 12/6=22=4
1-3 9 12 15 72/6=12 6/6=12=1
2-4 5 14 17 78/6=13 12/6=22=4
3-4 2 5 8 30/6=5 6/6=12=1
3-5 8 17 20 96/6=16 12/6=22=4
4-5 6 6 12 42/6=7 6/6=12=1
5
4
3
2
1
A(6)
B(12
)
C(13
)
D(5)
E(16
)
B(7)
ES1=0
LC1=0
ES2=6
LC2=8
ES3=12
LC3=12
ES4=19
LC4=21
ES5=28
LC5=28
Critical path=1-3-5
Expected Project duration=12+16=28
Esj=max(ESi+Dij) and Lci=min(LCj-Dij)](https://image.slidesharecdn.com/unit2-networkoptimization-210612173851/85/Unit2-network-optimization-39-320.jpg)
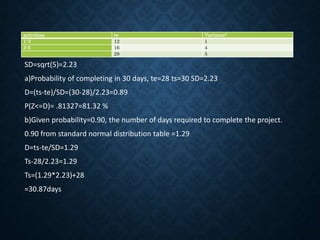
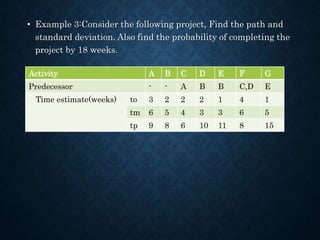
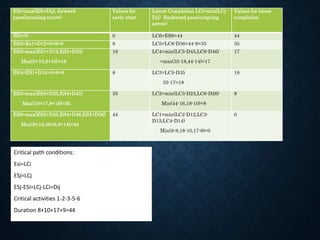
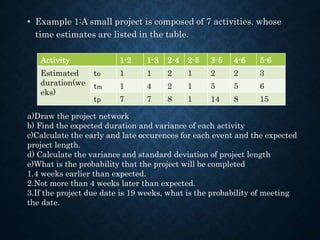
![6
5
4
3
2
1
A(6)
B(5)
C(4)
D(4)
E(4)
F(6)
G(6)
ES1=0
LC1=0
ES2=6
LC2=6
ES3=5
LC3=6
ES4=10
LC4=10
ES5=9
LC5=10
ES6=16
LC6=16
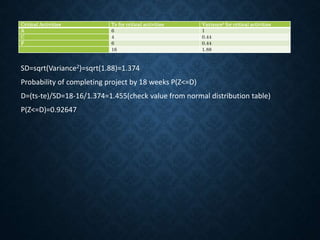
Activities To(week
s)
Tm(weeks
)
Tp(weeks) Te=(to+4tm+tp)/6 Variance2=[(tp-
to)/4]2
A 3 6 9 36/6=6 1
B 2 5 8 30/6=5 1
C 2 4 6 24/6=4 0.44
D 2 3 10 24/6=4 1.77
E 1 3 11 24/6=4 2.77
F 4 6 8 36/6=6 0.44
G 1 5 15 36/6=6 5.44
Esj=max(Esi+Dij) and Lci=min(LCj-Dij)
Critical path 1-2-4-6, Expected project duration=16weeks](https://image.slidesharecdn.com/unit2-networkoptimization-210612173851/85/Unit2-network-optimization-42-320.jpg)