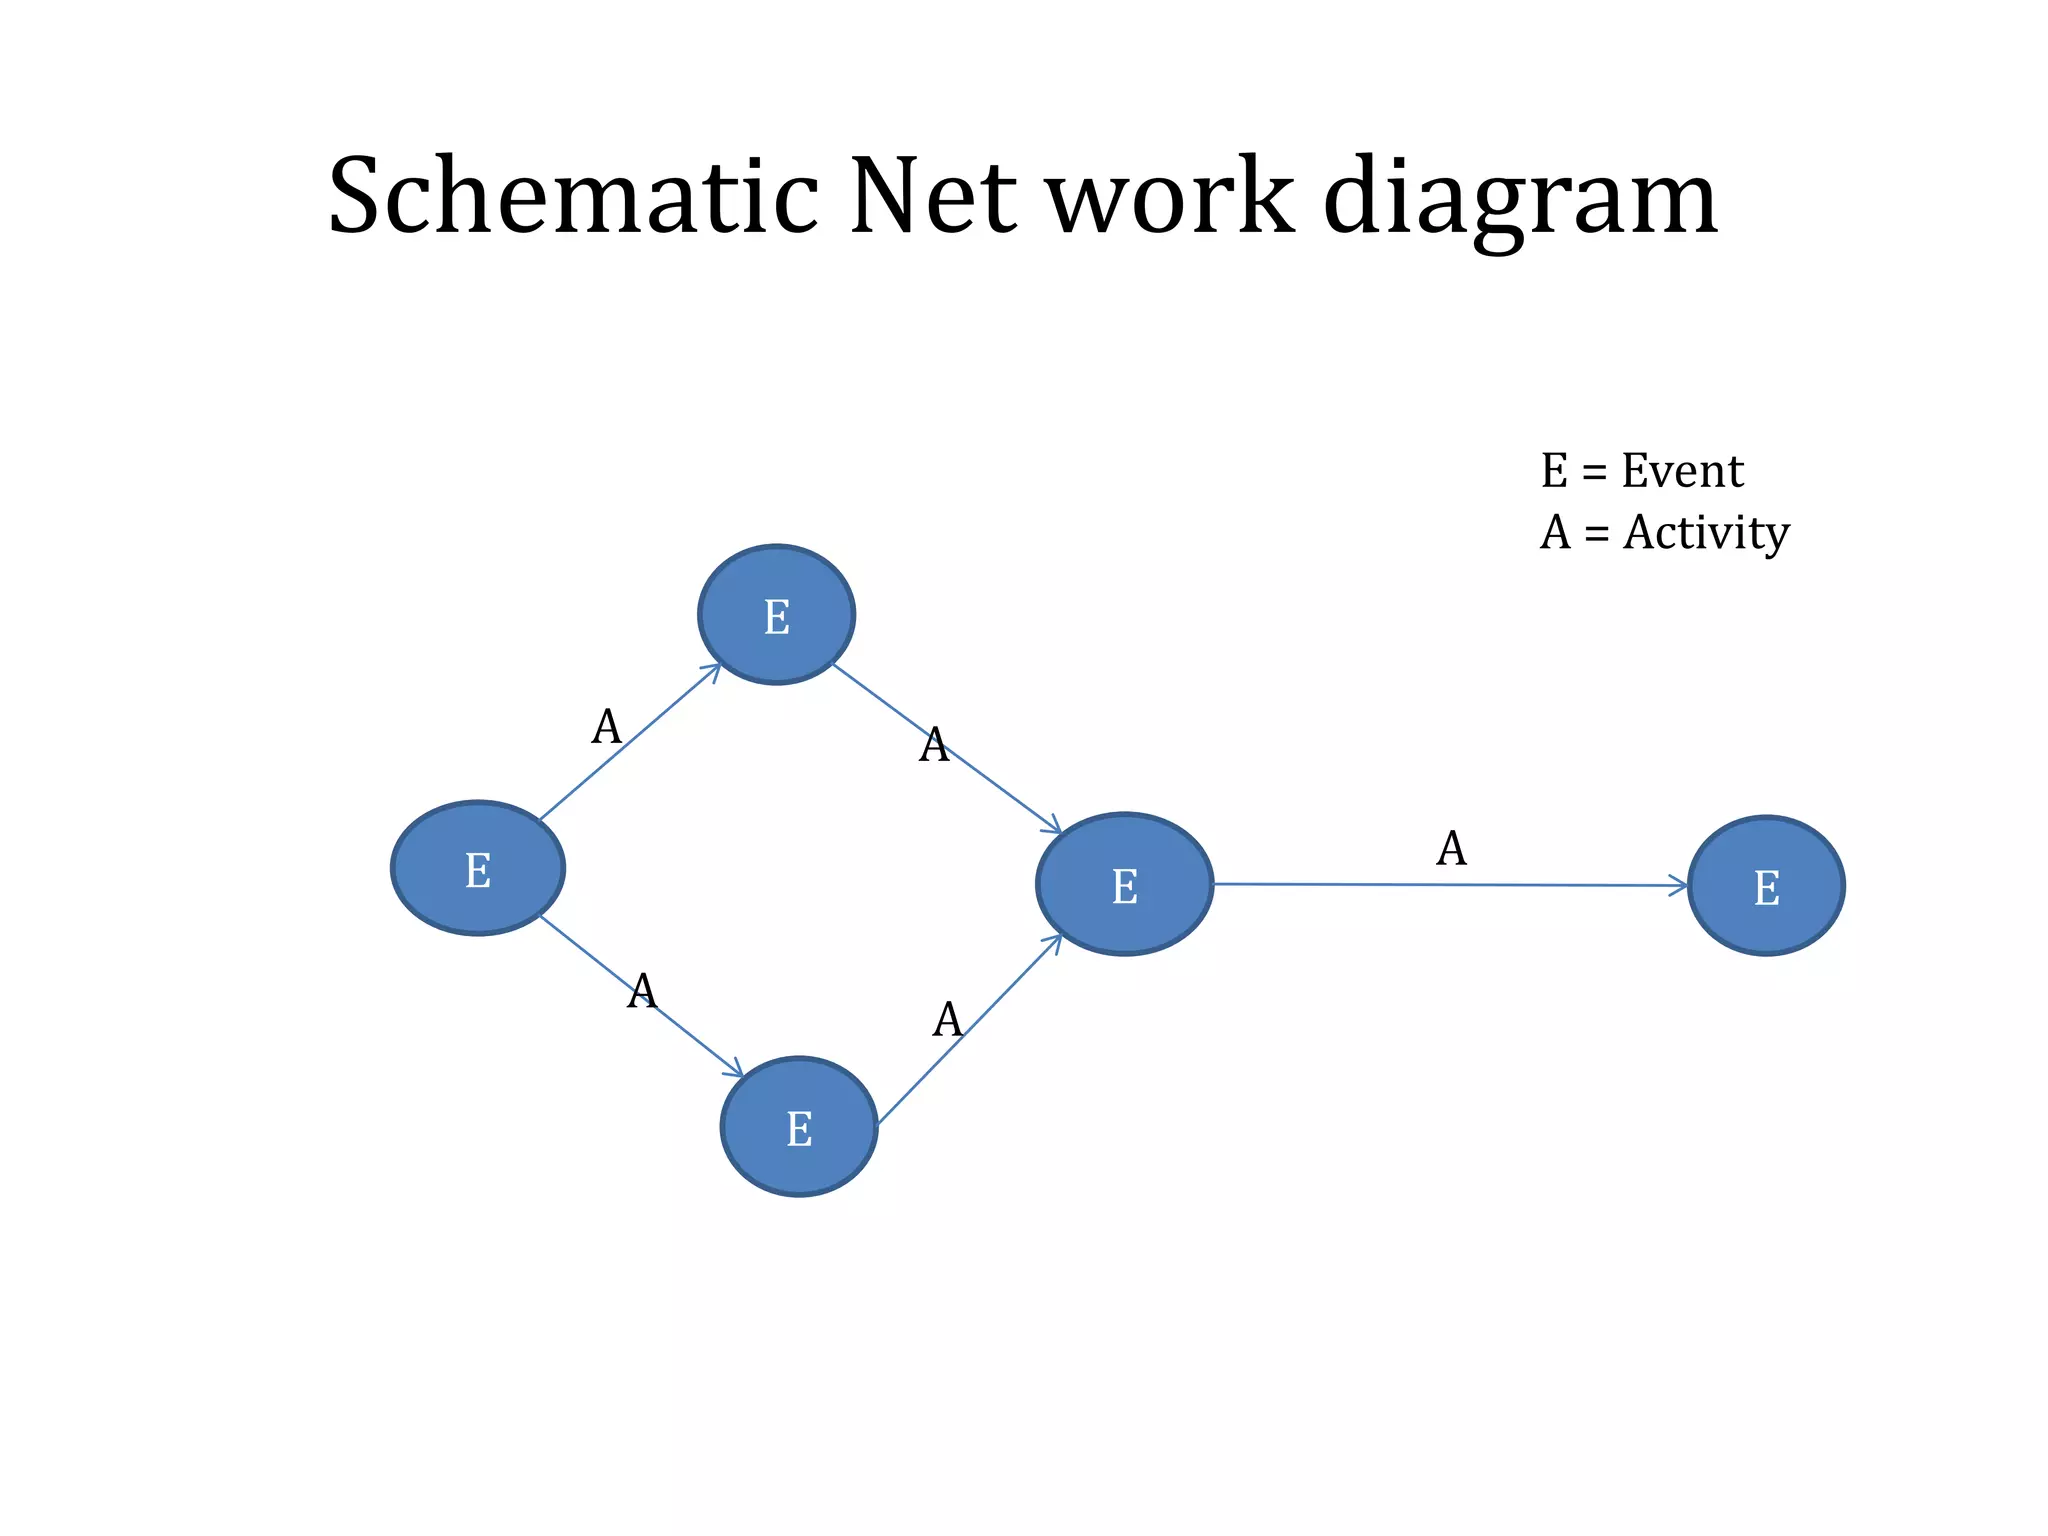
Short comings of Bar Chart
and Remedial Measures
• Lack of degree of details
• Review of the Project Progress
• Activity Inter relationships
• Time Uncertainties
Lack of Degree of Details
• On bar chart, only major activities are shown.
• If too may activities are shown, It becomes clumsy.
• Due to this, bar charts are not very useful for big projects
• A particular activity, weather big or small, if it is shown
in one bar, without any details of sub – activities
contained in it.
• If these activities are not separated out, due to this,
effective control over the activities cannot be achieved
• For effective completion of the activity, these sub-
activities are scheduled properly.
• The information about sub – activities are shown
effectively by making stages on activity bar (which is
called as mile stones)
Review of Project Progress
• A bar chart dose not show the progress of the work and
hence it cannot be used as a control device.
• For proper control of the project, information of the
progress made at a particular instant of time should me
available.
• (controlling is essential for re-scheduling the remaining
activities)
• Any way the existing bar chart can be modified to depict
the progress made.
• This can be made by showing the progress of each
activity, by hatched lines along the corresponding bar of
the activity.
• Generally hatching is done in half width of the bar
• Sometimes, different colors are filled in the bars to show
various control information
– Anticipated Progress : black
– Actual Progress : green
– Progress behind scheduled : red
Activity Inter – relationships
• Some activities in a project, which are taken up concurrently,
• And some activities starts only after completion of some other
activity.
• These activities can run parallel or overlap
• The start and end of these activities depend on other activities in a
project
• one cannot draw conclusion that, these activities and dependent or
independent of activities in project
• This difficulty can be partly over come by breaking each activities in
to a number of sections
• So that, the corresponding sections of various activities are
preciously depicted inter dependency.
Time Uncertainties
• Bar charts are not useful in those projects
where there are uncertainties in
determination or estimation of time
required for the completion of various
activities
• These uncertainties are common in research
and development projects.
Mile Stone Chart
• Mile stone chart is the modification of bar chart or gantt chart
• The mile stones are the key events of main activity represented
by a bar
• These are the specific points in time which mark the completion
of certain portions of the main activity.
• These points are those which can be easily identified over the
main bar.
• These activities are easily identified on the activity of main bar
• The beginning and end of the each activity or task as mile stone.
• Through this the controlling can be achieved
• This chart is therefore called as a mile stone chart.
ELEMENTS OF NETWORK
• The network technique is one of the most modern tools of
project management
• It is always possible to develop the entire project into a
under of well distinct, well defined jobs or tasks (called
activities)
• The beginning or end of each such activity constitutes an
event of the project
• the network is a flow diagram consisting of activities and
events connected logically and sequentially in the network
diagram, an activity is represented by arrow while events
are represented by circles.
Schematic Net work diagram
E
E
E
E E
A A
A
A
A
E = Event
A = Activity
• These PERT and CPM is technique of project management
involving graphical and diagrammatic representation,
which management can use as an aid in planning,
scheduling and controlling of operations in a project.
Characteristics of CPM/PERT:
A project to be analyses by CPM or PERT technique should
have the following characteristics
1. The project to be planned by network technique should
consist of clearly recognizable jobs or operations, usually
called activities
2. These jobs, operations or activities must have definite
commencements and completion. The start or end of the
job or operation or activity is called an event
3. The events must occur in a definite pattern and must be
performed in a technological sequence
1. Thus, the basic elements of a project network are:
1. Event
2. Activity
Terms used in Network Planning
Methods
• Activity: Every Project consist of a number of job operations or
tasks which are called activities
– These Activities may be classified as critical activity, non –
critical activity and dummy activity
– The activity called critical if it is earliest start time (EST) plus
the time taken by it, is equal to least finishing time (LFT)
– For non critical activity having a provision so that, even if
they consume a specified time over and above the estimated
time, the project will not be delayed.
– When two activities start at the same instant of time, the
head events are joined by dotted arrow and this is known as
dummy activity.
Representation of Events
• In a network diagram, events are represented by
nods.
– The shape of the node may be
Specifying The Events
• Tail Event
• Head Event
• Dual role Event
Tail Events
• A tail events is the one which marks the beginning of an
activity
• If a particular event represents the commencement of the
project, it is the initial event
Head Events
All activities end specific point of time and it is marked by an
event
Such an event is known as head event
This is because, in a network diagram, it is connected to head
of an arrow
Dual role Events
• Most of the events sere dual role
• i.e. they are head events to some activity and
Tail events to other activity
• all events: Expect initial and final events
» All other events are dual role events
Example
1 is (i) Initial event
(II) Tail event for activity A & B
2 is (i) Head event for activity A
(II) Tail event for activity D
3 is (i) Head activity for activity B
(II) Tail Event for activity C & E
4 is (i) Head event for activity c
(ii) Tail event for activity F
5 is (i) Head Event for activities D, E, F
(Final or end Event)
Inter- Relationship Between Events
To complete the project effectively
The entire project which has been split into a
number of activities and passes through number of
events
These events must occur at definite time and in a
particular sequence or order.
While preparing network diagram
One can think about the following questions
regarding the sequence of events
1. What events will complete before a particular
event
2. What event or event must follow particular event
3. What activities can be accomplished
simultaneously
The order or sequence relates various events as
1. Successor events
2. Predecessor events
Successor event:
1. Event or event that follow another event are
called successor event to that event
2. Event or events that immediately follow another
without any intervening are called immediate
successor event.
• Predecessor events
– The events that occurs before another event are
called predecessor event to that event
– Event or events that immediately come before
another event without any intervening once
called immediate predecessor events.
• Events 2,3,4 and 5 are successor events to event 1
• Events 2,3,4 are immediate successor events to event 1
• Event 5 is the immediate successor events to events 2,3
and 4
• Events 1,2,3,4 are predecessor events to event 5
• Events 2,3,4 are immediate predecessor events to event 5
Slack or Float: = EFT - LST
When its of an activity + then it represents a situation where
extra resources are available and completion of project is not
delayed.
When its of an activity - then it represents a situation where
additional resources needed to complete the project.
Types:
Total Float = LFT – EFT or LST-EST
Free Float = EST(Its Successor Activity)- EFT
Interfering Float = TF-FF
Independent Float = Excess of minimum available time over the
required activity duration.

Short Comings of Bar Chart and Remidial Measures

  • 1.
    Short comings ofBar Chart and Remedial Measures
  • 2.
    • Lack ofdegree of details • Review of the Project Progress • Activity Inter relationships • Time Uncertainties
  • 3.
    Lack of Degreeof Details • On bar chart, only major activities are shown. • If too may activities are shown, It becomes clumsy. • Due to this, bar charts are not very useful for big projects • A particular activity, weather big or small, if it is shown in one bar, without any details of sub – activities contained in it. • If these activities are not separated out, due to this, effective control over the activities cannot be achieved • For effective completion of the activity, these sub- activities are scheduled properly. • The information about sub – activities are shown effectively by making stages on activity bar (which is called as mile stones)
  • 4.
    Review of ProjectProgress • A bar chart dose not show the progress of the work and hence it cannot be used as a control device. • For proper control of the project, information of the progress made at a particular instant of time should me available. • (controlling is essential for re-scheduling the remaining activities) • Any way the existing bar chart can be modified to depict the progress made. • This can be made by showing the progress of each activity, by hatched lines along the corresponding bar of the activity. • Generally hatching is done in half width of the bar
  • 5.
    • Sometimes, differentcolors are filled in the bars to show various control information – Anticipated Progress : black – Actual Progress : green – Progress behind scheduled : red
  • 6.
    Activity Inter –relationships • Some activities in a project, which are taken up concurrently, • And some activities starts only after completion of some other activity. • These activities can run parallel or overlap • The start and end of these activities depend on other activities in a project • one cannot draw conclusion that, these activities and dependent or independent of activities in project • This difficulty can be partly over come by breaking each activities in to a number of sections • So that, the corresponding sections of various activities are preciously depicted inter dependency.
  • 7.
    Time Uncertainties • Barcharts are not useful in those projects where there are uncertainties in determination or estimation of time required for the completion of various activities • These uncertainties are common in research and development projects.
  • 8.
    Mile Stone Chart •Mile stone chart is the modification of bar chart or gantt chart • The mile stones are the key events of main activity represented by a bar • These are the specific points in time which mark the completion of certain portions of the main activity. • These points are those which can be easily identified over the main bar. • These activities are easily identified on the activity of main bar • The beginning and end of the each activity or task as mile stone. • Through this the controlling can be achieved • This chart is therefore called as a mile stone chart.
  • 9.
    ELEMENTS OF NETWORK •The network technique is one of the most modern tools of project management • It is always possible to develop the entire project into a under of well distinct, well defined jobs or tasks (called activities) • The beginning or end of each such activity constitutes an event of the project • the network is a flow diagram consisting of activities and events connected logically and sequentially in the network diagram, an activity is represented by arrow while events are represented by circles.
  • 10.
    Schematic Net workdiagram E E E E E A A A A A E = Event A = Activity
  • 11.
    • These PERTand CPM is technique of project management involving graphical and diagrammatic representation, which management can use as an aid in planning, scheduling and controlling of operations in a project.
  • 12.
    Characteristics of CPM/PERT: Aproject to be analyses by CPM or PERT technique should have the following characteristics 1. The project to be planned by network technique should consist of clearly recognizable jobs or operations, usually called activities 2. These jobs, operations or activities must have definite commencements and completion. The start or end of the job or operation or activity is called an event 3. The events must occur in a definite pattern and must be performed in a technological sequence 1. Thus, the basic elements of a project network are: 1. Event 2. Activity
  • 13.
    Terms used inNetwork Planning Methods • Activity: Every Project consist of a number of job operations or tasks which are called activities – These Activities may be classified as critical activity, non – critical activity and dummy activity – The activity called critical if it is earliest start time (EST) plus the time taken by it, is equal to least finishing time (LFT) – For non critical activity having a provision so that, even if they consume a specified time over and above the estimated time, the project will not be delayed. – When two activities start at the same instant of time, the head events are joined by dotted arrow and this is known as dummy activity.
  • 14.
    Representation of Events •In a network diagram, events are represented by nods. – The shape of the node may be
  • 15.
    Specifying The Events •Tail Event • Head Event • Dual role Event
  • 16.
    Tail Events • Atail events is the one which marks the beginning of an activity • If a particular event represents the commencement of the project, it is the initial event Head Events All activities end specific point of time and it is marked by an event Such an event is known as head event This is because, in a network diagram, it is connected to head of an arrow
  • 17.
    Dual role Events •Most of the events sere dual role • i.e. they are head events to some activity and Tail events to other activity • all events: Expect initial and final events » All other events are dual role events
  • 18.
    Example 1 is (i)Initial event (II) Tail event for activity A & B 2 is (i) Head event for activity A (II) Tail event for activity D 3 is (i) Head activity for activity B (II) Tail Event for activity C & E 4 is (i) Head event for activity c (ii) Tail event for activity F 5 is (i) Head Event for activities D, E, F (Final or end Event)
  • 19.
    Inter- Relationship BetweenEvents To complete the project effectively The entire project which has been split into a number of activities and passes through number of events These events must occur at definite time and in a particular sequence or order.
  • 20.
    While preparing networkdiagram One can think about the following questions regarding the sequence of events 1. What events will complete before a particular event 2. What event or event must follow particular event 3. What activities can be accomplished simultaneously
  • 21.
    The order orsequence relates various events as 1. Successor events 2. Predecessor events Successor event: 1. Event or event that follow another event are called successor event to that event 2. Event or events that immediately follow another without any intervening are called immediate successor event.
  • 22.
    • Predecessor events –The events that occurs before another event are called predecessor event to that event – Event or events that immediately come before another event without any intervening once called immediate predecessor events.
  • 23.
    • Events 2,3,4and 5 are successor events to event 1 • Events 2,3,4 are immediate successor events to event 1 • Event 5 is the immediate successor events to events 2,3 and 4 • Events 1,2,3,4 are predecessor events to event 5 • Events 2,3,4 are immediate predecessor events to event 5
  • 24.
    Slack or Float:= EFT - LST When its of an activity + then it represents a situation where extra resources are available and completion of project is not delayed. When its of an activity - then it represents a situation where additional resources needed to complete the project. Types: Total Float = LFT – EFT or LST-EST Free Float = EST(Its Successor Activity)- EFT Interfering Float = TF-FF Independent Float = Excess of minimum available time over the required activity duration.