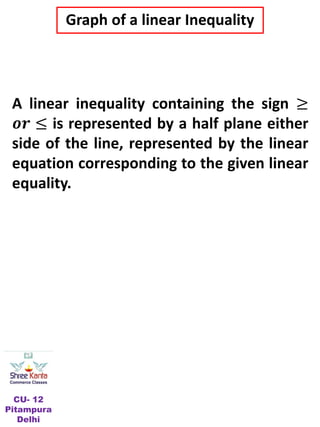
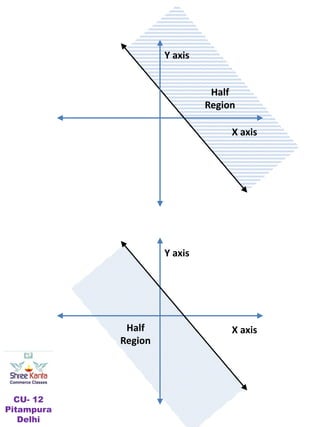
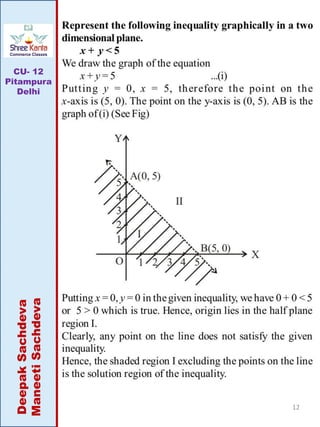
This document discusses linear inequalities. It defines an inequality as any statement involving the symbols >, <, ≤ or ≥. A linear inequality relates two linear polynomials with a sign of inequality. There are numerical inequalities that do not involve variables and literal inequalities that do involve variables. Linear inequalities can contain one or more variables. Inequalities with > or < are strict, while those with ≥ or ≤ are slack or non-strict. The solution set of a linear inequality in one variable can be represented on a number line using open or closed circles. A linear inequality containing ≥ or ≤ is represented geometrically by a half-plane on either side of the corresponding linear equation.

![3
Representation of Solution of Linear Inequality
in One Variable on a Number Line
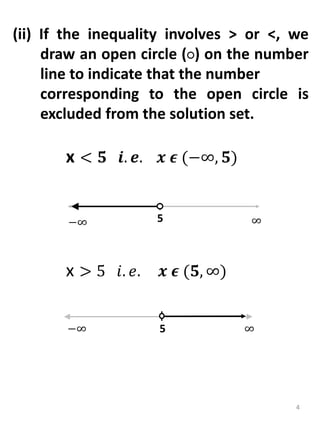
(i) If the inequality involves ≥ or ≤ , we
draw filled circle (•) on the number line
to indicate that the number
corresponding to the filled circle is
included in the solution set.
e.g. x ≤ 5 𝒊. 𝒆. 𝒙 𝝐 (−∞, 𝟓]
5 ∞
−∞
x ≥ 5 𝒊. 𝒆. 𝒙 𝝐 [𝟓, ∞)
5 ∞
−∞](https://image.slidesharecdn.com/linearinequations-210507204048/85/Linear-inequations-3-320.jpg)