Downloaded 1,922 times
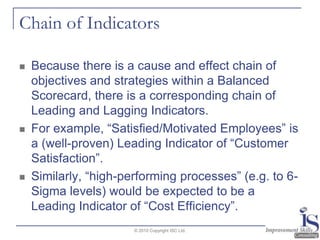
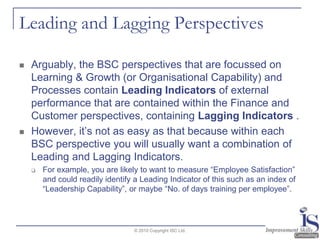


The document explains the distinction between leading and lagging indicators in performance management, emphasizing their complementary roles in achieving strategic goals. Leading indicators allow for proactive adjustments while lagging indicators confirm outcomes, with both types present in a balanced scorecard framework. It concludes that effective metrics should align with organizational objectives to track performance accurately.


![Intro to Key Performance Indicators [Infographic]](https://cdn.slidesharecdn.com/ss_thumbnails/kpi-infographic-160217090723-thumbnail.jpg?width=640&height=640&fit=bounds)


