Download to read offline


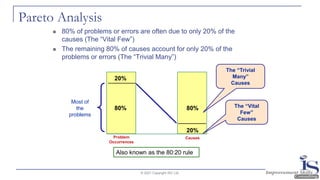
![Mean, Median and Mode
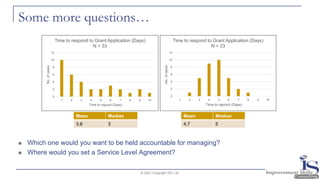
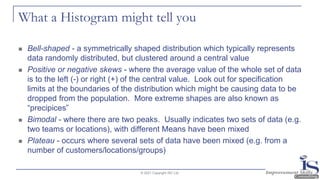
◼ Arithmetic Mean - the sum of values divided by the number of values, often called “the
average” (8.0 in our example)
◼ Median - the middle value when all the values are arranged in order [or the mean of the two
middle values if there is an even number in the list] (7.25 in our example)
◼ Mode - the most frequently occurring value (7 in our example)
If the Mean = the Median, the data is distributed symmetrically
The Median and Mode are not affected by extreme values in a set of data, unlike the Mean
© 2021 Copyright ISC Ltd.
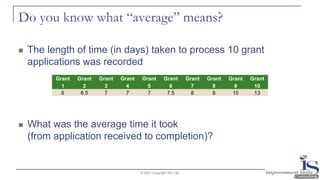
Grant
1
Grant
2
Grant
3
Grant
4
Grant
5
Grant
6
Grant
7
Grant
8
Grant
9
Grant
10
6 6.5 7 7 7 7.5 8 8 10 13](https://image.slidesharecdn.com/quantdataessentialsll2021v2-210311121017/85/Quantitative-data-essentials-for-charities-Learning-Lab-20-320.jpg)
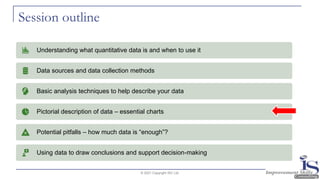

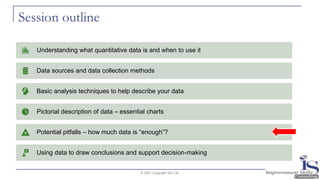

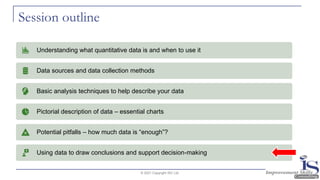


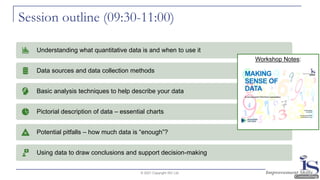
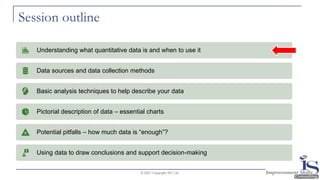
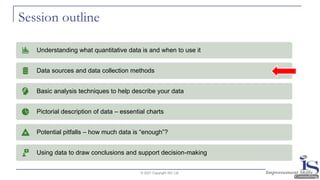
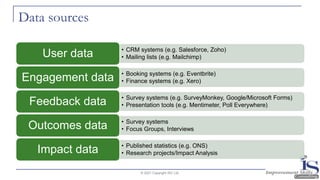
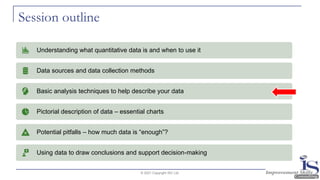
The document outlines a session on quantitative data essentials. It will cover understanding quantitative data and when to use it, data sources and collection methods, basic analysis techniques, essential charts for data description, potential pitfalls around data sufficiency, and using data to draw conclusions and support decision making. The session aims to help participants better utilize quantitative data through understanding these key concepts.