Downloaded 97 times
![Intro to Key Performance
Indicators [Infographic]](https://image.slidesharecdn.com/kpi-infographic-160217090723/75/Intro-to-Key-Performance-Indicators-Infographic-1-2048.jpg)

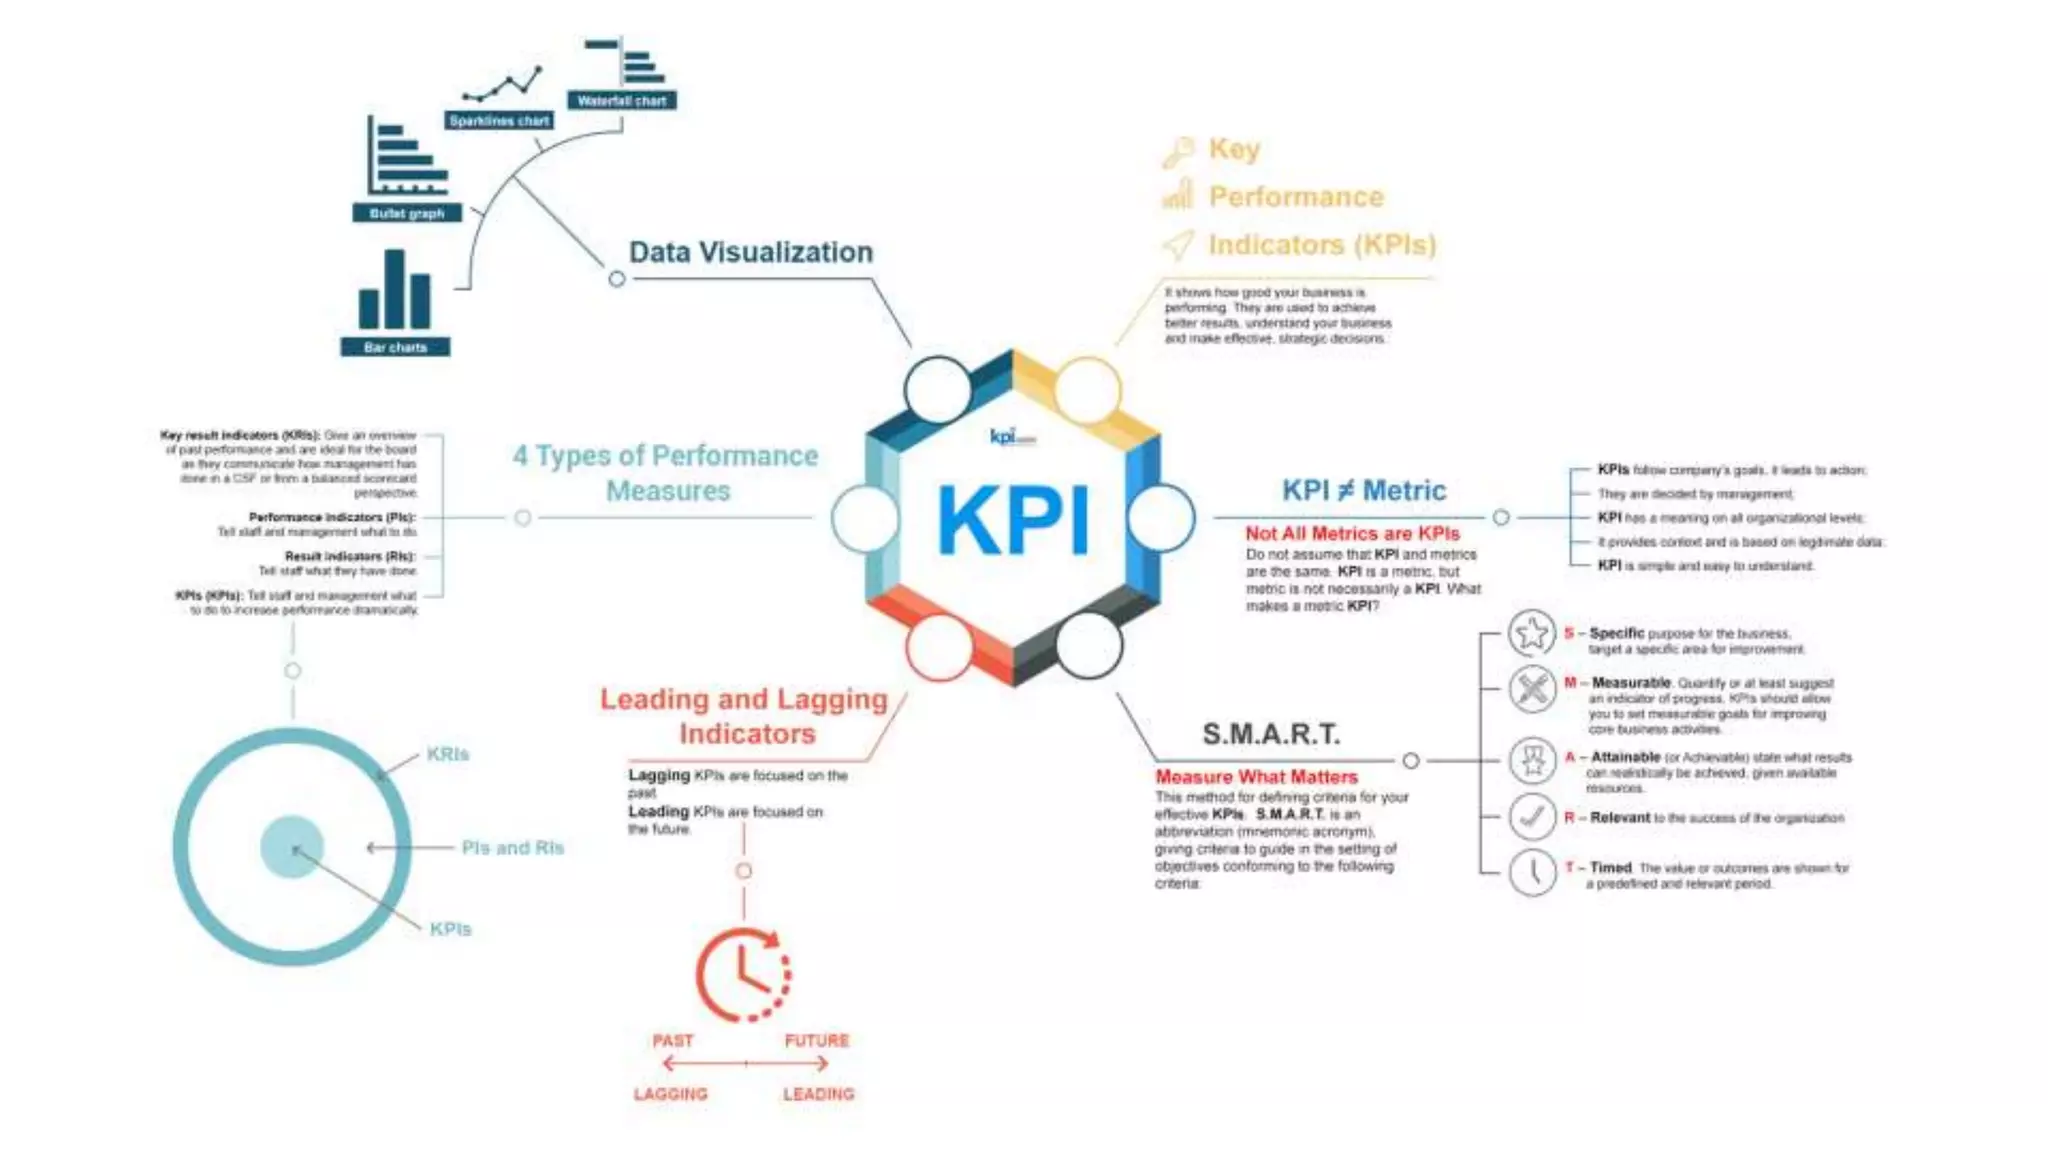

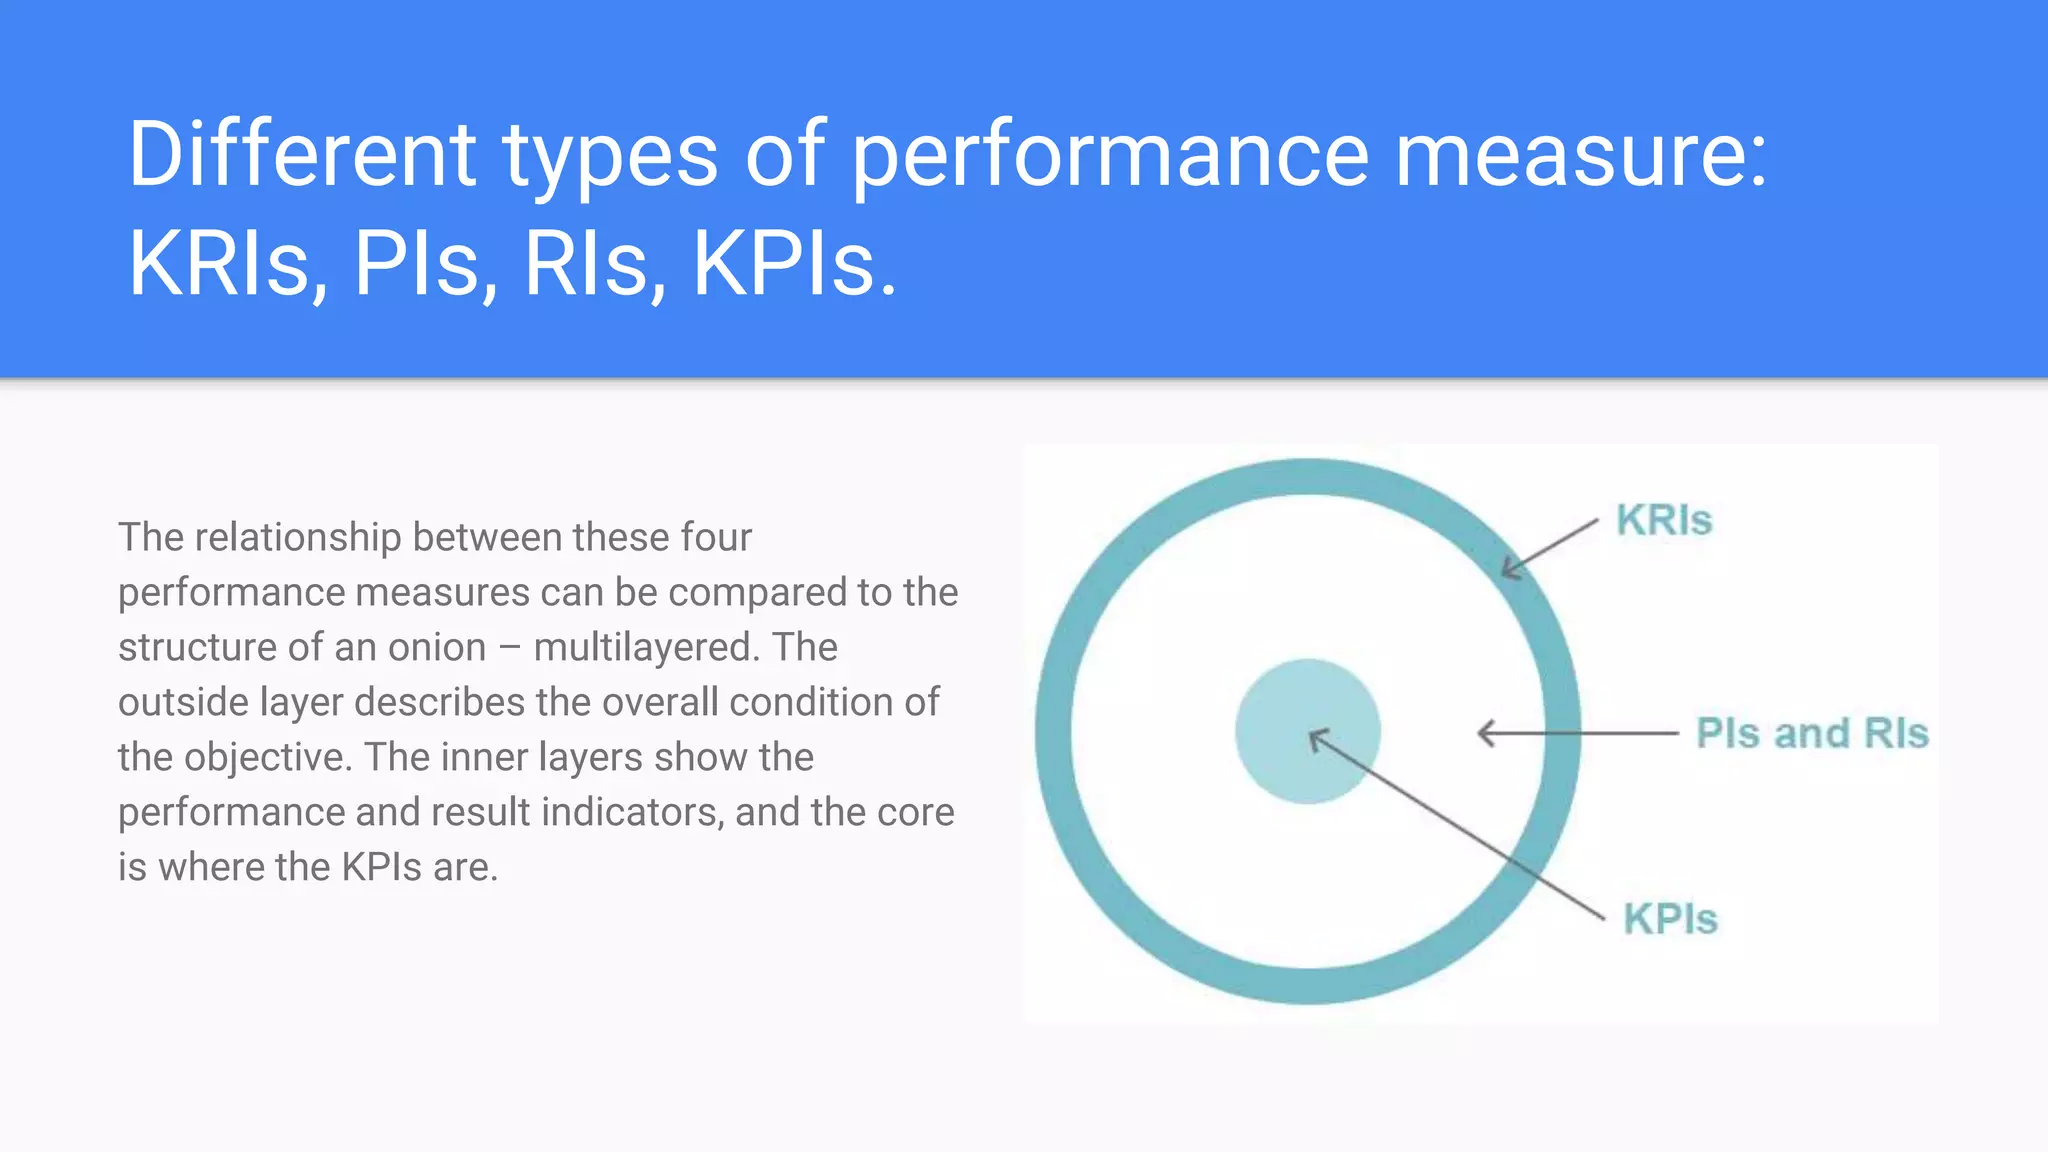
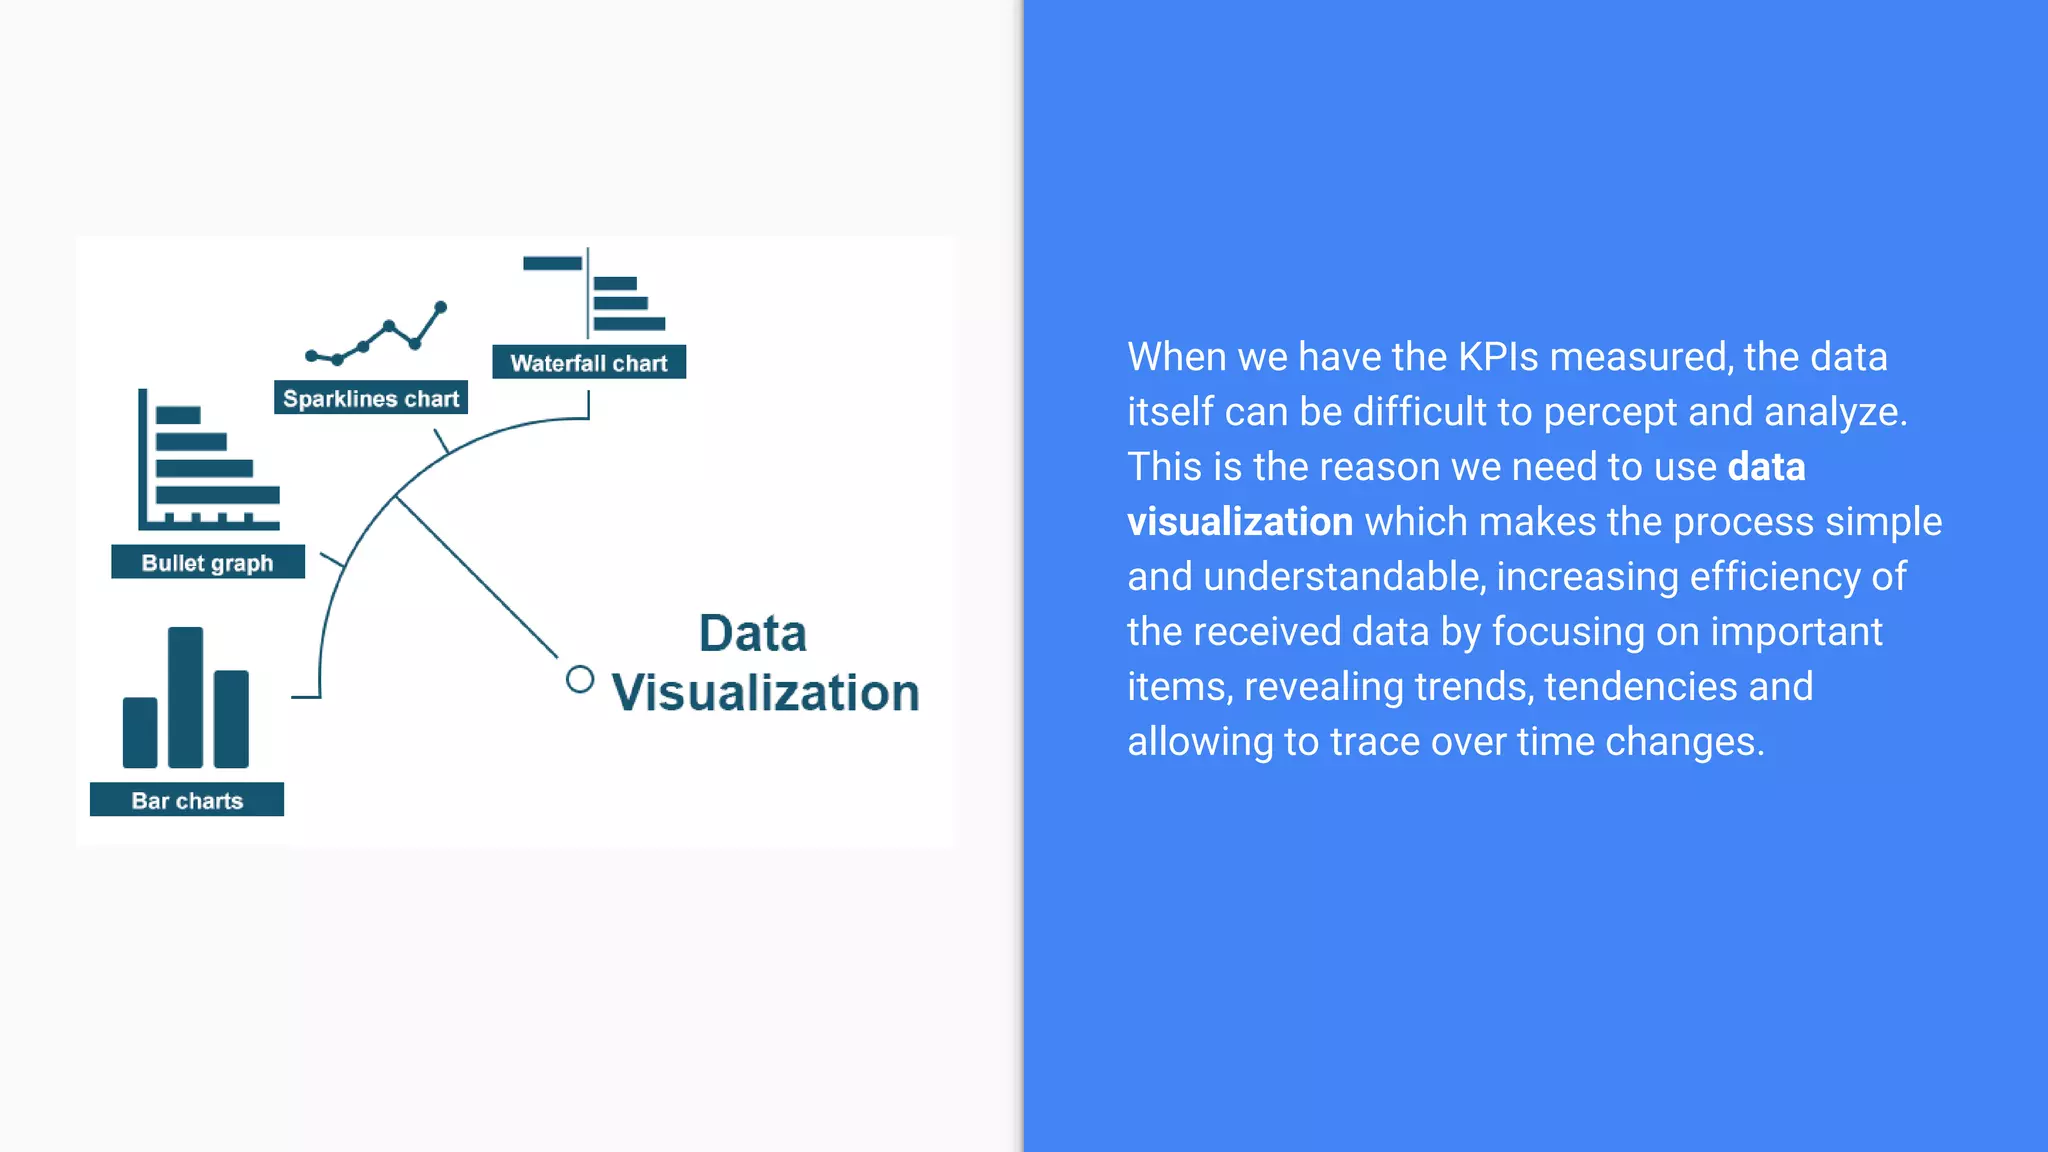

Key Performance Indicators (KPIs) are measurable values that assess how effectively a company meets its business objectives across various departments. They can be categorized into lagging KPIs, which describe past performance, and leading KPIs, which indicate future performance inputs. Determining relevant KPIs involves specific criteria to ensure they align with organizational goals, and data visualization is essential for analyzing and interpreting KPI data effectively.


