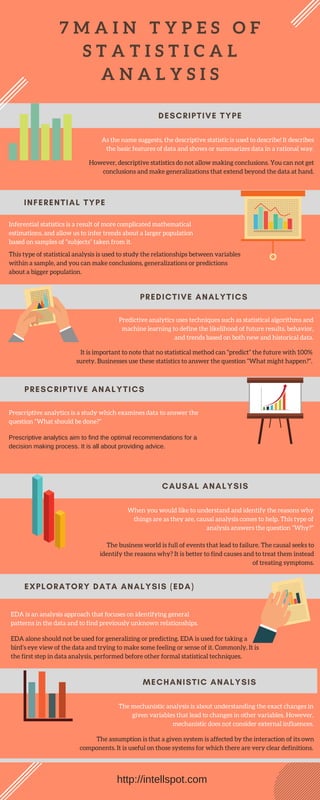
Distinguish between Parameter and Statistic.
Calculate sample variance and sample standard deviation.
Visit the website for more services: https://cristinamontenegro92.wixsite.com/onevs
What is path analysis?
What are general assumptions?
What is input path diagram?
What is output path diagram?
How unexplained variance is shown in path diagram?
Please Subscribe to this Channel for more solutions and lectures
http://www.youtube.com/onlineteaching
Chapter 4: Probability
4.3: Complements and Conditional Probability, and Bayes' Theorem
The IB Geography syllabus specifies several skills that should be mastered during the course. The skills are not assessed explicitly in external exams but they are assessed implicitly via data response questions and the expectations of quality essays. The internal assessment based on geographic fieldwork and geography extended essays are the main ways that students have opportunity to demonstrate their geographic skills.
In this presentation various fundamental data analysis using Statistical Tool SPSS was elaborated with special reference to physical education and sports
As we have learned in the previous lesson, Statistics is a science that studies data. Hence to teach Statistics, real data set is recommend to use. In this lesson, we present an activity where the students will be asked to provide some data that will be submitted for consolidation by the teacher for future lessons. Data on heights and weights, for instance, will be used for calculating Body Mass Index in the integrative lesson. Students will also be given the perspective that the data they provided is part of a bigger group of data as the same data will be asked from much larger groups (the entire class, all Grade 11 students in school, all Grade 11 students in the district). The contextualization of data will also be discussed.
📺Please Subscribe to this Channel for more solutions and lectures
http://www.youtube.com/onlineteaching
Chapter 7: Estimating Parameters and Determining Sample Sizes
7.1: Estimating a Population Proportion
FOUR TYPES OF BUSINESS ANALYTICS TO KNOWBUSINESS ANALYTICSby AJeanmarieColbert3
FOUR TYPES OF BUSINESS ANALYTICS TO KNOW
BUSINESS ANALYTICS
by Anushka Mehta October 13, 2017
For different stages of business analytics huge amount of data is processed at various steps. Depending on the stage of the workflow and the requirement of data analysis, there are four main kinds of analytics – descriptive, diagnostic, predictive and prescriptive. These four types together answer everything a company needs to know- from what’s going on in the company to what solutions to be adopted for optimizing the functions.
The four types of analytics are usually implemented in stages and no one type of analytics is said to be better than the other. They are interrelated and each of these offers a different insight. With data being important to so many diverse sectors- from manufacturing to energy grids, most of the companies rely on one or all of these types of analytics. With the right choice of analytical techniques, big data can deliver richer insights for the companies
Before diving deeper into each of these, let’s define the four types of analytics:
1) Descriptive Analytics:Describing or summarizing the existing data using existing business intelligence tools to better understand what is going on or what has happened.
2) Diagnostic Analytics: Focus on past performance to determine what happened and why. The result of the analysis is often an analytic dashboard.
3) Predictive Analytics:Emphasizes on predicting the possible outcome using statistical models and machine learning techniques.
4) Prescriptive Analytics:It is a type of predictive analytics that is used to recommend one or more course of action on analyzing the data.
Let’s understand these in a bit more depth.
1. Descriptive Analytics
This can be termed as the simplest form of analytics. The mighty size of big data is beyond human comprehension and the first stage hence involves crunching the data into understandable chunks. The purpose of this analytics type is just to summarize the findings and understand what is going on.
Among some frequently used terms, what people call as advanced analytics or business intelligence is basically usage of descriptive statistics (arithmetic operations, mean, median, max, percentage, etc.) on existing data. It is said that 80% of business analytics mainly involves descriptions based on aggregations of past performance. It is an important step to make raw data understandable to investors, shareholders and managers. This way it gets easy to identify and address the areas of strengths and weaknesses such that it can help in strategizing.
The two main techniques involved are data aggregation and data mining stating that this method is purely used for understanding the underlying behavior and not to make any estimations. By mining historical data, companies can analyze the consumer behaviors and engagements with their businesses that could be helpful in targeted marketing, service improvement, etc. The tools used in this phase are MS Excel, MATLAB ...
360DigiTMG delivers data science course in Hyderabad, where you can gain practical experience in key methods and tools through real-world projects. Study under skilled trainers and transform into a skilled Data Scientist. Enroll today!
data science course with placement in hyderabadmaneesha2312
360DigiTMG delivers data science course with placement in hyderabad, where you can gain practical experience in key methods and tools through real-world projects. Study under skilled trainers and transform into a skilled Data Scientist. Enroll today!
Pubrica's team of researchers and authors develop Scientific and medical research papers that can act as an indispensable tool to the practitioner/authors. Here is how we help.
Root Cause Analysis – A Practice to Understanding and Control the Failure Man...inventionjournals
International Journal of Business and Management Invention (IJBMI) is an international journal intended for professionals and researchers in all fields of Business and Management. IJBMI publishes research articles and reviews within the whole field Business and Management, new teaching methods, assessment, validation and the impact of new technologies and it will continue to provide information on the latest trends and developments in this ever-expanding subject. The publications of papers are selected through double peer reviewed to ensure originality, relevance, and readability. The articles published in our journal can be accessed online.
Unit III - Statistical Process Control (SPC)Dr.Raja R
The seven tools of quality – Statistical Fundamentals – Measures of central Tendency and Dispersion, Population and Sample, Normal Curve, Control Charts for variables Xbar and R chart and attributes P, nP, C, and u charts, Industrial Examples, Process capability, Concept of six sigma – New seven Management tools.
Data management best practices - infographicIntellspot
Best practices for data management including data governance, data stewardship, data integration, data quality, and enterprise master data management best practices and strategies.
Show drafts
volume_up
Empowering the Data Analytics Ecosystem: A Laser Focus on Value
The data analytics ecosystem thrives when every component functions at its peak, unlocking the true potential of data. Here's a laser focus on key areas for an empowered ecosystem:
1. Democratize Access, Not Data:
Granular Access Controls: Provide users with self-service tools tailored to their specific needs, preventing data overload and misuse.
Data Catalogs: Implement robust data catalogs for easy discovery and understanding of available data sources.
2. Foster Collaboration with Clear Roles:
Data Mesh Architecture: Break down data silos by creating a distributed data ownership model with clear ownership and responsibilities.
Collaborative Workspaces: Utilize interactive platforms where data scientists, analysts, and domain experts can work seamlessly together.
3. Leverage Advanced Analytics Strategically:
AI-powered Automation: Automate repetitive tasks like data cleaning and feature engineering, freeing up data talent for higher-level analysis.
Right-Tool Selection: Strategically choose the most effective advanced analytics techniques (e.g., AI, ML) based on specific business problems.
4. Prioritize Data Quality with Automation:
Automated Data Validation: Implement automated data quality checks to identify and rectify errors at the source, minimizing downstream issues.
Data Lineage Tracking: Track the flow of data throughout the ecosystem, ensuring transparency and facilitating root cause analysis for errors.
5. Cultivate a Data-Driven Mindset:
Metrics-Driven Performance Management: Align KPIs and performance metrics with data-driven insights to ensure actionable decision making.
Data Storytelling Workshops: Equip stakeholders with the skills to translate complex data findings into compelling narratives that drive action.
Benefits of a Precise Ecosystem:
Sharpened Focus: Precise access and clear roles ensure everyone works with the most relevant data, maximizing efficiency.
Actionable Insights: Strategic analytics and automated quality checks lead to more reliable and actionable data insights.
Continuous Improvement: Data-driven performance management fosters a culture of learning and continuous improvement.
Sustainable Growth: Empowered by data, organizations can make informed decisions to drive sustainable growth and innovation.
By focusing on these precise actions, organizations can create an empowered data analytics ecosystem that delivers real value by driving data-driven decisions and maximizing the return on their data investment.
Levelwise PageRank with Loop-Based Dead End Handling Strategy : SHORT REPORT ...Subhajit Sahu
Abstract — Levelwise PageRank is an alternative method of PageRank computation which decomposes the input graph into a directed acyclic block-graph of strongly connected components, and processes them in topological order, one level at a time. This enables calculation for ranks in a distributed fashion without per-iteration communication, unlike the standard method where all vertices are processed in each iteration. It however comes with a precondition of the absence of dead ends in the input graph. Here, the native non-distributed performance of Levelwise PageRank was compared against Monolithic PageRank on a CPU as well as a GPU. To ensure a fair comparison, Monolithic PageRank was also performed on a graph where vertices were split by components. Results indicate that Levelwise PageRank is about as fast as Monolithic PageRank on the CPU, but quite a bit slower on the GPU. Slowdown on the GPU is likely caused by a large submission of small workloads, and expected to be non-issue when the computation is performed on massive graphs.
Opendatabay - Open Data Marketplace.pptxOpendatabay
Opendatabay.com unlocks the power of data for everyone. Open Data Marketplace fosters a collaborative hub for data enthusiasts to explore, share, and contribute to a vast collection of datasets.
First ever open hub for data enthusiasts to collaborate and innovate. A platform to explore, share, and contribute to a vast collection of datasets. Through robust quality control and innovative technologies like blockchain verification, opendatabay ensures the authenticity and reliability of datasets, empowering users to make data-driven decisions with confidence. Leverage cutting-edge AI technologies to enhance the data exploration, analysis, and discovery experience.
From intelligent search and recommendations to automated data productisation and quotation, Opendatabay AI-driven features streamline the data workflow. Finding the data you need shouldn't be a complex. Opendatabay simplifies the data acquisition process with an intuitive interface and robust search tools. Effortlessly explore, discover, and access the data you need, allowing you to focus on extracting valuable insights. Opendatabay breaks new ground with a dedicated, AI-generated, synthetic datasets.
Leverage these privacy-preserving datasets for training and testing AI models without compromising sensitive information. Opendatabay prioritizes transparency by providing detailed metadata, provenance information, and usage guidelines for each dataset, ensuring users have a comprehensive understanding of the data they're working with. By leveraging a powerful combination of distributed ledger technology and rigorous third-party audits Opendatabay ensures the authenticity and reliability of every dataset. Security is at the core of Opendatabay. Marketplace implements stringent security measures, including encryption, access controls, and regular vulnerability assessments, to safeguard your data and protect your privacy.
Explore our comprehensive data analysis project presentation on predicting product ad campaign performance. Learn how data-driven insights can optimize your marketing strategies and enhance campaign effectiveness. Perfect for professionals and students looking to understand the power of data analysis in advertising. for more details visit: https://bostoninstituteofanalytics.org/data-science-and-artificial-intelligence/
Adjusting primitives for graph : SHORT REPORT / NOTESSubhajit Sahu
Graph algorithms, like PageRank Compressed Sparse Row (CSR) is an adjacency-list based graph representation that is
Multiply with different modes (map)
1. Performance of sequential execution based vs OpenMP based vector multiply.
2. Comparing various launch configs for CUDA based vector multiply.
Sum with different storage types (reduce)
1. Performance of vector element sum using float vs bfloat16 as the storage type.
Sum with different modes (reduce)
1. Performance of sequential execution based vs OpenMP based vector element sum.
2. Performance of memcpy vs in-place based CUDA based vector element sum.
3. Comparing various launch configs for CUDA based vector element sum (memcpy).
4. Comparing various launch configs for CUDA based vector element sum (in-place).
Sum with in-place strategies of CUDA mode (reduce)
1. Comparing various launch configs for CUDA based vector element sum (in-place).
1. 7 M A I N T Y P E S O F
S T A T I S T I C A L
A N A L Y S I S
DESCRIPTIVE TYPE
INFERENTIAL TYPE
PREDICTIVE ANALYTICS
CAUSAL ANALYSIS
EXPLORATORY DATA ANALYSIS (EDA)
MECHANISTIC ANALYSIS
As the name suggests, the descriptive statistic is used to describe! It describes
the basic features of data and shows or summarizes data in a rational way.
However, descriptive statistics do not allow making conclusions. You can not get
conclusions and make generalizations that extend beyond the data at hand.
Inferential statistics is a result of more complicated mathematical
estimations, and allow us to infer trends about a larger population
based on samples of “subjects” taken from it.
This type of statistical analysis is used to study the relationships between variables
within a sample, and you can make conclusions, generalizations or predictions
about a bigger population.
Predictive analytics uses techniques such as statistical algorithms and
machine learning to define the likelihood of future results, behavior,
and trends based on both new and historical data.
It is important to note that no statistical method can “predict” the future with 100%
surety. Businesses use these statistics to answer the question “What might happen?”.
Prescriptive analytics is a study which examines data to answer the
question “What should be done?”
Prescriptive analytics aim to find the optimal recommendations for a
decision making process. It is all about providing advice.
PRESCRIPTIVE ANALYTICS
When you would like to understand and identify the reasons why
things are as they are, causal analysis comes to help. This type of
analysis answers the question “Why?”
The business world is full of events that lead to failure. The causal seeks to
identify the reasons why? It is better to find causes and to treat them instead
of treating symptoms.
EDA is an analysis approach that focuses on identifying general
patterns in the data and to find previously unknown relationships.
EDA alone should not be used for generalizing or predicting. EDA is used for taking a
bird’s eye view of the data and trying to make some feeling or sense of it. Commonly, It is
the first step in data analysis, performed before other formal statistical techniques.
The mechanistic analysis is about understanding the exact changes in
given variables that lead to changes in other variables. However,
mechanistic does not consider external influences.
The assumption is that a given system is affected by the interaction of its own
components. It is useful on those systems for which there are very clear definitions.
http://intellspot.com