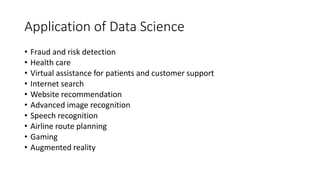
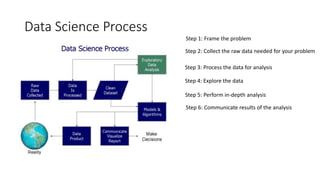
This document provides an introduction to data science concepts. It discusses the components of data science including statistics, visualization, data engineering, advanced computing, and machine learning. It also covers the advantages and disadvantages of data science, as well as common applications. Finally, it outlines the six phases of the data science process: framing the problem, collecting and processing data, exploring and analyzing data, communicating results, and measuring effectiveness.
Data Analysis Methods 101 - Turning Raw Data Into Actionable InsightsDataSpace Academy
Data analytics is powerful for organisations. It can help companies improve their overall efficiency and effectiveness. The blog offers a step-by-step narration of the data analysis methods that will help you to comprehend the fundamentals of an analytics project.
Data Analyst Interview Questions & AnswersSatyam Jaiswal
Practice Best Data Analyst Interview Questions for the best preparation of the data analyst interview. these interview questions are very popular and asked various times in data analyst interview.
Data analysis is identifying trends, patterns, and correlations in vast amounts of raw data to make data-informed decisions. These procedures employ well-known statistical analysis approaches, such as clustering and regression, and apply them to larger datasets with the assistance of modern tools.
What is data mining? The process of analyzing data to discover hidden patterns and relationships that can help you manage and improve your business.
Check out: www.eleaderstochange.com
Follow #eleaders2change
📊 Dive into the world of #DataAnalytics to unlock the secrets of information! 🚀 Understanding the basics is your gateway to data-driven success. 🌐 Explore foundational concepts, from data collection to interpretation, demystifying the data landscape. 📈 Master key techniques, empowering you to extract valuable insights and make informed decisions. 💡 Enhance your analytical skills and stay ahead in the fast-paced digital era. 🧠 Whether you're a beginner or looking for a refresher, this journey into data understanding is your stepping stone to a data-savvy future!
Top 30 Data Analyst Interview Questions.pdfShaikSikindar1
Data Analytics has emerged has one of the central aspects of business operations. Consequently, the quest to grab professional positions within the Data Analytics domain has assumed unimaginable proportions. So if you too happen to be someone who is desirous of making through a Data Analyst .
This webinar discussed the purpose of data analytics and how it can be a light in the darkness for your organization to make better decisions for the future. The webinar covered the purpose of data analysis and its definition, the fundamental steps to take to perform data analysis to problem solve, and closed with next steps that attendees can take to further develop data analysis and business intelligence within their organizations.
During this webinar, attendees learned about the following:
- How data analytics functions to help your organization improve.
- The process for using data analytics to solve problems.
- Next steps to take to build data analysis within your organization.
Honest Reviews of Tim Han LMA Course Program.pptxtimhan337
Personal development courses are widely available today, with each one promising life-changing outcomes. Tim Han’s Life Mastery Achievers (LMA) Course has drawn a lot of interest. In addition to offering my frank assessment of Success Insider’s LMA Course, this piece examines the course’s effects via a variety of Tim Han LMA course reviews and Success Insider comments.
Palestine last event orientationfvgnh .pptxRaedMohamed3
An EFL lesson about the current events in Palestine. It is intended to be for intermediate students who wish to increase their listening skills through a short lesson in power point.
Operation “Blue Star” is the only event in the history of Independent India where the state went into war with its own people. Even after about 40 years it is not clear if it was culmination of states anger over people of the region, a political game of power or start of dictatorial chapter in the democratic setup.
The people of Punjab felt alienated from main stream due to denial of their just demands during a long democratic struggle since independence. As it happen all over the word, it led to militant struggle with great loss of lives of military, police and civilian personnel. Killing of Indira Gandhi and massacre of innocent Sikhs in Delhi and other India cities was also associated with this movement.
Model Attribute Check Company Auto PropertyCeline George
In Odoo, the multi-company feature allows you to manage multiple companies within a single Odoo database instance. Each company can have its own configurations while still sharing common resources such as products, customers, and suppliers.
How to Make a Field invisible in Odoo 17Celine George
It is possible to hide or invisible some fields in odoo. Commonly using “invisible” attribute in the field definition to invisible the fields. This slide will show how to make a field invisible in odoo 17.
The Roman Empire A Historical Colossus.pdfkaushalkr1407
The Roman Empire, a vast and enduring power, stands as one of history's most remarkable civilizations, leaving an indelible imprint on the world. It emerged from the Roman Republic, transitioning into an imperial powerhouse under the leadership of Augustus Caesar in 27 BCE. This transformation marked the beginning of an era defined by unprecedented territorial expansion, architectural marvels, and profound cultural influence.
The empire's roots lie in the city of Rome, founded, according to legend, by Romulus in 753 BCE. Over centuries, Rome evolved from a small settlement to a formidable republic, characterized by a complex political system with elected officials and checks on power. However, internal strife, class conflicts, and military ambitions paved the way for the end of the Republic. Julius Caesar’s dictatorship and subsequent assassination in 44 BCE created a power vacuum, leading to a civil war. Octavian, later Augustus, emerged victorious, heralding the Roman Empire’s birth.
Under Augustus, the empire experienced the Pax Romana, a 200-year period of relative peace and stability. Augustus reformed the military, established efficient administrative systems, and initiated grand construction projects. The empire's borders expanded, encompassing territories from Britain to Egypt and from Spain to the Euphrates. Roman legions, renowned for their discipline and engineering prowess, secured and maintained these vast territories, building roads, fortifications, and cities that facilitated control and integration.
The Roman Empire’s society was hierarchical, with a rigid class system. At the top were the patricians, wealthy elites who held significant political power. Below them were the plebeians, free citizens with limited political influence, and the vast numbers of slaves who formed the backbone of the economy. The family unit was central, governed by the paterfamilias, the male head who held absolute authority.
Culturally, the Romans were eclectic, absorbing and adapting elements from the civilizations they encountered, particularly the Greeks. Roman art, literature, and philosophy reflected this synthesis, creating a rich cultural tapestry. Latin, the Roman language, became the lingua franca of the Western world, influencing numerous modern languages.
Roman architecture and engineering achievements were monumental. They perfected the arch, vault, and dome, constructing enduring structures like the Colosseum, Pantheon, and aqueducts. These engineering marvels not only showcased Roman ingenuity but also served practical purposes, from public entertainment to water supply.
Synthetic Fiber Construction in lab .pptxPavel ( NSTU)
Synthetic fiber production is a fascinating and complex field that blends chemistry, engineering, and environmental science. By understanding these aspects, students can gain a comprehensive view of synthetic fiber production, its impact on society and the environment, and the potential for future innovations. Synthetic fibers play a crucial role in modern society, impacting various aspects of daily life, industry, and the environment. ynthetic fibers are integral to modern life, offering a range of benefits from cost-effectiveness and versatility to innovative applications and performance characteristics. While they pose environmental challenges, ongoing research and development aim to create more sustainable and eco-friendly alternatives. Understanding the importance of synthetic fibers helps in appreciating their role in the economy, industry, and daily life, while also emphasizing the need for sustainable practices and innovation.
Acetabularia Information For Class 9 .docxvaibhavrinwa19
Acetabularia acetabulum is a single-celled green alga that in its vegetative state is morphologically differentiated into a basal rhizoid and an axially elongated stalk, which bears whorls of branching hairs. The single diploid nucleus resides in the rhizoid.
Introduction to AI for Nonprofits with Tapp NetworkTechSoup
Dive into the world of AI! Experts Jon Hill and Tareq Monaur will guide you through AI's role in enhancing nonprofit websites and basic marketing strategies, making it easy to understand and apply.
Read| The latest issue of The Challenger is here! We are thrilled to announce that our school paper has qualified for the NATIONAL SCHOOLS PRESS CONFERENCE (NSPC) 2024. Thank you for your unwavering support and trust. Dive into the stories that made us stand out!
1. UNIT 2 INTRODUCTION TO DATA SCIENCE
Introduction
• Data science deals with the concept of extracting useful knowledge
from huge data to solve business problems by following a process
• Data science includes data analysis as an important component
2. Components of data Science
• Statistics: Used to collect and analyze the numerical data in large
amount to find meaningful insights.
• Visualization: Representing data in visual context to understand the
data.
• Data Engineering: This includes acquiring, storing, retrieving and
transforming data.
• Advanced computing: This includes designing, writing, debugging and
maintaining the source code of computers.
• Machine learning: Providing training to the machines.
3. Advantages of Data Science
• Faster and better decision making
• Improves marketing and sales
• Selection of CV’s . Recruitment process easier.
• Reaching customers
4. Disadvantage of Data Science
• Information can be misused.
• Tools used for data science and analysis are expensive.
• Tools are complex to understand
5. Application of Data Science
• Fraud and risk detection
• Health care
• Virtual assistance for patients and customer support
• Internet search
• Website recommendation
• Advanced image recognition
• Speech recognition
• Airline route planning
• Gaming
• Augmented reality
6. Data Science Process
Step 1: Frame the problem
Step 2: Collect the raw data needed for your problem
Step 3: Process the data for analysis
Step 4: Explore the data
Step 5: Perform in-depth analysis
Step 6: Communicate results of the analysis
7. Basic of Data Analysis
• Data analytics is the science of examining raw data with the purpose
of drawing conclusions about that information.
• Data Analytics is a process of inspecting, cleansing, transforming and
modeling data with the goal of discovering useful information, and
supporting decision making.
8. What is Analytics
• Data: it is raw unorganized ,
• “data are a set of values of qualitative or quantitative variables about
one or more persons or objects, while a datum (singular of data) is a
single value of a single variable.”
• Information: when we analyze raw data it provides some sort of
understanding called information
9. • Data analytics is the science of analyzing raw data in order to make
conclusions about that information. Many of the techniques and
processes of data analytics have been automated into mechanical
processes and algorithms that work over raw data for human
consumption.
10. • The process involved in data analysis involves several different steps:
• The first step is to determine the data requirements or how the data is grouped. Data
may be separated by age, demographic, income, or gender. Data values may be
numerical or be divided by category.
• The second step in data analytics is the process of collecting it. This can be done
through a variety of sources such as computers, online sources, cameras, environmental
sources, or through personnel.
• Once the data is collected, it must be organized so it can be analyzed. Organization
may take place on a spreadsheet or other form of software that can take statistical data.
• The data is then cleaned up before analysis. This means it is scrubbed and checked to
ensure there is no duplication or error, and that it is not incomplete. This step helps
correct any errors before it goes on to a data analyst to be analyzed.
11. Phase 1: Data Discovery and Formation
Phase 2: Data Preparation and Processing
Phase 3: Design a Model
Phase 4: Model Building
Phase 5: Result Communication and Publication
Phase 6: Measuring of Effectiveness
12. Phase 1: Data Discovery and Formation
• Everything begins with a defined goal. In this phase, you’ll define your
data’s purpose and how to achieve it by the time you reach the end of
the data analytics lifecycle.
• Essential activities in this phase include structuring the business
problem in the form of an analytics challenge and formulating the
initial hypotheses (IHs) to test and start learning the data. The
subsequent phases are then based on achieving the goal that is
drawn in this stage.
13. Phase 2: Data Preparation and Processing
• This stage consists of everything that has anything to do with data. In
phase 2, the attention of experts moves from business requirements
to information requirements.
• The data preparation and processing step involve collecting,
processing, and cleansing the accumulated data.
Data is collected using the below methods:
• Data Acquisition: Accumulating information from external sources.
• Data Entry: Formulating recent data points using digital systems or
manual data entry techniques within the enterprise.
• Signal Reception: Capturing information from digital devices, such as
control systems and the Internet of Things.
14. Phase 3: Design a Model
• After mapping out your business goals and collecting a glut of data (structured,
unstructured, or semi-structured), it is time to build a model that utilizes the data
to achieve the goal.
• There are several techniques available to load data into the system and start
studying it:
• ETL (Extract, Transform, and Load) transforms the data first using a set of
business rules, before loading it into a sandbox.
• ELT (Extract, Load, and Transform) first loads raw data into the sandbox and
then transform it.
• ETLT (Extract, Transform, Load, Transform) is a mixture; it has two
transformation levels.
15. Phase 4: Model Building
• This step of data analytics architecture comprises developing data
sets for testing, training, and production purposes. The data analytics
experts meticulously build and operate the model that they had
designed in the previous step.
• They rely on tools and several techniques like decision trees,
regression techniques and neural networks for building and executing
the model. The experts also perform a trial run of the model to
observe if the model corresponds to the datasets.
16. Phase 5: Result Communication and Publication
• Now is the time to check if those criteria are met by the tests you
have run in the previous phase.
• The communication step starts with a collaboration with major
stakeholders to determine if the project results are a success or
failure. The project team is required to identify the key findings of the
analysis, measure the business value associated with the result, and
produce a narrative to summarise and convey the results to the
stakeholders.
17. Phase 6: Measuring of Effectiveness
• The final step is to provide a detailed report with key findings, coding,
briefings, technical papers/ documents to the stakeholders.
• Additionally, to measure the analysis’s effectiveness, the data is
moved to a live environment from the sandbox and monitored to
observe if the results match the expected business goal. If the
findings are as per the objective, the reports and the results are
finalized. However, suppose the outcome deviates from the intent set
out in phase 1then. You can move backward in the data analytics
lifecycle to any of the previous phases to change your input and get a
different output.
19. Descriptive analytics
• What happened?
• What is happening?
• Descriptive analytics answers the question of what happened.
• Descriptive analytics juggles raw data from multiple data sources to
give valuable insights into the past. However, these findings simply
signal that something is wrong or right, without explaining why. For
this reason, our data consultants don’t recommend highly data-driven
companies to settle for descriptive analytics only, they’d rather
combine it with other types of data analytics.
• An examples of this could be a monthly profit and loss statement
20. Diagnostic analytics
• At this stage, historical data can be measured against other data to
answer the question of why something happened.
• For example, if you’re conducting a social media marketing campaign,
you may be interested in assessing the number of likes, reviews,
mentions, followers or fans. Diagnostic analytics can help you distill
thousands of mentions into a single view so that you can make
progress with your campaign.
• Diagnostic analytics gives in-depth insights into a particular problem.
21. Predictive analytics
• Predictive analytics tells what is likely to happen
• Predictive analytics is the use of data, machine learning techniques,
and statistical algorithms to determine the likelihood of future results
based on historical data. The primary goal of predictive analytics is to
help you go beyond just what has happened and provide the best
possible assessment of what is likely to happen in future.
• Predictive analytics can be used in banking systems to detect fraud
cases, measure the levels of credit risks, and maximize the cross-sell
and up-sell opportunities in an organization. This helps to retain
valuable clients to your business.
22. Prescriptive analytics
• The purpose of prescriptive analytics is to literally prescribe what
action to take to eliminate a future problem or take full advantage of
a promising trend.
23. Statistical Inference
Statistical inference is the process of using data
analysis to deduce properties of an underlying
distribution of probability.
Inferential statistical analysis infers properties of a
population, for example by testing hypotheses
and deriving estimates. It is assumed that the
observed data set is sampled from a larger
population.
24. Statistical Estimation
• An estimator is a statistical parameter that provides an estimation of
a population parameter.
• The sample mean, is a point estimator for the population mean, .
• Example: The mean of the age of men attending a show is 32 years.
25. Statistical Hypothesis testing
• Hypothesis testing is an act in statistics whereby an analyst tests an
assumption regarding a population parameter. The methodology
employed by the analyst depends on the nature of the data used and
the reason for the analysis. Hypothesis testing is used to assess the
plausibility of a hypothesis by using sample data
26. Population and sample
• A population is the entire group that you want to draw conclusions
about.
• A sample is the specific group that you will collect data from. The size
of the sample is always less than the total size of the population.
• In research, a population doesn’t always refer to people. It can mean
a group containing elements of anything you want to study, such as
objects, events, organizations, countries, species, organisms, etc.
27. Reasons for sampling
Necessity: Sometimes it’s simply not possible to study the
whole population due to its size or inaccessibility.
Practicality: It’s easier and more efficient to collect data from
a sample.
Cost-effectiveness: There are fewer participant, laboratory,
equipment, and researcher costs involved.
Manageability: Storing and running statistical analyses on
smaller datasets is easier and reliable.
28. Statistical modeling
• Statistical modeling is the process of applying statistical analysis to a
dataset. A statistical model is a mathematical representation (or
mathematical model) of observed data.
• When data analysts apply various statistical models to the data they
are investigating, they are able to understand and interpret the
information more strategically.
• “When you analyze data, you are looking for patterns,”
29. steps of statistical model building process
Model Selection
• Based on the defined goal(s) (supervised or unsupervised) we have to select one of or combinations of
modeling techniques. Such as
• General linear model
• Non-Linear Regression
• Linear Regression
• Ridge Regression
• Non-Negative Garrotte Regression
• Percentage Regression
• Quantile Regression
• Non-parametric regression
• Logistic Regression
• Probit Regression
• Classification/Decision Trees
• Random Forest
30. • Support Vector Machine (SVM)
• Distance metric learning
• Bayesian methods
• Graphical Models
• Neural Networks
• Genetic Algorithm
• The Hazard and Survival Functions
• Time Series Models
• Signal Processing
• Clustering Techniques
• Market Basket Analysis
• Frequent Itemset Mining
• Association Rule Mining etc.
31. Build/Develop/Train Models/Model fitting
• Validate the assumptions of the chosen algorithm
• Check for Redundancies of Independent Variables (Features).
Sometime in Machine Learning, we are keen on accuracies of the
models and hence we may not perform these checks!
• Develop/Train Model on Training Sample, which is
80%/70%/60%/50% of the available data(Population)
• Check Model performance - Error, Accuracy
32. • Validate/Test Models
• Score and Predict using Test Sample
• Check for the robustness and stability of the model
• Check Model Performance: Accuracy, ROC, AUC, KS, GINI etc.
• AUC (Area Under The Curve)
• ROC (Receiver Operating Characteristics) curve
33. Probability
• Probability theory, a branch of mathematics concerned with the
analysis of random phenomena. The outcome of a random event
cannot be determined before it occurs, but it may be any one of
several possible outcomes. The actual outcome is considered to be
determined by chance.
• The set of all possible outcomes of an experiment is called a “sample
space.”
• The experiment of tossing a coin once results in a sample space with
two possible outcomes, “heads” and “tails.”
• Tossing two dice has a sample space with 36 possible outcomes
34. Probability and data science
• Randomness and uncertainty are imperative in the world and thus, it
can prove to be immensely helpful to understand and know the
chances of various events. Learning of probability helps you in
making informed decisions about likelihood of events, based on a
pattern of collected data.
• In the context of data science, statistical inferences are often used to
analyze or predict trends from data, and these inferences
use probability distributions of data. Thus, your efficacy of working
on data science problems depends on probability and its applications
to a good extent.
35. Probability distribution
• Probability distribution is a function that describes all the possible likelihoods and
values that can be taken by a random variable within a given range. For a
continuous random variable, the probability distribution is described by the
probability density function. And for a discrete random variable, it’s a probability
mass function that defines the probability distribution.
• Probability distributions are categorized into different classifications like binomial
distribution, chi-square distribution, normal distribution, Poisson distribution etc.
Different probability distributions represent different data generation process
and cater to different purposes. For instance, the binomial distribution evaluates
the probability of a particular event occurring many times over a given number of
trials as well as given the probability of the event in each trial. The normal
distribution is symmetric about the mean, demonstrating that the data closer to
the mean are more recurrent in occurrence compared to the data far from the
mean.
36. Discrete Probability distribution
• Binomial Distribution
A binomial distribution can be thought of as simply the probability of a SUCCESS or FAILURE
outcome in an experiment or survey that is repeated multiple times. The binomial is a type of
distribution that has two possible outcomes (the prefix “bi” means two, or twice). For example, a coin
toss has only two possible outcomes: heads or tails and taking a test could have two possible
outcomes: Pass or fail.
37. • Geometric Distribution
• The probability distribution of the number X of trials needed to get one
success, supported on the set { 1, 2, 3, ... }
• For example, suppose an ordinary die is thrown repeatedly until the
first time a "1" appears. The probability distribution of the number of
times it is thrown is supported on the infinite set { 1, 2, 3, ... } and is a
geometric distribution with p = 1/6.
38. • Poisson Distribution
• Is a discrete probability distribution that expresses the probability of a
given number of events occurring in a fixed interval of time or space if
these events occur with a known constant mean rate and
independently of the time since the last event. The Poisson
distribution can also be used for the number of events in other
specified intervals such as distance, area or volume.
• examples that may follow a Poisson distribution include the number
of phone calls received by a call center per hour and the number of
decay events per second from a radioactive source.
40. Uniform Distribution
• In statistics, uniform distribution is a term used to describe a form of
probability distribution where every possible outcome has an equal
likelihood of happening. The probability is constant since each
variable has equal chances of being the outcome.
41. Normal Distribution
• The normal distribution is the most important probability distribution
in statistics because it fits many natural phenomena.
• For example, heights, blood pressure IQ scores follow the normal
distribution. It is also known as the Gaussian distribution and the bell
curve.
42.
43. Correlation
• Correlation is Positive when the values increase together, and
• Correlation is Negative when one value decreases as the other
increases
46. Regression Analysis
• Statement of the problem under consideration
• Choice of relevant variables
• Collection of data on relevant variables
• Specification of model
• Choice of method for fitting the data
• Fitting of model
• Model validation and criticism
• Using the chosen model for the solution
47. Application of Regression Analysis
• Predictive Analytics
• Operation efficiency
• Supporting decisions
• Correcting errors
• New insights