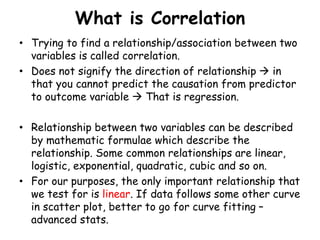
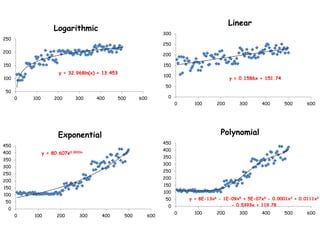
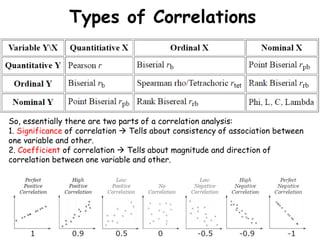
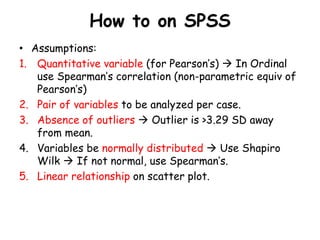
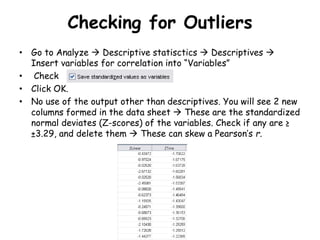
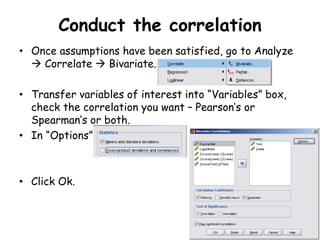
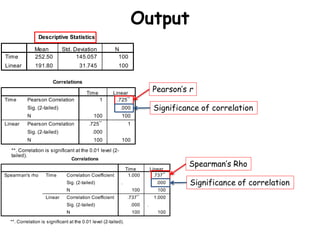
Inferential Statistics
Correlations
Dhritiman Chakrabarti
Assistant Professor,
Dept of Neuroanaesthesiology
and Neurocritical Care,
NIMHANS, Bangalore
What is Correlation
• Trying to find a relationship/association between two
variables is called correlation.
• Does not signify the direction of relationship  in
that you cannot predict the causation from predictor
to outcome variable  That is regression.
• Relationship between two variables can be described
by mathematic formulae which describe the
relationship. Some common relationships are linear,
logistic, exponential, quadratic, cubic and so on.
• For our purposes, the only important relationship that
we test for is linear. If data follows some other curve
in scatter plot, better to go for curve fitting –
advanced stats.
y = 32.968ln(x) + 13.453
50
100
150
200
250
0 100 200 300 400 500 600
Logarithmic
y = 0.1586x + 151.74
0
50
100
150
200
250
300
0 100 200 300 400 500 600
Linear
y = 80.607e0.0033x
0
50
100
150
200
250
300
350
400
450
0 100 200 300 400 500 600
Exponential
y = 8E-13x6 - 1E-09x5 + 5E-07x4 - 0.0001x3 + 0.0111x2
- 0.5393x + 119.780
50
100
150
200
250
300
350
400
450
0 100 200 300 400 500 600
Polynomial
Types of Correlations
So, essentially there are two parts of a correlation analysis:
1. Significance of correlation  Tells about consistency of association between
one variable and other.
2. Coefficient of correlation  Tells about magnitude and direction of
correlation between one variable and other.
How to do correlations
• Normally in biological sciences, correlations are
performed for measuring association between interval
and/or ordinal type variables, or as bivariate analysis
for inclusion/exclusion from regression model.
• Manual calculation is a bit lengthy. No point in going
into it.
• Correlation Coefficient can be seen as change in one
variable with unit change in other – in a bivariate
manner.
• Regression in change in dependent variable with unit
change in independent. Reg coeff changes if dep and
indep are reversed.
• But standardized coeff of univariate linear regression
with single predictor is same as pearson’s correlation
coeff.
How to on SPSS
• Assumptions:
1. Quantitative variable (for Pearson’s)  In Ordinal
use Spearman’s correlation (non-parametric equiv of
Pearson’s)
2. Pair of variables to be analyzed per case.
3. Absence of outliers  Outlier is >3.29 SD away
from mean.
4. Variables be normally distributed  Use Shapiro
Wilk  If not normal, use Spearman’s.
5. Linear relationship on scatter plot.
Checking for Outliers
• Go to Analyze  Descriptive statisctics  Descriptives 
Insert variables for correlation into “Variables”
• Check
• Click OK.
• No use of the output other than descriptives. You will see 2 new
columns formed in the data sheet  These are the standardized
normal deviates (Z-scores) of the variables. Check if any are ≥
±3.29, and delete them  These can skew a Pearson’s r.
Conduct the correlation
• Once assumptions have been satisfied, go to Analyze
 Correlate  Bivariate.
• Transfer variables of interest into “Variables” box,
check the correlation you want – Pearson’s or
Spearman’s or both.
• In “Options”
• Click Ok.
Output
Pearson’s r
Significance of correlation
Spearman’s Rho
Significance of correlation

Inferential statistics correlations

  • 1.
    Inferential Statistics Correlations Dhritiman Chakrabarti AssistantProfessor, Dept of Neuroanaesthesiology and Neurocritical Care, NIMHANS, Bangalore
  • 2.
    What is Correlation •Trying to find a relationship/association between two variables is called correlation. • Does not signify the direction of relationship  in that you cannot predict the causation from predictor to outcome variable  That is regression. • Relationship between two variables can be described by mathematic formulae which describe the relationship. Some common relationships are linear, logistic, exponential, quadratic, cubic and so on. • For our purposes, the only important relationship that we test for is linear. If data follows some other curve in scatter plot, better to go for curve fitting – advanced stats.
  • 3.
    y = 32.968ln(x)+ 13.453 50 100 150 200 250 0 100 200 300 400 500 600 Logarithmic y = 0.1586x + 151.74 0 50 100 150 200 250 300 0 100 200 300 400 500 600 Linear y = 80.607e0.0033x 0 50 100 150 200 250 300 350 400 450 0 100 200 300 400 500 600 Exponential y = 8E-13x6 - 1E-09x5 + 5E-07x4 - 0.0001x3 + 0.0111x2 - 0.5393x + 119.780 50 100 150 200 250 300 350 400 450 0 100 200 300 400 500 600 Polynomial
  • 4.
    Types of Correlations So,essentially there are two parts of a correlation analysis: 1. Significance of correlation  Tells about consistency of association between one variable and other. 2. Coefficient of correlation  Tells about magnitude and direction of correlation between one variable and other.
  • 5.
    How to docorrelations • Normally in biological sciences, correlations are performed for measuring association between interval and/or ordinal type variables, or as bivariate analysis for inclusion/exclusion from regression model. • Manual calculation is a bit lengthy. No point in going into it. • Correlation Coefficient can be seen as change in one variable with unit change in other – in a bivariate manner. • Regression in change in dependent variable with unit change in independent. Reg coeff changes if dep and indep are reversed. • But standardized coeff of univariate linear regression with single predictor is same as pearson’s correlation coeff.
  • 6.
    How to onSPSS • Assumptions: 1. Quantitative variable (for Pearson’s)  In Ordinal use Spearman’s correlation (non-parametric equiv of Pearson’s) 2. Pair of variables to be analyzed per case. 3. Absence of outliers  Outlier is >3.29 SD away from mean. 4. Variables be normally distributed  Use Shapiro Wilk  If not normal, use Spearman’s. 5. Linear relationship on scatter plot.
  • 7.
    Checking for Outliers •Go to Analyze  Descriptive statisctics  Descriptives  Insert variables for correlation into “Variables” • Check • Click OK. • No use of the output other than descriptives. You will see 2 new columns formed in the data sheet  These are the standardized normal deviates (Z-scores) of the variables. Check if any are ≥ ±3.29, and delete them  These can skew a Pearson’s r.
  • 8.
    Conduct the correlation •Once assumptions have been satisfied, go to Analyze  Correlate  Bivariate. • Transfer variables of interest into “Variables” box, check the correlation you want – Pearson’s or Spearman’s or both. • In “Options” • Click Ok.
  • 9.
    Output Pearson’s r Significance ofcorrelation Spearman’s Rho Significance of correlation