The document discusses different types of oscilloscopes including dual trace CROs, dual beam CROs, digital storage oscilloscopes, and sampling oscilloscopes. A dual trace CRO uses a single electron beam but an electronic switch to display two input signals simultaneously. A dual beam CRO has two separate electron beams and deflection systems allowing two signals to be displayed together in real-time. Digital storage oscilloscopes digitize and store input signals, allowing slow signals to be analyzed. Sampling oscilloscopes take samples from input signals over multiple cycles to display high-frequency signals beyond the bandwidth of its amplifiers.
A complete description of including circuit diagram, gain equation, features of Instrumentational amplifier , its working principle, applications, practical circuits, Proteus simulation and conclusion.
Uet, Peshawar Pakistan
Batch-06
This presentation contains the basic information you need to know about operational amplifier.
I have tried to cover all the basic info. If anything is left out or you have any suggestions i will appreciate it.
This document discusses measurement systems and signal conditioning. It defines key terms like measurement, instrumentation, variables, and data. It then describes the general structure of a measuring system with three stages: detection, signal conditioning, and display. It discusses different types of signal conditioning like amplification, protection, and elimination of interference. Different excitation sources and types of amplifiers are also summarized, including mechanical, fluid, optical, and electrical/electronic amplifiers. Finally, it briefly covers modulated and unmodulated signals.
This document discusses instrumentation amplifiers. It describes how instrumentation amplifiers can be used for both passive and active transducer measurements. It then discusses different types of instrumentation amplifier circuits including a differential amplifier using a single op-amp, an external circuit instrumentation amplifier, and a three op-amp instrumentation amplifier. The three op-amp instrumentation amplifier is described in more detail, noting that common mode rejection ratio (CMRR) and input impedance (Zin) are important attributes, and that Zin can be increased by adding buffers. Some applications of instrumentation amplifiers are also listed, such as in audio amplifiers, biomedical systems, power amplifiers, and analog computers.
The document describes the operation of a dual slope analog-to-digital converter (ADC). It consists of an integrator, comparator, counter, and reference voltage. In dual slope ADC, the analog input voltage is integrated for a fixed time and compared against the counter. Then, a reference voltage is integrated in the opposite direction until the integrator output reaches zero, at which point the counter value represents the digital output. The speed is slow but accuracy is high, as it corrects for drifts in the integrator.
This document discusses digital voltmeters (DVMs). It explains that DVMs display voltage measurements as numerical readings rather than using an analog needle gauge. The document covers various types of DVMs including ramp type, dual slope integrating type, successive approximation type, and microprocessor-based versions. It provides block diagrams and explanations of the operating principles for different DVM designs. Advantages of DVMs like accuracy, ease of reading, and versatility are also summarized.
1. Power measurements at microwave frequencies involve measuring average power rather than voltage and current. Common measurement techniques include Schottky diode detectors for low power, calorimeters for medium to high power, and bolometer bridges.
2. Calorimeters work by converting microwave power to heat and measuring the temperature change of a fluid. Static and circular calorimeters are used along with calorimeter wattmeters to measure unknown power.
3. Vector network analyzers measure both the amplitude and phase of microwave signals, allowing characterization of devices under test.
This ppt consists of an easy way to represent the basic idea of transducer, its types, constructional details, applications, advantages & disadvantages.
MEASUREMENT OF BIO POTENTIAL USING TWO ELECTRODES AND RECORDING PROBLEMSBharathasreejaG
YOU CAN LEARN ABOUT MEASUREMENT USING TWO ELECTRODES & RECORDING PROBLEMS# NEED OF MEDICAL RECORDING # ELECTRODE TO SKIN INTERFACE # NERNST EQUATION # NOISE DURING RECORDING# MOTION ARTIFACT# ELECTRODE TO ELECTROLYTE NOISE # ELECTROLYTE TO SKIN NOISE# THERMAL NOISE# AMPLIFICATION NOISE# CABLE MOVEMENT# OTHER NOISES # CODING FOR GENERATING NOISE
An operational amplifier (op-amp) is an integrated circuit that can amplify or compare signals. It consists of transistors, resistors, and capacitors. Op-amps are used to build amplifiers, summers, integrators, differentiators, and comparators. They obey golden rules to make the difference between their input pins zero. Op-amps are also used in analog to digital converters, which sample analog signals and convert them to digital signals for processing.
This document discusses different types of multi-input oscilloscopes. It describes the key differences between single beam oscilloscopes and double beam oscilloscopes. Double beam oscilloscopes can display two signals simultaneously using two separate electron beams, allowing the entire signals to be captured without losing information, unlike dual trace oscilloscopes which use a single beam and can miss fast transient events by not being able to switch quickly enough. The document outlines the construction of a double beam oscilloscope, including how it generates two electron beams either through a double gun tube or split beam method.
The document discusses phase-shift keying (PSK) modulation techniques. It begins with an introduction to PSK and how it uses phases to encode digital data. It then discusses binary phase-shift keying (BPSK) which uses two phases separated by 180 degrees to encode one bit per symbol. BPSK is robust but has a low data rate. Quadrature phase-shift keying (QPSK) is then introduced, which uses four phases separated by 90 degrees to encode two bits per symbol, doubling the data rate of BPSK. Implementations of BPSK and QPSK modulators and demodulators are provided along with diagrams of their constellation plots.
Transmission lines are physical connections between two locations that transmit electromagnetic waves. They have characteristic parameters including resistance, inductance, capacitance, and conductance per unit length. These parameters depend on the line's geometry and materials. Transmission line equations relate the voltage and current at each point on the line based on these parameters. A line has a characteristic impedance that is the ratio of voltage to current. Reflection and transmission of waves occurs at impedance discontinuities like at the load. Lossless lines propagate waves without attenuation, while finite lines are analyzed using reflection coefficients at the generator and load terminations.
dso is use for measurement ac as well as dc voltage and current.
and also use for faulty components in various circuit .it stored wave form in digital memory.it easy to operate. cursor measurement is possible.
This Presentation provides some basics of Sensors Technology.........
It gives few ideas to learn about sensors which are as normally used as electrical & electronics applications.......
This document discusses voltage series feedback amplifiers. It defines voltage series feedback as a voltage amplifier topology where voltage is sampled at the output and mixed at the input. The key properties are:
- The voltage gain (Av) is VO/VI and the feedback factor (β) is Vf/Vo.
- Input resistance (Rif) increases compared to the open loop input resistance (Ri), where Rif = Ri(1 + βAv).
- Output resistance (Rof) decreases compared to the open loop output resistance (Ro), where Rof = Ro/(1 + βAv).
This document discusses the basics of differential amplifiers. It defines differential amplifiers as circuits that amplify the difference between two input signals. It describes the differential gain, common mode gain, and common mode rejection ratio of differential amplifiers. It also outlines the four main configurations that differential amplifiers can have: dual input balanced output, dual input unbalanced output, single input balanced output, and single input unbalanced output. The document is intended as an introduction to differential amplifiers.
This document discusses amplitude modulation (AM) as a type of modulation used to transmit information signals. Modulation involves varying a high frequency carrier signal by an information signal in order to transmit the information signal over long distances. In AM, the amplitude of the carrier signal is varied in accordance with the instantaneous amplitude of the modulating or information signal. This creates two new sideband frequencies above and below the carrier frequency equal to the modulation frequency. The carrier and sidebands together make up the modulated signal. Only a portion of the transmitted power is present in the sidebands containing the information, while the rest is wasted in the carrier.
Telemetry involves measuring values at a remote location and transmitting the data to another location. It involves three steps - measuring a value, converting it to a signal, transmitting the signal, and reconverting it back to the original data. Factors like accuracy, whether the data is analog or digital, error detection/correction, and bandwidth influence telemetry system design. There are two main types - landline systems which use wires/cables over short distances, and radio frequency systems which use radio links from 1km to beyond 50km. Landline systems transmit current or voltage and have simple circuitry but limited range. Radio frequency systems transmit via radio links and are used for long range applications like spacecraft. Modulation schemes include amplitude modulation for
The document discusses the instrumentation amplifier (IA). It begins by introducing the IA, noting its high input impedance, precisely adjustable gain using a single resistor, and high common mode rejection. It then describes the two stages of an IA: the first offers high input impedance and sets the gain, while the second is a differential amplifier with feedback and grounding that offers very high input impedance. Applications discussed include using a thermistor in a bridge circuit with an IA to indicate temperature.
The document discusses the cathode ray oscilloscope (CRO), which is an electronic test instrument used to observe changing electrical signals over time. It describes the key components of a CRO including the cathode ray tube, vertical/horizontal controllers, triggers, and displays. The document explains how a CRO works by amplifying input signals and using electron beams to produce waveforms on the screen. Various sweep modes, synchronization methods, and applications of CROs for measuring voltage, current, and examining waveforms are also covered.
The document presents information on digital to analog conversion (DAC). It discusses the basic concept of DAC, where a digital input is converted to a proportional analog output. It then describes two common types of DAC - the weighted resistor DAC and R-2R ladder DAC. Applications of DACs are also highlighted, such as in digital audio, function generators, and motor controllers. The document provides details on the circuit design and output calculation for both weighted resistor and R-2R ladder DACs. It concludes that the R-2R ladder DAC only requires two resistor values but has slower conversion than the weighted resistor DAC.
Classification of signals and systems as well as their properties are given in the PPT .Examples related to types of signals and systems are also given .
This document discusses phase lead and lag compensators for digital control systems. It covers:
1. Designing a discrete-time phase lead/lag compensator by mapping the z-plane to the w-plane using bilinear transformation.
2. Defining phase lead and lag compensators based on the positions of poles and zeros in the w-domain transfer function.
3. A design approach using frequency response methods to meet a phase margin specification by determining the parameters of a first-order digital phase lead or lag compensator.
4. Examples of designing phase lead and lag compensators for different plant transfer functions to meet specifications on phase margin and steady state error.
The document discusses smart sensors, providing details on their architecture, fabrication, advantages, disadvantages and applications. Some key points:
- Smart sensors integrate a sensor, analog/digital converter, processor and communication interface on a single chip, allowing them to process and communicate sensor data.
- The basic architecture includes a sensing element, amplifier, ADC, memory, processor and communication components. Fabrication uses techniques like micro-machining and bonding.
- Advantages are reduced system load and faster operation. Applications include industrial monitoring, automotive controls, biomedical devices, and smart dust networks of tiny sensors. Disadvantages include higher initial costs and issues with mixing old and new devices.
A dual beam oscilloscope can display two signals simultaneously using a CRT that generates and deflects two separate electron beams. It avoids issues with dual trace oscilloscopes that time share a single beam. A dual trace oscilloscope displays two signals by rapidly switching a single beam between the two input channels. Sampling oscilloscopes convert fast signals to low frequency domains by taking samples over successive cycles. Digital storage oscilloscopes digitize input waveforms and store them in memory for display, allowing non-repetitive signals to be observed. Oscilloscope probes come in passive and active varieties, with 1x, 10x, and 100x attenuation ratios for passive probes and integrated circuits in active probes for improved performance
An oscilloscope converts electrical signals into visual waveforms displayed on a screen. A dual-trace oscilloscope can display two such waveforms simultaneously, allowing easy comparison of inputs and outputs like those of an amplifier. It uses a single electron beam that is rapidly switched between two input channels to draw the two traces, whereas a dual-beam oscilloscope uses two separate electron beams. A dual-trace oscilloscope can operate in either alternate or chopped mode to display the two signals.
The document discusses several types of specialized oscilloscopes:
1. Delayed time base oscilloscopes allow studying all parts of a pulse waveform by delaying the signal to the vertical plates. This ensures no part of the waveform is lost.
2. Analog storage oscilloscopes can retain an image for longer periods through mesh or phosphor storage techniques, allowing viewing of very low frequency waveforms.
3. Sampling oscilloscopes use a staircase-ramp generator to take samples that are displayed as the beam moves across the screen. Synchronization ensures sampling is timed with the input signal frequency.
4. Digital storage oscilloscopes digitize the input signal using an analog-to-
IT CONTAINs all the subtopics related to it. it has BloAck diagram, internal working and much more.
Subject; Measurement & Instrumentation
Teacher; ma'am Falak Naz Pathan
MEHRAN UET SZAB CAMPUS KHAIRPUR MIR'S
- Analog storage oscilloscopes capture signals using one of two techniques: analog or digital storage. Analog storage allows for higher speeds but is less versatile than digital storage.
- The principle of secondary emission explains how electrons emitted from a target surface can be collected. The ratio of secondary emitted electrons to primary beam electrons is called the secondary emission ratio.
- Variable persistence storage oscilloscopes use a storage mesh and phosphor screen to display signals. A writing gun charges areas of the storage mesh, and a flood gun makes the phosphor glow to display the stored image for about a minute before fading occurs.
There are two main types of oscilloscopes - analog and digital. Analog oscilloscopes process signals using only analog techniques while digital oscilloscopes digitize signals for processing and analysis. A digital storage oscilloscope works by digitizing the input analog signal, storing it in memory cells, then converting it back to analog for display on a CRT. It allows for more advanced analysis compared to analog but has limitations like reduced resolution at high sampling rates and inability to accept inputs during digitization.
This document provides an overview of cathode ray oscilloscopes (CROs). It discusses the introduction and basic diagram of a CRO, describing the main components of the cathode ray tube. It also covers multi-input oscilloscopes, describing the alternate and chopped modes of dual trace oscilloscopes and methods for generating dual beams. Additionally, it discusses Lissajous patterns generated from two input signals and how they can be used to measure frequency and phase. Finally, it provides an overview of digital storage oscilloscopes, including their block diagram and advantages over analog storage oscilloscopes.
Cathode Ray Oscilloscope CRO & Digital Oscilloscope 'S WORKINGAbdul Qayoom Mangrio
it contain the working of CRO & DO
IT CONTAINs all the subtopics related to it. it has Block diagram, internal working and much more.
Subject; Measurement & Instrumentation
Teacher; ma'am Falak Naz Pathan
MEHRAN UET SZAB CAMPUS KHAIRPUR MIR'S
This document provides an overview of cathode ray oscilloscopes (CROs). It discusses the basic components and workings of a CRO, including the electron gun, deflection plates, and screen. It also describes multi-input oscilloscopes that can display two or more signals, and the alternate and chopped modes. Lissajous patterns generated from two input frequencies are discussed for measuring frequency and phase. Digital storage oscilloscopes are introduced as being able to store waveforms indefinitely compared to analog storage oscilloscopes.
The document provides an overview of the oscilloscope by explaining that it is a graph-displaying device that draws a graph of an electrical signal over time, with voltage on the vertical axis and time on the horizontal axis. It then describes how an oscilloscope can be used to determine signal parameters like frequency, see circuit components represented by a signal, check for signal distortions, and more. The document also summarizes how analog and digital oscilloscopes work and key oscilloscope specifications and controls.
1.Oscilloscope. 2.Block diagram of Oscilloscope. 3.Types of Oscilloscope. 4.A...AL- AMIN
1.Oscilloscope.
2.Block diagram of Oscilloscope.
3.Types of Oscilloscope.
4.Applications of Oscilloscope.
5.Signal generator.
6. Types of signal generator.
7. Frequency synthesizer.
8.Analyzer.
9.Types of analyzer
The document discusses different types of oscilloscopes and function generators. It describes cathode-ray oscilloscopes (CROs), dual-beam oscilloscopes, analog storage oscilloscopes, digital oscilloscopes, mixed-signal oscilloscopes, and handheld oscilloscopes. It also discusses function generator controls, types of function generators including analog and digital, and sweep function generators. The document provides details on the systems and controls of oscilloscopes, including vertical, horizontal, and trigger systems. It explains the basic workings and applications of different oscilloscope and function generator types.
The document discusses the components and functions of an oscilloscope. It describes the cathode ray tube, electron gun, and deflection plates that are used to display signal waveforms on screen. It explains how the front panel controls like timebase, volts/div, and focus are used to measure and analyze signals. Applications of oscilloscopes mentioned include measuring voltage, displaying waveforms, and determining frequency and time intervals of signals.
cathode ray oscilloscope &function generatormegha agrawal
The document provides information about operating a cathode-ray oscilloscope (CRO). It describes the key components of a CRO including the cathode ray tube, electron gun, and horizontal and vertical deflection plates. It explains how a CRO works by deflecting an electron beam horizontally and vertically using sawtooth waveforms to display voltage signals on the screen as waveforms. It also lists and describes the main controls of a CRO including those for the vertical, horizontal and trigger sections.
The document is a lab manual for experiments with analog electronics and cathode ray oscilloscopes (CROs). It includes:
1) An introduction to CRO components and how they work to display voltage signals over time.
2) Instructions for two experiments - the first to familiarize students with CRO functions like measuring voltage, current, frequency and phase shift. The second examines the performance of half wave, full wave and bridge rectifiers with and without capacitor filters.
3) Details on CRO measurements including amplitude, frequency, and the design of rectifier circuits.
The document discusses electronic voltmeters and digital multimeters. It provides details on:
1) How electronic voltmeters use amplifiers to accurately measure both AC and DC voltages with high input impedance, overcoming issues with moving coil voltmeters.
2) The working principles of analog and digital electronic voltmeters and multimeters, which convert inputs to DC voltages before measurement.
3) Features like low power consumption, ability to measure low-level signals and high frequencies, and advantages of digital displays.
This document provides an overview of cathode ray oscilloscopes (CROs). It discusses the basic components and workings of a CRO, including the electron gun assembly, deflection plates, and screen. It describes how multi-input oscilloscopes can have two or more input channels displayed in alternate or chopped mode. Lissajous patterns produced by two sinusoidal signals are also covered. Digital storage oscilloscopes are introduced, with key differences from analog storage oscilloscopes noted. Applications of CROs include frequency, amplitude, and phase measurement.
Cathode ray oscilloscope and related experimentsTrisha Banerjee
This document discusses the use and operation of cathode ray oscilloscopes. It describes the basic components of an oscilloscope including the electron gun, deflection plates, and phosphor screen. It explains how oscilloscopes are used to observe and measure the amplitude, frequency, and timing of electrical signals. Specialized oscilloscopes can analyze signal spectra. The document also discusses focus, intensity, and timebase controls for adjusting the oscilloscope display. Examples of oscilloscope use include examining Fourier analysis, resonating LCR circuits, and measuring dual signal time bases.
GraphRAG for Life Science to increase LLM accuracyTomaz Bratanic
GraphRAG for life science domain, where you retriever information from biomedical knowledge graphs using LLMs to increase the accuracy and performance of generated answers
Ivanti’s Patch Tuesday breakdown goes beyond patching your applications and brings you the intelligence and guidance needed to prioritize where to focus your attention first. Catch early analysis on our Ivanti blog, then join industry expert Chris Goettl for the Patch Tuesday Webinar Event. There we’ll do a deep dive into each of the bulletins and give guidance on the risks associated with the newly-identified vulnerabilities.
Digital Marketing Trends in 2024 | Guide for Staying AheadWask
https://www.wask.co/ebooks/digital-marketing-trends-in-2024
Feeling lost in the digital marketing whirlwind of 2024? Technology is changing, consumer habits are evolving, and staying ahead of the curve feels like a never-ending pursuit. This e-book is your compass. Dive into actionable insights to handle the complexities of modern marketing. From hyper-personalization to the power of user-generated content, learn how to build long-term relationships with your audience and unlock the secrets to success in the ever-shifting digital landscape.
Programming Foundation Models with DSPy - Meetup SlidesZilliz
Prompting language models is hard, while programming language models is easy. In this talk, I will discuss the state-of-the-art framework DSPy for programming foundation models with its powerful optimizers and runtime constraint system.
Your One-Stop Shop for Python Success: Top 10 US Python Development Providersakankshawande
Simplify your search for a reliable Python development partner! This list presents the top 10 trusted US providers offering comprehensive Python development services, ensuring your project's success from conception to completion.
How to Interpret Trends in the Kalyan Rajdhani Mix Chart.pdfChart Kalyan
A Mix Chart displays historical data of numbers in a graphical or tabular form. The Kalyan Rajdhani Mix Chart specifically shows the results of a sequence of numbers over different periods.
Have you ever been confused by the myriad of choices offered by AWS for hosting a website or an API?
Lambda, Elastic Beanstalk, Lightsail, Amplify, S3 (and more!) can each host websites + APIs. But which one should we choose?
Which one is cheapest? Which one is fastest? Which one will scale to meet our needs?
Join me in this session as we dive into each AWS hosting service to determine which one is best for your scenario and explain why!
Freshworks Rethinks NoSQL for Rapid Scaling & Cost-EfficiencyScyllaDB
Freshworks creates AI-boosted business software that helps employees work more efficiently and effectively. Managing data across multiple RDBMS and NoSQL databases was already a challenge at their current scale. To prepare for 10X growth, they knew it was time to rethink their database strategy. Learn how they architected a solution that would simplify scaling while keeping costs under control.
5th LF Energy Power Grid Model Meet-up SlidesDanBrown980551
5th Power Grid Model Meet-up
It is with great pleasure that we extend to you an invitation to the 5th Power Grid Model Meet-up, scheduled for 6th June 2024. This event will adopt a hybrid format, allowing participants to join us either through an online Mircosoft Teams session or in person at TU/e located at Den Dolech 2, Eindhoven, Netherlands. The meet-up will be hosted by Eindhoven University of Technology (TU/e), a research university specializing in engineering science & technology.
Power Grid Model
The global energy transition is placing new and unprecedented demands on Distribution System Operators (DSOs). Alongside upgrades to grid capacity, processes such as digitization, capacity optimization, and congestion management are becoming vital for delivering reliable services.
Power Grid Model is an open source project from Linux Foundation Energy and provides a calculation engine that is increasingly essential for DSOs. It offers a standards-based foundation enabling real-time power systems analysis, simulations of electrical power grids, and sophisticated what-if analysis. In addition, it enables in-depth studies and analysis of the electrical power grid’s behavior and performance. This comprehensive model incorporates essential factors such as power generation capacity, electrical losses, voltage levels, power flows, and system stability.
Power Grid Model is currently being applied in a wide variety of use cases, including grid planning, expansion, reliability, and congestion studies. It can also help in analyzing the impact of renewable energy integration, assessing the effects of disturbances or faults, and developing strategies for grid control and optimization.
What to expect
For the upcoming meetup we are organizing, we have an exciting lineup of activities planned:
-Insightful presentations covering two practical applications of the Power Grid Model.
-An update on the latest advancements in Power Grid -Model technology during the first and second quarters of 2024.
-An interactive brainstorming session to discuss and propose new feature requests.
-An opportunity to connect with fellow Power Grid Model enthusiasts and users.
Building Production Ready Search Pipelines with Spark and MilvusZilliz
Spark is the widely used ETL tool for processing, indexing and ingesting data to serving stack for search. Milvus is the production-ready open-source vector database. In this talk we will show how to use Spark to process unstructured data to extract vector representations, and push the vectors to Milvus vector database for search serving.
Taking AI to the Next Level in Manufacturing.pdfssuserfac0301
Read Taking AI to the Next Level in Manufacturing to gain insights on AI adoption in the manufacturing industry, such as:
1. How quickly AI is being implemented in manufacturing.
2. Which barriers stand in the way of AI adoption.
3. How data quality and governance form the backbone of AI.
4. Organizational processes and structures that may inhibit effective AI adoption.
6. Ideas and approaches to help build your organization's AI strategy.
FREE A4 Cyber Security Awareness Posters-Social Engineering part 3Data Hops
Free A4 downloadable and printable Cyber Security, Social Engineering Safety and security Training Posters . Promote security awareness in the home or workplace. Lock them Out From training providers datahops.com
For the full video of this presentation, please visit: https://www.edge-ai-vision.com/2024/06/temporal-event-neural-networks-a-more-efficient-alternative-to-the-transformer-a-presentation-from-brainchip/
Chris Jones, Director of Product Management at BrainChip , presents the “Temporal Event Neural Networks: A More Efficient Alternative to the Transformer” tutorial at the May 2024 Embedded Vision Summit.
The expansion of AI services necessitates enhanced computational capabilities on edge devices. Temporal Event Neural Networks (TENNs), developed by BrainChip, represent a novel and highly efficient state-space network. TENNs demonstrate exceptional proficiency in handling multi-dimensional streaming data, facilitating advancements in object detection, action recognition, speech enhancement and language model/sequence generation. Through the utilization of polynomial-based continuous convolutions, TENNs streamline models, expedite training processes and significantly diminish memory requirements, achieving notable reductions of up to 50x in parameters and 5,000x in energy consumption compared to prevailing methodologies like transformers.
Integration with BrainChip’s Akida neuromorphic hardware IP further enhances TENNs’ capabilities, enabling the realization of highly capable, portable and passively cooled edge devices. This presentation delves into the technical innovations underlying TENNs, presents real-world benchmarks, and elucidates how this cutting-edge approach is positioned to revolutionize edge AI across diverse applications.
“Temporal Event Neural Networks: A More Efficient Alternative to the Transfor...
Types of cro
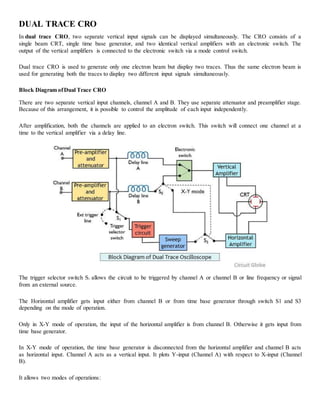
1. DUAL TRACE CRO
In dual trace CRO, two separate vertical input signals can be displayed simultaneously. The CRO consists of a
single beam CRT, single time base generator, and two identical vertical amplifiers with an electronic switch. The
output of the vertical amplifiers is connected to the electronic switch via a mode control switch.
Dual trace CRO is used to generate only one electron beam but display two traces. Thus the same electron beam is
used for generating both the traces to display two different input signals simultaneously.
Block Diagram ofDual Trace CRO
There are two separate vertical input channels, channel A and B. They use separate attenuator and preamplifier stage.
Because of this arrangement, it is possible to control the amplitude of each input independently.
After amplification, both the channels are applied to an electron switch. This switch will connect one channel at a
time to the vertical amplifier via a delay line.
The trigger selector switch S2 allows the circuit to be triggered by channel A or channel B or line frequency or signal
from an external source.
The Horizontal amplifier gets input either from channel B or from time base generator through switch S1 and S3
depending on the mode of operation.
Only in X-Y mode of operation, the input of the horizontal amplifier is from channel B. Otherwise it gets input from
time base generator.
In X-Y mode of operation, the time base generator is disconnected from the horizontal amplifier and channel B acts
as horizontal input. Channel A acts as a vertical input. It plots Y-input (Channel A) with respect to X-input (Channel
B).
It allows two modes of operations:
2. 1. The alternate mode.
2. The chopped mode.
Alternate Mode (ALT Mode)
In the alternate mode, the electronic switch connects the two channels A and B alternately in the successive cycles of
the time base generator. Thus two channels are alternately connected to the vertical amplifier.
The switching rate of the CRT is controlled by the sweep rate of the time base generator. Hence, the CRO alternately
displays the two vertical signals. Each vertical amplifier has its own calibrated input alternators and position controls
so that the amplitude of each signal can be separately adjusted.
Alternate Mode
The alternate mode is used for the high-frequency signal. Time base is set at high speed so that both the traces appear
as continuous trace instead of alternate trace.
Chopped (Chop) Mode
In the chopped mode, the electronic switch will make several transitions from one channel to the other during one
sweep.
A free-running oscillator is used to control the position of the electronic switch.
As the electronic switch is running at very high speed, each channel is displayed for a very short time.
3. Chop Mode
The switching rate of the electronic switch or chopping rate is approximately 100 kHz or 0.01 msec.
This is of greater use for simultaneous observation of the low-frequency signals, whose frequency is much lower
than the chopping frequency.
Dual Beam CRO
The dual beam CRO is built around a special CRT, which displays two completely independent beams.
It has two separate electron beams. Each electron beams has its own independent sets of vertical and horizontal
deflection plates.
The time base generator is common for both the channels and beams.
Block Diagram ofDual Beam CRO
Dual Beam CRO
4. If the two channels can have an independent time base circuit than they produce different sweep rates for an
individual channel. This will also increase the weight and size of an oscilloscope.
Each channel has separate attenuator, delay line, and amplifier.
Two methods are used for generating two electron beams within CRT.
Using double electron gun
Using a beam splitting method
In double electron gun generators two electron beam separately. So the brightness and focus of each electron beam
can be controlled separately. But it increases weight.
In the split beam method, the last anode has two apertures through which two beams emerge.
Difference between Dual Trace and Dual Beam CRO
Dual Trace CRO Dual Beam CRO
A single electron beam is used to display two traces.
Two electron beams are used to display two
signals.
One main vertical amplifier is used. Two main vertical amplifiers are used.
Two fast transient events cannot be captured. Two fast transient events can be captured.
Two signals cannot be displayed together in real-
time.
Two signals can be displayed simultaneously in
real-time.
The circuit operates either in alternate mode or
chops mod to obtain two traces using one electron
beam.
Two electron beams are obtained either by using
two-electron gun or by using the beam-splitting
technique.
The frequency of both the signals should be
multiple of each other for a stable display of both
the traces as both the signals are controlled by a
one-time base.
If two-time bases are used then the frequency of
both the signals should not be multiple of each
other for a stable display.
5. Digital Storage Oscilloscope
Definition: The digital storage oscilloscope is an instrument which gives the storage of a digital
waveform or the digital copy of the waveform. It allows us to store the signal or the waveform in
the digital format, and in the digital memory also it allows us to do the digital signal processing
techniques over that signal. The maximum frequency measured on the digital signal oscilloscope
depends upon two things they are: sampling rate of the scope and the nature of the converter. The
traces in DSO are bright, highly defined, and displayed within seconds.
Block Diagram of Digital Storage Oscilloscope
The block diagram of the digital storage oscilloscope consists of an amplifier, digitizer, memory,
analyzer circuitry. Waveform reconstruction, vertical plates, horizontal plates, cathode ray tube
(CRT), horizontal amplifier, time base circuitry, trigger, and clock. The block diagram of the digital
storage oscilloscope is shown in the below figure.
Digital Storage Oscilloscope Block Diagram
As seen in the above figure, at first the analog input signal is amplified by amplifier if it has any
weak signal. After amplification, the signal is digitized by the digitizer and that digitized signal
stores in memory. The analyzer circuit process the digital signal after that the waveform is
reconstructed (again the digital signal is converted into an analog form) and then that signal is
applied to vertical plates of the cathode ray tube (CRT).
The cathode ray tube has two inputs they are vertical input and horizontal input. The vertical input
signal is the ‘Y’ axis and the horizontal input signal is the ‘X’ axis. The time base circuit is
triggered by the trigger and clock input signal, so it is going to generate the time base signal which
is a ramp signal. Then the ramp signal is amplified by the horizontal amplifier, and this horizontal
amplifier will provide input to the horizontal plate. On the CRT screen, we will get the waveform
of the input signal versus time.
6. The digitizing occurs by taking a sample of the input waveform at periodic intervals. At the
periodic time interval means, when half of the time cycle is completed then we are taking the
samples of the signal. The process of digitizing or sampling should follow the sampling theorem.
The sampling theorem says that the rate at which the samples are taken should be greater than twice
the highest frequency present in the input signal. When the analog signal is not properly converted
into digital then there occurs an aliasing effect.
When the analog signal is properly converted into digital then the resolution of the A/D converter
will be decreased. When the input signals stored in analog store registers can be read out at a much
slower rate by the A/D converter, then the digital output of the A/D converter stored in the digital
store, and it allows operation up to 100 mega samples per second. This is the working principle of a
digital storage oscilloscope.
DSO Operation Modes
The digital storage oscilloscope works in three modes of operations they are roll mode, store mode,
and hold or save mode.
Roll Mode: In roll mode, very fast varying signals are displayed on the display screen.
Store Mode: In the store mode the signals stores in memory.
Hold or Save Mode: In hold or save mode, some part of the signal will hold for some time and
then they will be stored in memory.
These are the three modes of digital storage oscilloscope operation.
Waveform Reconstruction
There are two types of waveform reconstructions they are linear interpolation and sinusoidal
interpolation.
Linear Interpolation: In linear interpolation, the dots are joined by a straight line.
Sinusoidal Interpolation: In sinusoidal interpolation, the dots are joined by a sine wave.
Waveform Reconstruction of Digital Storage Oscilloscope
7. Difference between Digital Storage Oscilloscope and Conventional Storage
Oscilloscope
The difference between DSO and the conventional storage oscilloscope or analog storage
oscilloscope (ASO) is shown in the below table.
S.NO Digital Storage Oscilloscope Conventional Storage Oscilloscope
1
The digital storage oscilloscope collects
data always After triggering only, the conventional storage
oscilloscope collects data
2 The cost of the tube is cheap The cost of the tube is costlier
3
For higher frequency signals the DSO
produce bright images
For higher frequency signals the ASO cannot
produce bright images
4
The resolution is higher in digital storage
oscilloscope
The resolution is lower in conventional storage
oscilloscope
5 In DSO an operating speed is less In ASO an operating speed is less
Advantages
1. They possess infinite storage time.
2. It can be easily operated.
3. Digital storage oscilloscope allows flexible display property.
Applications
1. It is used in audio and video recording.
2. It is used in radio broadcasting for signal testing.
3. In circuit debugging, it is used for testing of the voltage of the signal.
8. Sampling Oscilloscope:
Definition: Sampling Oscilloscope is an instrument that is used to generate waveform by collecting
various samples of an electrical signal. It is basically an advancement of digital oscilloscope having
additional features for special purposes.
In sampling oscilloscope from various portions of the waveforms, different samples are taken, over
consecutive cycles and the overall image is shown on screen as a continuous wave. In order to create a
waveform around 1000 points are to be needed.
It is to be noted here that, before getting displayed, the resultant waveform is amplified with the help of
a low bandwidth amplifier. These instruments are used to observe high-frequency signal that lies
beyond 50 GHz range. A high-frequency waveform is achieved at the output of the oscilloscope as
compared to the slope sample rate.
Block diagram and Working of Sampling Oscilloscope
The figure below shows the block diagram of the sampling oscilloscope:
Here, as we can see the input signal is fed into the sampling gate. When the sampling pulse is provided
to the sampling gate, it gets open in order to sample the input waveform. It is noteworthy that sampling
is to be done in synchronization with the frequency of the applied input signal.
The vertical amplifier employed in the circuit delays the input signal and after amplification, the signal
is given to the vertical plates.
When the sampling cycle begins, the oscillator gets activated by the trigger pulses. Due to which, linear
ramp output voltage is produced. The signal generated from the ramp generator is then fed to the
voltage comparator unit.
9. Here, the ramp signal gets compared with the staircase signal, generated by the staircase generator.
During comparison when the amplitude of the two signals is equal, it advances the staircase by one
step. Thus generating a sampling pulse. This again opens the sampling gate and the cycle is repeated in
a similar manner.
The size of the steps generated by the staircase generator determines the resolutionof the image at the
output. When the size of the steps is smaller, the number of samples will be larger. Thus, the image
resolution will be higher.
The figure below shows the waveforms at the various blocks of the sampling oscilloscope:
The frequency of samples in the Sampling Oscilloscope can be as low as one-hundredth of the input
signal frequency. Thus we can say for the input signal frequency of 1 GHz only 10 MHz amplifier
bandwidth is needed.
Advantages of sampling oscilloscope
It is advantageous using a sampling oscilloscope, as it can measure high-speed electrical signals.
By using sampling techniques, the input signal can be instantly transformed into a signal in a
low-frequency domain. Further circuitry produces a highly efficient display.
It has the ability to react and store information in the form of rapid bits.
Disadvantage of sampling oscilloscope
Sampling oscilloscope allows the measurement to be done on signals having repetitive
waveforms.