This lesson plan teaches students how to graph linear functions using x-intercepts and y-intercepts. It includes the following:
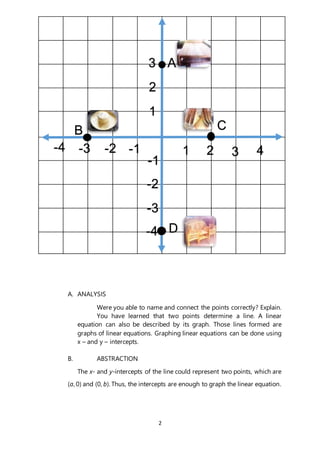
1) An activity where students name local products on a graph and connect points to form lines representing stores.
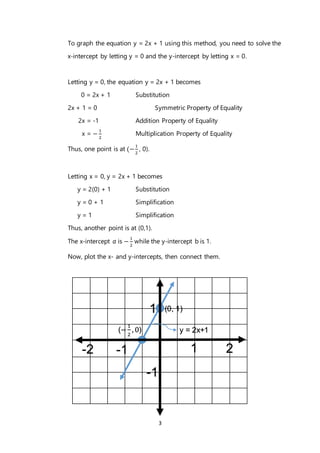
2) An explanation of how two points determine a line and how linear equations can be graphed using intercepts. Students practice finding the intercepts of an example equation.
3) An application where students graph equations using given intercepts and an assessment where they graph additional equations and find intercepts of other equations.